Notebookcheck Logo

Обзор ноутбука Dell Inspiron 16 Plus 7640: Небольшие, но важные изменения по сравнению с прошлогодней моделью

Теперь поддерживает два SSD. На первый взгляд он выглядит точно как Inspiron 16 Plus 7630, но Inspiron 16 Plus 7640 несет в себе несколько нововведений, о которых стоит узнать перед покупкой
Dell Inspiron 16 Plus 7640

Dell Inspiron 16 Plus 7640, получившая соответствующее название, заменяет модель Inspiron 16 Plus 7630 2023 с новыми процессорами с поддержкой искусственного интеллекта вместо прошлогодних вариантов Raptor Lake-H. За исключением нескольких других незначительных изменений внутри и снаружи, модель в целом идентична своему предшественнику, поэтому мы рекомендуем ознакомиться с нашим обзор Inspiron 15 Plus 7630 чтобы узнать больше о физических характеристиках Inspiron 15 Plus 7640.

Inspiron 16 Plus 7640 поставляется в различных конфигурациях: от 13-го поколения Core i7-13620H до 14-го поколения Core Ultra 9 185H, от интегрированной графики UHD или Arc до дискретной GeForce RTX 4060, а также с дисплеями 1200p или 1600p. AMD Zen 4 SKU с Ryzen 5 8540U или Ryzen 7 8840U также доступны, хотя и только для обычной модели Inspiron 16 7640 без плюсов, без дискретной графики или опции 1600p. Наше тестовое устройство представляет собой конфигурацию верхнего ценового диапазона с Core Ultra 7 155H, дисплеем 1600p и графикой RTX 4060 по цене около $1300 в розницу.

Конкурентами являются другие 16-дюймовые мультимедийные ноутбуки среднего ценового диапазона, такие как Asus VivoBook Pro 16, Lenovo Yoga 7 2-в-1 16IML9, или Серия HP Envy 16.

Больше обзоров Dell:

Хорошо (83%) Dell Inspiron 16 Plus 7640 Intel Core Ultra 7 155HNVIDIA GeForce RTX 4060 Laptop GPU Multimedia - 21 June 2024 - v8
Тестовый образец выдан нам компанией Dell
Сохранить защищённую авторским правом картинку с итоговым рейтингом в формате PNG / SVG
Dell Inspiron 16 Plus 7640 (Inspiron 16 Серия)
Процессор
Intel Core Ultra 7 155H 16 x 3.8 - 4.8 GHz, 97 W PL2 / Short Burst, 44 W PL1 / Sustained, Meteor Lake-H
Графический адаптер
NVIDIA GeForce RTX 4060 Laptop GPU - 8 Гбайт VRAM, Видеопр-р: 2010 МГц, Память: 2000 МГц, 70 W TDP, GDDR6, 555.99, Optimus
ОЗУ
16 Гбайт 
, DDR5, 5200 MT/s, Dual-Channel, 46-45-45-90
Дисплей
16.00 дюйм. 16:10, 2560 x 1600 пикс. 189 точек/дюйм, AU Optronics B160QAN, IPS, Dell P/N: P3FPJ, глянцевое покрытие: Нет, 120 Hz
Материнская плата
Intel Meteor Lake-U/P/H PCH
Хранение данных
SK hynix BC901 HFS001TEJ4X164N, 1024 Гбайт 
Звуковая плата
Intel Meteor Lake-U/P/H PCH - cAVS (Audio, Voice, Speech)
Интерфейсы
3 USB 3.0 / 3.1 Gen 1, 1 Thunderbolt, USB-C Power Delivery (PD), 1 HDMI, 1 DisplayPort, Аудиоразъёмы: 3.5 mm headset, картридер: MicroSD, 1 сканер подушечки пальца
Коммуникации
Intel Wi-Fi 6E AX211 (a/b/g/h/n = Wi-Fi 4/ac = Wi-Fi 5/ax = Wi-Fi 6/ Wi-Fi 6E 6 GHz), Bluetooth 5.3
Габариты
толщина х ширина х глубина (мм): 19.9 x 356.78 x 250.6
Аккумулятор
90 Вт⋅ч
Операционная система
Microsoft Windows 11 Home
Камера
Фронтальная камера: 1080p
осн. камера: 2.1 МП
Дополнительно
акустическая система: Quad speakers, 2W x4, клавиатура: Chiclet, подсветка клавиатуры: ✔, MyDell, 12 мес. гарантии в Европе
Вес
2.209 килогр., адаптер питания: 489 г
Стоимость
1300 USD
Внимание: Разные образцы одной и той же модели часто используют неодинаковые компоненты! (Матрица AUO вместо BOE, память Hynix вместо Samsung, накопитель SATA вместо PCIe, ...)


Соперники

Рейтинг
Дата
Модель
Вес
Height
Размер
Разрешение
Стоимость от
83.4 %
June 2024
Dell Inspiron 16 Plus 7640
Ultra 7 155H, NVIDIA GeForce RTX 4060 Laptop GPU
2.2 килог.19.9 мм16.00"2560x1600
87.1 %
September 2023
Dell Inspiron 16 Plus 7630
i7-13700H, NVIDIA GeForce RTX 4060 Laptop GPU
2.2 килог.19.95 мм16.00"2560x1600
87.4 %
September 2022
Dell Inspiron 16 Plus 7620
i7-12700H, GeForce RTX 3050 Ti Laptop GPU
2.1 килог.18.99 мм16.00"3072x1920
90.4 %
March 2024
Samsung Galaxy Book4 Ultra
Ultra 7 155H, NVIDIA GeForce RTX 4050 Laptop GPU
1.8 килог.17 мм16.00"2880x1800
89.1 %
February 2024
Lenovo Legion 5 16IRX G9
i7-14650HX, NVIDIA GeForce RTX 4060 Laptop GPU
2.4 килог.25.2 мм16.00"2560x1600
87.6 %
November 2023
Asus VivoBook Pro 16 K6602VU
i9-13900H, NVIDIA GeForce RTX 4050 Laptop GPU
1.9 килог.19 мм16.00"3200x2000

Дизайн и особенности - Больше вентиляционных решеток

Модель получила новую выделенную клавишу Co-Pilot, которая заменяет клавишу Ctrl на правой половине клавиатуры. Область подставки для ладоней стала более плоской, периметр основания - более круглым, а вентиляционные решетки сзади и по бокам были изменены и стали больше, чем раньше. Материалы корпуса и порты в остальном остались неизменными, что обеспечивает схожие первые впечатления и размеры.

Сравнение размеров

359.7 mm 262.3 mm 25.2 mm 2.4 kg356.78 mm 251.9 mm 19.95 mm 2.2 kg356.78 mm 250.6 mm 19.9 mm 2.2 kg356.78 mm 251.9 mm 18.99 mm 2.1 kg355.3 mm 252 mm 19 mm 1.9 kg355 mm 250 mm 17 mm 1.8 kg297 mm 210 mm 1 mm 5.7 g

Картридер

SD Card Reader
average JPG Copy Test (av. of 3 runs)
Asus VivoBook Pro 16 K6602VU
Intel Core i9-13900H (Angelbird AV Pro V60)
163.5 (157.23min - 168.58max) MB/s +636%
Samsung Galaxy Book4 Ultra
Intel Core Ultra 7 155H (Angelbird AV Pro V60)
78.8 MB/s +255%
Lenovo Legion 5 16IRX G9
Intel Core i7-14650HX
27.1 MB/s +22%
Dell Inspiron 16 Plus 7620
Intel Core i7-12700H (Toshiba Exceria Pro SDXC 64 GB UHS-II)
27.02 MB/s +22%
Dell Inspiron 16 Plus 7640
Intel Core Ultra 7 155H (Angelbird AV Pro V60)
22.2 MB/s
Dell Inspiron 16 Plus 7630
Intel Core i7-13700H (AV Pro SD microSD 128 GB V60)
19.3 MB/s -13%
maximum AS SSD Seq Read Test (1GB)
Asus VivoBook Pro 16 K6602VU
Intel Core i9-13900H (Angelbird AV Pro V60)
232.36 MB/s +710%
Samsung Galaxy Book4 Ultra
Intel Core Ultra 7 155H (Angelbird AV Pro V60)
87.2 MB/s +204%
Lenovo Legion 5 16IRX G9
Intel Core i7-14650HX
28.8 MB/s 0%
Dell Inspiron 16 Plus 7640
Intel Core Ultra 7 155H (Angelbird AV Pro V60)
28.7 MB/s
Dell Inspiron 16 Plus 7620
Intel Core i7-12700H (Toshiba Exceria Pro SDXC 64 GB UHS-II)
28.41 MB/s -1%
Dell Inspiron 16 Plus 7630
Intel Core i7-13700H (AV Pro SD microSD 128 GB V60)
28.3 MB/s -1%

Связь

Networking
iperf3 transmit AXE11000
Samsung Galaxy Book4 Ultra
Intel Wi-Fi 6E AX211
1625 (1476min, 1476.87P1 - 1697max) MBit/s +100%
Asus VivoBook Pro 16 K6602VU
Intel Wi-Fi 6E AX211
1606 (1503min - 1654max) MBit/s +98%
Lenovo Legion 5 16IRX G9
Intel Wi-Fi 6E AX211
1489 (1329min, 1338.28P1 - 1686max) MBit/s +84%
Dell Inspiron 16 Plus 7630
Intel Wi-Fi 6E AX211
1261 (1137min - 1385max) MBit/s +55%
Dell Inspiron 16 Plus 7640
Intel Wi-Fi 6E AX211
811 (428min - 1008max) MBit/s
iperf3 receive AXE11000
Samsung Galaxy Book4 Ultra
Intel Wi-Fi 6E AX211
1715 (1675min, 1683.7P1 - 1731max) MBit/s +72%
Asus VivoBook Pro 16 K6602VU
Intel Wi-Fi 6E AX211
1701 (1196min - 1751max) MBit/s +70%
Lenovo Legion 5 16IRX G9
Intel Wi-Fi 6E AX211
1398 (1327min, 1333.09P1 - 1464max) MBit/s +40%
Dell Inspiron 16 Plus 7630
Intel Wi-Fi 6E AX211
1184 (1047min - 1237max) MBit/s +18%
Dell Inspiron 16 Plus 7640
Intel Wi-Fi 6E AX211
1000 (899min - 1078max) MBit/s
iperf3 transmit AXE11000 6GHz
Dell Inspiron 16 Plus 7630
Intel Wi-Fi 6E AX211
1524 (1318min - 1580max) MBit/s +116%
Asus VivoBook Pro 16 K6602VU
Intel Wi-Fi 6E AX211
1381 (1289min - 1536max) MBit/s +96%
Dell Inspiron 16 Plus 7620
Intel Wi-Fi 6E AX211
944 (526min - 1098max) MBit/s +34%
Dell Inspiron 16 Plus 7640
Intel Wi-Fi 6E AX211
705 (634min - 769max) MBit/s
iperf3 receive AXE11000 6GHz
Asus VivoBook Pro 16 K6602VU
Intel Wi-Fi 6E AX211
1628 (1393min - 1717max) MBit/s +133%
Dell Inspiron 16 Plus 7630
Intel Wi-Fi 6E AX211
1229 (1099min - 1323max) MBit/s +76%
Dell Inspiron 16 Plus 7620
Intel Wi-Fi 6E AX211
1217 (1157min - 1297max) MBit/s +74%
Dell Inspiron 16 Plus 7640
Intel Wi-Fi 6E AX211
700 (607min - 805max) MBit/s
050100150200250300350400450500550600650700750800Tooltip
Dell Inspiron 16 Plus 7640; iperf3 transmit AXE11000 6GHz; iperf 3.1.3: Ø704 (634-769)
Dell Inspiron 16 Plus 7640; iperf3 receive AXE11000 6GHz; iperf 3.1.3: Ø700 (607-805)

Веб-камера

ColorChecker
6.9 ∆E
8.1 ∆E
11.1 ∆E
13 ∆E
13.4 ∆E
9.3 ∆E
13.2 ∆E
6 ∆E
11.2 ∆E
8.4 ∆E
6.1 ∆E
7.9 ∆E
4.8 ∆E
8.7 ∆E
15.4 ∆E
4.4 ∆E
11.3 ∆E
13.4 ∆E
6.7 ∆E
3.2 ∆E
6.8 ∆E
7.8 ∆E
7.4 ∆E
4 ∆E
ColorChecker Dell Inspiron 16 Plus 7640: 8.69 ∆E min: 3.19 - max: 15.36 ∆E

Обслуживание

Открыв систему, Вы увидите одно существенное отличие между ней и ее непосредственным предшественником: поддержку дополнительного твердотельного накопителя M.2 2230. В остальном, как видно из приведенных ниже изображений, Inspiron 16 Plus 7630 практически идентичен.

Inspiron 16 Plus 7640
Inspiron 16 Plus 7630 для сравнения

Дисплей - Варианты FHD+ и QHD+

Доступны две следующие опции отображения:

  • 1920 x 1200, 60 Гц, сенсорный экран, глянцевый
  • 2560 x 1600, 120 Гц, несенсорный экран, матовый

Наше устройство поставляется с панелью, выделенной жирным шрифтом выше. Обратите внимание, что на официальной странице продукта Dell неверно указано значение 60 Гц для панели 1600p; мы можем подтвердить, что эта панель поддерживает собственные частоты обновления 120 Гц и 48 Гц без поддержки G-Sync, как и в прошлогоднем Inspiron 16 Plus 7630.

Интересно, что для Inspiron 16 Plus 7640 этого года компания Dell поменяла поставщика панелей с LG Philips на AU Optronics. Новая панель обеспечивает более быстрое время отклика и минимизирует появление "призраков", предлагая при этом такие же цвета sRGB, уровни яркости и контрастности, как и раньше.

При близком рассмотрении тексты и изображения выглядят немного более зернистыми, чем в глянцевом варианте
Только очень незначительное неравномерное рассеивание подсветки
289.9
cd/m²
290.9
cd/m²
289.2
cd/m²
281.3
cd/m²
314.7
cd/m²
288.8
cd/m²
286.8
cd/m²
291.7
cd/m²
288.8
cd/m²
Равномерность подсветки экрана
AU Optronics B160QAN замерено через: X-Rite i1Pro 2
Максимум: 314.7 cd/m² (Nits) В среднем: 291.3 cd/m² Minimum: 17.1 cd/m²
Равномерность подсветки: 89 %
От батареи: 314.7 cd/m²
Контрастность: 1124:1 (Уровень чёрного: 0.28 cd/m²)
ΔE Color 1.62 | 0.5-29.43 Ø4.99, calibrated: 1.08
ΔE Greyscale 1.3 | 0.57-98 Ø5.2
76.7% AdobeRGB 1998 (Argyll 2.2.0 3D)
99.8% sRGB (Argyll 2.2.0 3D)
76% Display P3 (Argyll 2.2.0 3D)
Gamma: 2.26
Dell Inspiron 16 Plus 7640
AU Optronics B160QAN, IPS, 2560x1600, 16.00
Dell Inspiron 16 Plus 7630
LG Philips 160WQ2, IPS, 2560x1600, 16.00
Dell Inspiron 16 Plus 7620
BOE NE16N41, IPS, 3072x1920, 16.00
Samsung Galaxy Book4 Ultra
ATNA60CL07-0, OLED, 2880x1800, 16.00
Lenovo Legion 5 16IRX G9
NE160QDM-NZ3, IPS, 2560x1600, 16.00
Asus VivoBook Pro 16 K6602VU
Samsung ATNA60BX01-1, OLED, 3200x2000, 16.00
Display
-5%
-4%
15%
-3%
19%
Display P3 Coverage
76
70.1
-8%
70.8
-7%
98.6
30%
72.4
-5%
98.7
30%
sRGB Coverage
99.8
99.6
0%
99.5
0%
99.9
0%
100
0%
99.7
0%
AdobeRGB 1998 Coverage
76.7
72.3
-6%
73.2
-5%
88.5
15%
74.1
-3%
96.5
26%
Response Times
-38%
-54%
97%
51%
61%
Response Time Grey 50% / Grey 80% *
25.6 ?(12.3, 13.3)
35 ?(15.7, 19.3)
-37%
38 ?(21.2, 16.8)
-48%
0.54 ?(0.29, 0.25)
98%
12.5 ?(6.1, 6.4)
51%
0.68 ?(0.32, 0.36)
97%
Response Time Black / White *
17.6 ?(8.5, 9.1)
24.2 ?(10.8, 13.4)
-38%
28 ?(13.2, 14.8)
-59%
0.69 ?(0.39, 0.3)
96%
8.7 ?(4.6, 4.1)
51%
13.2 ?(10.8, 2.4)
25%
PWM Frequency
240 ?(100)
240 ?(100)
Параметры экрана
-57%
-2%
5%
25%
-68%
Яркость в центре
314.7
299.4
-5%
288.9
-8%
390
24%
526
67%
353
12%
Brightness
291
290
0%
276
-5%
393
35%
500
72%
354
22%
Brightness Distribution
89
92
3%
92
3%
98
10%
87
-2%
98
10%
Уровень чёрного *
0.28
0.21
25%
0.26
7%
0.33
-18%
Контрастность
1124
1426
27%
1111
-1%
1594
42%
Colorchecker Delta E *
1.62
4.25
-162%
1.88
-16%
1.4
14%
1.2
26%
4.23
-161%
Colorchecker dE 2000 max. *
2.94
6.71
-128%
4.37
-49%
2.7
8%
2.1
29%
7.13
-143%
Colorchecker dE 2000 calibrated *
1.08
0.52
52%
0.42
61%
1
7%
2.42
-124%
Delta E для серого *
1.3
5.5
-323%
1.4
-8%
2.1
-62%
1.3
-0%
2.5
-92%
Гамма
2.26 97%
2.35 94%
2.3 96%
2.27 97%
2.23 99%
2.4 92%
CCT
6385 102%
6368 102%
6634 98%
6431 101%
6391 102%
6642 98%
Среднее значение
-33% / -43%
-20% / -10%
39% / 24%
24% / 23%
4% / -25%

* ... меньше = лучше

Охват sRGB
Охват sRGB
Охват P3
Охват P3

Дисплей поставляется хорошо откалиброванным из коробки, что удивительно, учитывая, что серия Inspiron обычно является более бюджетной, и в ней меньше внимания уделяется точности цветопередачи, чем в более дорогой серии XPS. Попытка откалибровать панель самостоятельно приведет лишь к незначительному улучшению средних значений дельтаЕ, как показано на скриншотах ниже. Поэтому для большинства пользователей калибровка не является необходимой.

Градации серого до калибровки
Насыщенные звуковые сигналы перед калибровкой
ColorChecker перед калибровкой
Градации серого после калибровки
Насыщенные звуковые сигналы после калибровки
ColorChecker после калибровки

Дисплей: тест на время отклика

Время отклика показывает, как быстро дисплей устройства способен сменить цвет изображения с одного на другой. Недостаточно быстрый отклик может привести к деформации подвижных фрагментов изображения, появлении теней и размытости. Отсутствие таких проблем особенно важно для просмотра фильмов и для игр.
       Перемена цвета пикселей, чёрный - белый (1) и белый - чёрный (2)
17.6 ms ... стадия 1 ↗ и стадия 2 ↘ в сумме↗ 8.5 ms стадия 1
↘ 9.1 ms стадия 2
Это неплохое время отклика. Оно подходит для игр и подобных применений, хоть и не идеально.
Для сравнения, самый лучший результат среди всех известных нам устройств равен 0.1 миллисек., самый худший - 240 миллисек. » 34% экранов из нашей базы данных показали более хороший результат.
Таким образом, тестируемое устройство находится в верхней половине рейтинга (оно опережает средний результат, равный 21.3 миллисек.)
       Перемена цвета пикселей, серый 50% - серый 80% (1) и серый 80% - серый 50% (2)
25.6 ms ... стадия 1 ↗ и стадия 2 ↘ в сумме↗ 12.3 ms стадия 1
↘ 13.3 ms стадия 2
Это довольно большое время отклика. Экран явно не ориентирован на игры и подобные применения.
Для сравнения, самый лучший результат среди всех известных нам устройств равен 0.2 миллисек., самый худший - 636 миллисек. » 31% экранов из нашей базы данных показали более хороший результат.
Таким образом, тестируемое устройство находится в верхней половине рейтинга (оно опережает средний результат, равный 33.5 миллисек.)

Тест на мерцание

Некоторые устройства устанавливают яркость экрана при помощи быстрого включения-выключения светодиодов вместо простого понижения напряжения их питания. Такой метод обозначается аббревиатурой ШИМ (или PWM). Он часто приводит к полоскам или ряби на изображении, а также к быстрой усталости глаз и головной боли. Мы проверяем, используется ли PWM в тестируемом устройстве, и если да, то при каких условиях.
Ура! ШИМ не обнаружено

Для сравнения, 53 % известных нам устройств не применяют PWM для изменения яркости, а среди тех, где PWM используется, типичная частота модуляции составляет 17655 Гц (мин. 5 Гц, макс. 3846000 Гц).

На открытом воздухе при яркой пасмурной погоде
На открытом воздухе в тени
На открытом воздухе при яркой пасмурной погоде
Широкие углы обзора IPS

Производительность - Поддержка ИИ на месте


Параметры тестирования

Мы перевели Windows в режим "Производительность" перед тем, как запустить приведенные ниже бенчмарки.

Процессор

Наш Core Ultra 7 155H производительность превосходна: результаты многопоточной работы на 15-20% быстрее, чем у других ноутбуков с таким же процессором. Если сравнивать с Core i7-13700H в прошлогоднем Inspiron 16 Plus 7630, однако, более новый процессор быстрее всего на 10%, что практически незаметно при выполнении подавляющего большинства задач. На самом деле, более старый процессор имеет небольшое преимущество, когда речь идет об однопоточных рабочих нагрузках.

Конечно, "дикой картой" Core Ultra 7 155H является его встроенный NPU, который должен пригодиться для задач с ускорением искусственного интеллекта, когда они станут более доступными. В остальном его возможности крайне ограничены на момент написания статьи.

Многопоточный тест CB15

019038057076095011401330152017101900209022802470266028503040323034203610Tooltip
Dell Inspiron 16 Plus 7640 Intel Core Ultra 7 155H: Ø2341 (1793.16-2787.26)
Dell Inspiron 16 Plus 7630 Intel Core i7-13700H: Ø2049 (1806.77-2421.45)
Dell Inspiron 16 Plus 7620 Intel Core i7-12700H: Ø1998 (1901.59-2430.28)
Samsung Galaxy Book4 Ultra Intel Core Ultra 7 155H: Ø2195 (2134.59-2575.83)
Lenovo Legion 5 16IRX G9 Intel Core i7-14650HX: Ø3471 (3409.19-3799.39)
Asus VivoBook Pro 16 K6602VU Intel Core i9-13900H: Ø2244 (2186.27-2513.98)
CPU Performance Rating: Percent
Cinebench R23: Multi Core | Single Core
Cinebench R20: CPU (Multi Core) | CPU (Single Core)
Cinebench R15: CPU Multi 64Bit | CPU Single 64Bit
Blender: v2.79 BMW27 CPU
7-Zip 18.03: 7z b 4 | 7z b 4 -mmt1
Geekbench 6.2: Multi-Core | Single-Core
Geekbench 5.5: Multi-Core | Single-Core
HWBOT x265 Benchmark v2.2: 4k Preset
LibreOffice : 20 Documents To PDF
R Benchmark 2.5: Overall mean
CPU Performance Rating
Lenovo Legion 5 16IRX G9
Intel Core i7-14650HX
87.7 pt
Lenovo Yoga Pro 9 16IMH9
Intel Core Ultra 9 185H
78.2 pt
Framework Laptop 16
AMD Ryzen 9 7940HS
73.3 pt
Dell Inspiron 16 Plus 7640
Intel Core Ultra 7 155H
70.2 pt
Dell Inspiron 16 Plus 7630
Intel Core i7-13700H
69.9 pt
Усредн. модель с Intel Core Ultra 7 155H
 
65 pt
Asus VivoBook Pro 16 K6602VU
Intel Core i9-13900H
64.4 pt
Dell Inspiron 16 Plus 7620 -2!
Intel Core i7-12700H
63.3 pt
Minisforum V3
AMD Ryzen 7 8840U
63.1 pt
Lenovo Legion S7 16ARHA7 -2!
AMD Ryzen 9 6900HX
62.6 pt
Acer Nitro 16 AN16-41 -2!
AMD Ryzen 7 7735HS
59.1 pt
Acer Nitro 16 AN16-41-R7YE
AMD Ryzen 5 7535HS
53.9 pt
Lenovo ThinkPad E16 G1-21JUS08X00
AMD Ryzen 7 7730U
50.2 pt
Lenovo Yoga 7 2-in-1 16IML9
Intel Core Ultra 5 125U
49.7 pt
Lenovo ThinkBook 16 G6 ABP
AMD Ryzen 5 7530U
47.7 pt
Cinebench R23 / Multi Core
Lenovo Legion 5 16IRX G9
Intel Core i7-14650HX
24455 Points +38%
Lenovo Yoga Pro 9 16IMH9
Intel Core Ultra 9 185H
19851 Points +12%
Dell Inspiron 16 Plus 7640
Intel Core Ultra 7 155H
17675 (14726min - 17675max) Points
Framework Laptop 16
AMD Ryzen 9 7940HS
16519 (16352.4min - 16518.9max) Points -7%
Dell Inspiron 16 Plus 7630
Intel Core i7-13700H
15922 (13533.8min - 15922.1max) Points -10%
Asus VivoBook Pro 16 K6602VU
Intel Core i9-13900H
14958 Points -15%
Усредн. модель с Intel Core Ultra 7 155H
  (9769 - 19007, n=34)
14809 Points -16%
Dell Inspiron 16 Plus 7620
Intel Core i7-12700H
14704 (12621.1min - 14704.4max) Points -17%
Lenovo Legion S7 16ARHA7
AMD Ryzen 9 6900HX
14584 (14179.8min - 14584.2max) Points -17%
Acer Nitro 16 AN16-41
AMD Ryzen 7 7735HS
14131 Points -20%
Minisforum V3
AMD Ryzen 7 8840U
12972 Points -27%
Acer Nitro 16 AN16-41-R7YE
AMD Ryzen 5 7535HS
10900 Points -38%
Lenovo ThinkPad E16 G1-21JUS08X00
AMD Ryzen 7 7730U
10325 Points -42%
Lenovo Yoga 7 2-in-1 16IML9
Intel Core Ultra 5 125U
9533 (8675.99min - 9532.96max) Points -46%
Lenovo ThinkBook 16 G6 ABP
AMD Ryzen 5 7530U
9347 Points -47%
Cinebench R23 / Single Core
Lenovo Legion 5 16IRX G9
Intel Core i7-14650HX
1963 Points +13%
Lenovo Yoga Pro 9 16IMH9
Intel Core Ultra 9 185H
1906 Points +10%
Dell Inspiron 16 Plus 7630
Intel Core i7-13700H
1874 Points +8%
Dell Inspiron 16 Plus 7620
Intel Core i7-12700H
1766 Points +2%
Asus VivoBook Pro 16 K6602VU
Intel Core i9-13900H
1740 Points 0%
Framework Laptop 16
AMD Ryzen 9 7940HS
1733 Points 0%
Dell Inspiron 16 Plus 7640
Intel Core Ultra 7 155H
1733 Points
Усредн. модель с Intel Core Ultra 7 155H
  (1496 - 1801, n=34)
1722 Points -1%
Minisforum V3
AMD Ryzen 7 8840U
1701 Points -2%
Lenovo Legion S7 16ARHA7
AMD Ryzen 9 6900HX
1614 Points -7%
Lenovo Yoga 7 2-in-1 16IML9
Intel Core Ultra 5 125U
1548 Points -11%
Acer Nitro 16 AN16-41
AMD Ryzen 7 7735HS
1546 Points -11%
Acer Nitro 16 AN16-41-R7YE
AMD Ryzen 5 7535HS
1488 Points -14%
Lenovo ThinkPad E16 G1-21JUS08X00
AMD Ryzen 7 7730U
1466 Points -15%
Lenovo ThinkBook 16 G6 ABP
AMD Ryzen 5 7530U
1463 Points -16%
Cinebench R20 / CPU (Multi Core)
Lenovo Legion 5 16IRX G9
Intel Core i7-14650HX
9349 Points +37%
Lenovo Yoga Pro 9 16IMH9
Intel Core Ultra 9 185H
7651 Points +12%
Dell Inspiron 16 Plus 7640
Intel Core Ultra 7 155H
6807 Points
Framework Laptop 16
AMD Ryzen 9 7940HS
6402 Points -6%
Dell Inspiron 16 Plus 7630
Intel Core i7-13700H
6162 Points -9%
Asus VivoBook Pro 16 K6602VU
Intel Core i9-13900H
5774 Points -15%
Усредн. модель с Intel Core Ultra 7 155H
  (3798 - 7409, n=32)
5736 Points -16%
Dell Inspiron 16 Plus 7620
Intel Core i7-12700H
5648 Points -17%
Lenovo Legion S7 16ARHA7
AMD Ryzen 9 6900HX
5596 Points -18%
Acer Nitro 16 AN16-41
AMD Ryzen 7 7735HS
5502 Points -19%
Minisforum V3
AMD Ryzen 7 8840U
5067 Points -26%
Acer Nitro 16 AN16-41-R7YE
AMD Ryzen 5 7535HS
4224 Points -38%
Lenovo ThinkPad E16 G1-21JUS08X00
AMD Ryzen 7 7730U
3985 Points -41%
Lenovo Yoga 7 2-in-1 16IML9
Intel Core Ultra 5 125U
3720 Points -45%
Lenovo ThinkBook 16 G6 ABP
AMD Ryzen 5 7530U
3655 Points -46%
Cinebench R20 / CPU (Single Core)
Lenovo Legion 5 16IRX G9
Intel Core i7-14650HX
754 Points +13%
Lenovo Yoga Pro 9 16IMH9
Intel Core Ultra 9 185H
735 Points +10%
Dell Inspiron 16 Plus 7630
Intel Core i7-13700H
725 Points +9%
Dell Inspiron 16 Plus 7620
Intel Core i7-12700H
680 Points +2%
Framework Laptop 16
AMD Ryzen 9 7940HS
680 Points +2%
Asus VivoBook Pro 16 K6602VU
Intel Core i9-13900H
673 Points +1%
Dell Inspiron 16 Plus 7640
Intel Core Ultra 7 155H
666 Points
Усредн. модель с Intel Core Ultra 7 155H
  (611 - 693, n=32)
666 Points 0%
Minisforum V3
AMD Ryzen 7 8840U
665 Points 0%
Lenovo Legion S7 16ARHA7
AMD Ryzen 9 6900HX
630 Points -5%
Lenovo Yoga 7 2-in-1 16IML9
Intel Core Ultra 5 125U
605 Points -9%
Acer Nitro 16 AN16-41
AMD Ryzen 7 7735HS
601 Points -10%
Acer Nitro 16 AN16-41-R7YE
AMD Ryzen 5 7535HS
581 Points -13%
Lenovo ThinkPad E16 G1-21JUS08X00
AMD Ryzen 7 7730U
573 Points -14%
Lenovo ThinkBook 16 G6 ABP
AMD Ryzen 5 7530U
570 Points -14%
Cinebench R15 / CPU Multi 64Bit
Lenovo Legion 5 16IRX G9
Intel Core i7-14650HX
3799 (3409.19min - 3799.39max) Points +36%
Lenovo Yoga Pro 9 16IMH9
Intel Core Ultra 9 185H
3005 (2869.44min - 3004.58max) Points +8%
Dell Inspiron 16 Plus 7640
Intel Core Ultra 7 155H
2787 (1793.16min - 2787.26max) Points
Framework Laptop 16
AMD Ryzen 9 7940HS
2653 (2587.82min - 2652.52max) Points -5%
Asus VivoBook Pro 16 K6602VU
Intel Core i9-13900H
2514 (2186.27min - 2513.98max) Points -10%
Усредн. модель с Intel Core Ultra 7 155H
  (1932 - 2858, n=37)
2431 Points -13%
Dell Inspiron 16 Plus 7620
Intel Core i7-12700H
2430 (1901.59min - 2430.28max) Points -13%
Dell Inspiron 16 Plus 7630
Intel Core i7-13700H
2421 (1806.77min - 2421.45max) Points -13%
Lenovo Legion S7 16ARHA7
AMD Ryzen 9 6900HX
2359 (2277.39min - 2359.33max) Points -15%
Acer Nitro 16 AN16-41
AMD Ryzen 7 7735HS
2328 Points -16%
Minisforum V3
AMD Ryzen 7 8840U
2024 Points -27%
Acer Nitro 16 AN16-41-R7YE
AMD Ryzen 5 7535HS
1757 Points -37%
Lenovo ThinkPad E16 G1-21JUS08X00
AMD Ryzen 7 7730U
1718.58 (1668.54min - 1718.58max) Points -38%
Lenovo Yoga 7 2-in-1 16IML9
Intel Core Ultra 5 125U
1657 (1250.47min - 1657.34max) Points -41%
Lenovo ThinkBook 16 G6 ABP
AMD Ryzen 5 7530U
1599 (1483.51min - 1598.53max) Points -43%
Cinebench R15 / CPU Single 64Bit
Lenovo Legion 5 16IRX G9
Intel Core i7-14650HX
287 Points +13%
Lenovo Yoga Pro 9 16IMH9
Intel Core Ultra 9 185H
280 Points +10%
Framework Laptop 16
AMD Ryzen 9 7940HS
277 Points +9%
Dell Inspiron 16 Plus 7630
Intel Core i7-13700H
265 Points +4%
Minisforum V3
AMD Ryzen 7 8840U
263 Points +3%
Lenovo Legion S7 16ARHA7
AMD Ryzen 9 6900HX
257 Points +1%
Dell Inspiron 16 Plus 7640
Intel Core Ultra 7 155H
255 Points
Dell Inspiron 16 Plus 7620
Intel Core i7-12700H
254 Points 0%
Усредн. модель с Intel Core Ultra 7 155H
  (210 - 268, n=33)
253 Points -1%
Asus VivoBook Pro 16 K6602VU
Intel Core i9-13900H
252 Points -1%
Acer Nitro 16 AN16-41
AMD Ryzen 7 7735HS
247 Points -3%
Acer Nitro 16 AN16-41-R7YE
AMD Ryzen 5 7535HS
241 Points -5%
Lenovo ThinkBook 16 G6 ABP
AMD Ryzen 5 7530U
234 Points -8%
Lenovo ThinkPad E16 G1-21JUS08X00
AMD Ryzen 7 7730U
233 Points -9%
Lenovo Yoga 7 2-in-1 16IML9
Intel Core Ultra 5 125U
226 Points -11%
Blender / v2.79 BMW27 CPU
Lenovo Yoga 7 2-in-1 16IML9
Intel Core Ultra 5 125U
358 Seconds * -87%
Lenovo ThinkBook 16 G6 ABP
AMD Ryzen 5 7530U
330 Seconds * -73%
Lenovo ThinkPad E16 G1-21JUS08X00
AMD Ryzen 7 7730U
296 Seconds * -55%
Acer Nitro 16 AN16-41-R7YE
AMD Ryzen 5 7535HS
286 Seconds * -50%
Minisforum V3
AMD Ryzen 7 8840U
239 Seconds * -25%
Усредн. модель с Intel Core Ultra 7 155H
  (178 - 349, n=30)
236 Seconds * -24%
Dell Inspiron 16 Plus 7620
Intel Core i7-12700H
235 Seconds * -23%
Dell Inspiron 16 Plus 7630
Intel Core i7-13700H
221 Seconds * -16%
Acer Nitro 16 AN16-41
AMD Ryzen 7 7735HS
219 Seconds * -15%
Lenovo Legion S7 16ARHA7
AMD Ryzen 9 6900HX
214 Seconds * -12%
Asus VivoBook Pro 16 K6602VU
Intel Core i9-13900H
213 Seconds * -12%
Framework Laptop 16
AMD Ryzen 9 7940HS
195 Seconds * -2%
Dell Inspiron 16 Plus 7640
Intel Core Ultra 7 155H
191 Seconds *
Lenovo Yoga Pro 9 16IMH9
Intel Core Ultra 9 185H
163 Seconds * +15%
Lenovo Legion 5 16IRX G9
Intel Core i7-14650HX
141 Seconds * +26%
7-Zip 18.03 / 7z b 4
Lenovo Legion 5 16IRX G9
Intel Core i7-14650HX
93686 MIPS +52%
Lenovo Yoga Pro 9 16IMH9
Intel Core Ultra 9 185H
76331 MIPS +24%
Framework Laptop 16
AMD Ryzen 9 7940HS
71464 MIPS +16%
Asus VivoBook Pro 16 K6602VU
Intel Core i9-13900H
64431 MIPS +4%
Lenovo Legion S7 16ARHA7
AMD Ryzen 9 6900HX
63347 MIPS +3%
Dell Inspiron 16 Plus 7640
Intel Core Ultra 7 155H
61730 MIPS
Acer Nitro 16 AN16-41
AMD Ryzen 7 7735HS
61191 MIPS -1%
Dell Inspiron 16 Plus 7620
Intel Core i7-12700H
59929 MIPS -3%
Dell Inspiron 16 Plus 7630
Intel Core i7-13700H
59433 MIPS -4%
Усредн. модель с Intel Core Ultra 7 155H
  (42601 - 70074, n=32)
58514 MIPS -5%
Minisforum V3
AMD Ryzen 7 8840U
57795 MIPS -6%
Acer Nitro 16 AN16-41-R7YE
AMD Ryzen 5 7535HS
48646 MIPS -21%
Lenovo ThinkPad E16 G1-21JUS08X00
AMD Ryzen 7 7730U
47733 MIPS -23%
Lenovo ThinkBook 16 G6 ABP
AMD Ryzen 5 7530U
42364 MIPS -31%
Lenovo Yoga 7 2-in-1 16IML9
Intel Core Ultra 5 125U
39065 MIPS -37%
7-Zip 18.03 / 7z b 4 -mmt1
Lenovo Legion 5 16IRX G9
Intel Core i7-14650HX
6695 MIPS +23%
Framework Laptop 16
AMD Ryzen 9 7940HS
6599 MIPS +21%
Lenovo Legion S7 16ARHA7
AMD Ryzen 9 6900HX
6070 MIPS +11%
Minisforum V3
AMD Ryzen 7 8840U
5921 MIPS +8%
Lenovo Yoga Pro 9 16IMH9
Intel Core Ultra 9 185H
5781 MIPS +6%
Asus VivoBook Pro 16 K6602VU
Intel Core i9-13900H
5721 MIPS +5%
Dell Inspiron 16 Plus 7630
Intel Core i7-13700H
5703 MIPS +4%
Acer Nitro 16 AN16-41-R7YE
AMD Ryzen 5 7535HS
5670 MIPS +4%
Acer Nitro 16 AN16-41
AMD Ryzen 7 7735HS
5584 MIPS +2%
Dell Inspiron 16 Plus 7620
Intel Core i7-12700H
5570 MIPS +2%
Dell Inspiron 16 Plus 7640
Intel Core Ultra 7 155H
5461 MIPS
Lenovo ThinkPad E16 G1-21JUS08X00
AMD Ryzen 7 7730U
5426 MIPS -1%
Lenovo ThinkBook 16 G6 ABP
AMD Ryzen 5 7530U
5352 MIPS -2%
Усредн. модель с Intel Core Ultra 7 155H
  (5037 - 5540, n=32)
5343 MIPS -2%
Lenovo Yoga 7 2-in-1 16IML9
Intel Core Ultra 5 125U
4492 MIPS -18%
Geekbench 6.2 / Multi-Core
Lenovo Legion 5 16IRX G9
Intel Core i7-14650HX
16010 Points +23%
Lenovo Yoga Pro 9 16IMH9
Intel Core Ultra 9 185H
14031 Points +8%
Dell Inspiron 16 Plus 7630
Intel Core i7-13700H
13406 Points +3%
Framework Laptop 16
AMD Ryzen 9 7940HS
13217 Points +2%
Dell Inspiron 16 Plus 7640
Intel Core Ultra 7 155H
13018 Points
Усредн. модель с Intel Core Ultra 7 155H
  (7732 - 13656, n=38)
12305 Points -5%
Minisforum V3
AMD Ryzen 7 8840U
11144 Points -14%
Asus VivoBook Pro 16 K6602VU
Intel Core i9-13900H
11118 Points -15%
Lenovo Yoga 7 2-in-1 16IML9
Intel Core Ultra 5 125U
9601 Points -26%
Acer Nitro 16 AN16-41-R7YE
AMD Ryzen 5 7535HS
8960 Points -31%
Lenovo ThinkPad E16 G1-21JUS08X00
AMD Ryzen 7 7730U
6918 Points -47%
Lenovo ThinkBook 16 G6 ABP
AMD Ryzen 5 7530U
6901 Points -47%
Geekbench 6.2 / Single-Core
Lenovo Legion 5 16IRX G9
Intel Core i7-14650HX
2761 Points +15%
Dell Inspiron 16 Plus 7630
Intel Core i7-13700H
2638 Points +10%
Framework Laptop 16
AMD Ryzen 9 7940HS
2630 Points +10%
Lenovo Yoga Pro 9 16IMH9
Intel Core Ultra 9 185H
2570 Points +7%
Minisforum V3
AMD Ryzen 7 8840U
2537 Points +6%
Asus VivoBook Pro 16 K6602VU
Intel Core i9-13900H
2437 Points +1%
Dell Inspiron 16 Plus 7640
Intel Core Ultra 7 155H
2401 Points
Усредн. модель с Intel Core Ultra 7 155H
  (1901 - 2459, n=35)
2381 Points -1%
Lenovo Yoga 7 2-in-1 16IML9
Intel Core Ultra 5 125U
2148 Points -11%
Acer Nitro 16 AN16-41-R7YE
AMD Ryzen 5 7535HS
2056 Points -14%
Lenovo ThinkBook 16 G6 ABP
AMD Ryzen 5 7530U
1969 Points -18%
Lenovo ThinkPad E16 G1-21JUS08X00
AMD Ryzen 7 7730U
1960 Points -18%
Geekbench 5.5 / Multi-Core
Lenovo Legion 5 16IRX G9
Intel Core i7-14650HX
16810 Points +33%
Lenovo Yoga Pro 9 16IMH9
Intel Core Ultra 9 185H
13936 Points +11%
Dell Inspiron 16 Plus 7630
Intel Core i7-13700H
12805 Points +2%
Dell Inspiron 16 Plus 7640
Intel Core Ultra 7 155H
12600 Points
Framework Laptop 16
AMD Ryzen 9 7940HS
12379 Points -2%
Усредн. модель с Intel Core Ultra 7 155H
  (10017 - 13556, n=34)
12023 Points -5%
Dell Inspiron 16 Plus 7620
Intel Core i7-12700H
11887 Points -6%
Asus VivoBook Pro 16 K6602VU
Intel Core i9-13900H
10214 Points -19%
Minisforum V3
AMD Ryzen 7 8840U
10014 Points -21%
Lenovo Legion S7 16ARHA7
AMD Ryzen 9 6900HX
10007 Points -21%
Acer Nitro 16 AN16-41
AMD Ryzen 7 7735HS
9683 Points -23%
Lenovo Yoga 7 2-in-1 16IML9
Intel Core Ultra 5 125U
8355 Points -34%
Acer Nitro 16 AN16-41-R7YE
AMD Ryzen 5 7535HS
7852 Points -38%
Lenovo ThinkPad E16 G1-21JUS08X00
AMD Ryzen 7 7730U
6747 Points -46%
Lenovo ThinkBook 16 G6 ABP
AMD Ryzen 5 7530U
6517 Points -48%
Geekbench 5.5 / Single-Core
Framework Laptop 16
AMD Ryzen 9 7940HS
1963 Points +9%
Lenovo Legion 5 16IRX G9
Intel Core i7-14650HX
1933 Points +8%
Dell Inspiron 16 Plus 7630
Intel Core i7-13700H
1906 Points +6%
Lenovo Yoga Pro 9 16IMH9
Intel Core Ultra 9 185H
1902 Points +6%
Minisforum V3
AMD Ryzen 7 8840U
1894 Points +6%
Dell Inspiron 16 Plus 7640
Intel Core Ultra 7 155H
1793 Points
Усредн. модель с Intel Core Ultra 7 155H
  (1462 - 1824, n=34)
1756 Points -2%
Asus VivoBook Pro 16 K6602VU
Intel Core i9-13900H
1735 Points -3%
Dell Inspiron 16 Plus 7620
Intel Core i7-12700H
1733 Points -3%
Lenovo Legion S7 16ARHA7
AMD Ryzen 9 6900HX
1642 Points -8%
Lenovo Yoga 7 2-in-1 16IML9
Intel Core Ultra 5 125U
1560 Points -13%
Acer Nitro 16 AN16-41
AMD Ryzen 7 7735HS
1555 Points -13%
Acer Nitro 16 AN16-41-R7YE
AMD Ryzen 5 7535HS
1502 Points -16%
Lenovo ThinkBook 16 G6 ABP
AMD Ryzen 5 7530U
1498 Points -16%
Lenovo ThinkPad E16 G1-21JUS08X00
AMD Ryzen 7 7730U
1490 Points -17%
HWBOT x265 Benchmark v2.2 / 4k Preset
Lenovo Legion 5 16IRX G9
Intel Core i7-14650HX
25.6 fps +31%
Lenovo Yoga Pro 9 16IMH9
Intel Core Ultra 9 185H
22.7 fps +16%
Framework Laptop 16
AMD Ryzen 9 7940HS
21 fps +8%
Dell Inspiron 16 Plus 7640
Intel Core Ultra 7 155H
19.5 fps
Lenovo Legion S7 16ARHA7
AMD Ryzen 9 6900HX
18.3 fps -6%
Acer Nitro 16 AN16-41
AMD Ryzen 7 7735HS
17.5 fps -10%
Asus VivoBook Pro 16 K6602VU
Intel Core i9-13900H
16.7 fps -14%
Minisforum V3
AMD Ryzen 7 8840U
16.5 fps -15%
Dell Inspiron 16 Plus 7620
Intel Core i7-12700H
16.3 fps -16%
Усредн. модель с Intel Core Ultra 7 155H
  (9.93 - 21.2, n=32)
16.3 fps -16%
Dell Inspiron 16 Plus 7630
Intel Core i7-13700H
15.9 fps -18%
Acer Nitro 16 AN16-41-R7YE
AMD Ryzen 5 7535HS
14.2 fps -27%
Lenovo ThinkPad E16 G1-21JUS08X00
AMD Ryzen 7 7730U
11.8 fps -39%
Lenovo ThinkBook 16 G6 ABP
AMD Ryzen 5 7530U
11.6 fps -41%
Lenovo Yoga 7 2-in-1 16IML9
Intel Core Ultra 5 125U
11.1 fps -43%
LibreOffice / 20 Documents To PDF
Asus VivoBook Pro 16 K6602VU
Intel Core i9-13900H
56.3 s * -29%
Lenovo ThinkBook 16 G6 ABP
AMD Ryzen 5 7530U
54.5 s * -25%
Acer Nitro 16 AN16-41
AMD Ryzen 7 7735HS
53.4 s * -23%
Minisforum V3
AMD Ryzen 7 8840U
52.5 s * -21%
Lenovo ThinkPad E16 G1-21JUS08X00
AMD Ryzen 7 7730U
49.6 s * -14%
Lenovo Legion S7 16ARHA7
AMD Ryzen 9 6900HX
48.9 s * -12%
Усредн. модель с Intel Core Ultra 7 155H
  (40.9 - 66.4, n=31)
47.8 s * -10%
Lenovo Yoga 7 2-in-1 16IML9
Intel Core Ultra 5 125U
47 s * -8%
Acer Nitro 16 AN16-41-R7YE
AMD Ryzen 5 7535HS
46.2 s * -6%
Dell Inspiron 16 Plus 7620
Intel Core i7-12700H
46.1 s * -6%
Dell Inspiron 16 Plus 7630
Intel Core i7-13700H
45.1 s * -4%
Lenovo Legion 5 16IRX G9
Intel Core i7-14650HX
43.8 s * -1%
Framework Laptop 16
AMD Ryzen 9 7940HS
43.6 s * -0%
Dell Inspiron 16 Plus 7640
Intel Core Ultra 7 155H
43.5 s *
Lenovo Yoga Pro 9 16IMH9
Intel Core Ultra 9 185H
39.7 s * +9%
R Benchmark 2.5 / Overall mean
Lenovo Yoga 7 2-in-1 16IML9
Intel Core Ultra 5 125U
0.533 sec * -13%
Lenovo ThinkBook 16 G6 ABP
AMD Ryzen 5 7530U
0.531 sec * -13%
Lenovo ThinkPad E16 G1-21JUS08X00
AMD Ryzen 7 7730U
0.515 sec * -9%
Acer Nitro 16 AN16-41-R7YE
AMD Ryzen 5 7535HS
0.503 sec * -7%
Acer Nitro 16 AN16-41
AMD Ryzen 7 7735HS
0.4958 sec * -5%
Asus VivoBook Pro 16 K6602VU
Intel Core i9-13900H
0.4834 sec * -3%
Усредн. модель с Intel Core Ultra 7 155H
  (0.4609 - 0.526, n=31)
0.4801 sec * -2%
Minisforum V3
AMD Ryzen 7 8840U
0.479 sec * -2%
Dell Inspiron 16 Plus 7620
Intel Core i7-12700H
0.473 sec * -0%
Dell Inspiron 16 Plus 7640
Intel Core Ultra 7 155H
0.4709 sec *
Lenovo Legion S7 16ARHA7
AMD Ryzen 9 6900HX
0.4636 sec * +2%
Framework Laptop 16
AMD Ryzen 9 7940HS
0.4467 sec * +5%
Lenovo Yoga Pro 9 16IMH9
Intel Core Ultra 9 185H
0.4457 sec * +5%
Dell Inspiron 16 Plus 7630
Intel Core i7-13700H
0.4338 sec * +8%
Lenovo Legion 5 16IRX G9
Intel Core i7-14650HX
0.4195 sec * +11%
CPU Performance Rating: Percent
Cinebench R23: Multi Core | Single Core
Cinebench R20: CPU (Multi Core) | CPU (Single Core)
Cinebench R15: CPU Multi 64Bit | CPU Single 64Bit
Blender: v2.79 BMW27 CPU
7-Zip 18.03: 7z b 4 | 7z b 4 -mmt1
Geekbench 6.2: Multi-Core | Single-Core
Geekbench 5.5: Multi-Core | Single-Core
HWBOT x265 Benchmark v2.2: 4k Preset
LibreOffice : 20 Documents To PDF
R Benchmark 2.5: Overall mean

* ... меньше = лучше

Cinebench R15 CPU Multi 64Bit
2787 Points
Cinebench R15 OpenGL 64Bit
196.6 fps
Cinebench R15 Ref. Match 64Bit
99.6 %
Cinebench R15 CPU Single 64Bit
255 Points
?
Performance Rating
Lenovo Legion 5 16IRX G9
Intel Core i7-14650HX, NVIDIA GeForce RTX 4060 Laptop GPU
93.4 pt
Asus VivoBook Pro 16 K6602VU
Intel Core i9-13900H, NVIDIA GeForce RTX 4050 Laptop GPU
78.4 pt
Samsung Galaxy Book4 Ultra
Intel Core Ultra 7 155H, NVIDIA GeForce RTX 4050 Laptop GPU
75.9 pt
Dell Inspiron 16 Plus 7640
Intel Core Ultra 7 155H, NVIDIA GeForce RTX 4060 Laptop GPU
75.3 pt
Усредн. модель с Intel Core Ultra 7 155H
 
73.5 pt
Dell Inspiron 16 Plus 7630
Intel Core i7-13700H, NVIDIA GeForce RTX 4060 Laptop GPU
72.3 pt
Dell Inspiron 16 Plus 7620
Intel Core i7-12700H, GeForce RTX 3050 Ti Laptop GPU
69.2 pt
AIDA64 / FP32 Ray-Trace
Lenovo Legion 5 16IRX G9
Intel Core i7-14650HX, NVIDIA GeForce RTX 4060 Laptop GPU
19044 KRay/s +36%
Dell Inspiron 16 Plus 7640
Intel Core Ultra 7 155H, NVIDIA GeForce RTX 4060 Laptop GPU
14038 KRay/s
Dell Inspiron 16 Plus 7630
Intel Core i7-13700H, NVIDIA GeForce RTX 4060 Laptop GPU
13648 KRay/s -3%
Asus VivoBook Pro 16 K6602VU
Intel Core i9-13900H, NVIDIA GeForce RTX 4050 Laptop GPU
13642 KRay/s -3%
Samsung Galaxy Book4 Ultra
Intel Core Ultra 7 155H, NVIDIA GeForce RTX 4050 Laptop GPU
13541 KRay/s -4%
Усредн. модель с Intel Core Ultra 7 155H
  (6670 - 18470, n=32)
12919 KRay/s -8%
Dell Inspiron 16 Plus 7620
Intel Core i7-12700H, GeForce RTX 3050 Ti Laptop GPU
12734 KRay/s -9%
AIDA64 / FPU Julia
Lenovo Legion 5 16IRX G9
Intel Core i7-14650HX, NVIDIA GeForce RTX 4060 Laptop GPU
95271 Points +34%
Asus VivoBook Pro 16 K6602VU
Intel Core i9-13900H, NVIDIA GeForce RTX 4050 Laptop GPU
71957 Points +2%
Samsung Galaxy Book4 Ultra
Intel Core Ultra 7 155H, NVIDIA GeForce RTX 4050 Laptop GPU
71791 Points +1%
Dell Inspiron 16 Plus 7640
Intel Core Ultra 7 155H, NVIDIA GeForce RTX 4060 Laptop GPU
70839 Points
Усредн. модель с Intel Core Ultra 7 155H
  (43630 - 93181, n=32)
68731 Points -3%
Dell Inspiron 16 Plus 7630
Intel Core i7-13700H, NVIDIA GeForce RTX 4060 Laptop GPU
68323 Points -4%
Dell Inspiron 16 Plus 7620
Intel Core i7-12700H, GeForce RTX 3050 Ti Laptop GPU
63563 Points -10%
AIDA64 / CPU SHA3
Lenovo Legion 5 16IRX G9
Intel Core i7-14650HX, NVIDIA GeForce RTX 4060 Laptop GPU
4214 MB/s +29%
Dell Inspiron 16 Plus 7640
Intel Core Ultra 7 155H, NVIDIA GeForce RTX 4060 Laptop GPU
3277 MB/s
Asus VivoBook Pro 16 K6602VU
Intel Core i9-13900H, NVIDIA GeForce RTX 4050 Laptop GPU
3269 MB/s 0%
Samsung Galaxy Book4 Ultra
Intel Core Ultra 7 155H, NVIDIA GeForce RTX 4050 Laptop GPU
3251 MB/s -1%
Усредн. модель с Intel Core Ultra 7 155H
  (1940 - 4436, n=32)
3199 MB/s -2%
Dell Inspiron 16 Plus 7630
Intel Core i7-13700H, NVIDIA GeForce RTX 4060 Laptop GPU
3029 MB/s -8%
Dell Inspiron 16 Plus 7620
Intel Core i7-12700H, GeForce RTX 3050 Ti Laptop GPU
2892 MB/s -12%
AIDA64 / CPU Queen
Dell Inspiron 16 Plus 7630
Intel Core i7-13700H, NVIDIA GeForce RTX 4060 Laptop GPU
105205 Points +20%
Lenovo Legion 5 16IRX G9
Intel Core i7-14650HX, NVIDIA GeForce RTX 4060 Laptop GPU
101500 Points +16%
Asus VivoBook Pro 16 K6602VU
Intel Core i9-13900H, NVIDIA GeForce RTX 4050 Laptop GPU
94687 Points +8%
Dell Inspiron 16 Plus 7620
Intel Core i7-12700H, GeForce RTX 3050 Ti Laptop GPU
92646 Points +5%
Dell Inspiron 16 Plus 7640
Intel Core Ultra 7 155H, NVIDIA GeForce RTX 4060 Laptop GPU
87819 Points
Samsung Galaxy Book4 Ultra
Intel Core Ultra 7 155H, NVIDIA GeForce RTX 4050 Laptop GPU
84280 Points -4%
Усредн. модель с Intel Core Ultra 7 155H
  (64698 - 93266, n=32)
83302 Points -5%
AIDA64 / FPU SinJulia
Lenovo Legion 5 16IRX G9
Intel Core i7-14650HX, NVIDIA GeForce RTX 4060 Laptop GPU
11913 Points +20%
Dell Inspiron 16 Plus 7640
Intel Core Ultra 7 155H, NVIDIA GeForce RTX 4060 Laptop GPU
9893 Points
Samsung Galaxy Book4 Ultra
Intel Core Ultra 7 155H, NVIDIA GeForce RTX 4050 Laptop GPU
9696 Points -2%
Усредн. модель с Intel Core Ultra 7 155H
  (5639 - 10647, n=32)
9039 Points -9%
Dell Inspiron 16 Plus 7630
Intel Core i7-13700H, NVIDIA GeForce RTX 4060 Laptop GPU
8930 Points -10%
Asus VivoBook Pro 16 K6602VU
Intel Core i9-13900H, NVIDIA GeForce RTX 4050 Laptop GPU
8842 Points -11%
Dell Inspiron 16 Plus 7620
Intel Core i7-12700H, GeForce RTX 3050 Ti Laptop GPU
8567 Points -13%
AIDA64 / FPU Mandel
Lenovo Legion 5 16IRX G9
Intel Core i7-14650HX, NVIDIA GeForce RTX 4060 Laptop GPU
47097 Points +35%
Dell Inspiron 16 Plus 7640
Intel Core Ultra 7 155H, NVIDIA GeForce RTX 4060 Laptop GPU
35006 Points
Samsung Galaxy Book4 Ultra
Intel Core Ultra 7 155H, NVIDIA GeForce RTX 4050 Laptop GPU
34862 Points 0%
Asus VivoBook Pro 16 K6602VU
Intel Core i9-13900H, NVIDIA GeForce RTX 4050 Laptop GPU
33882 Points -3%
Dell Inspiron 16 Plus 7630
Intel Core i7-13700H, NVIDIA GeForce RTX 4060 Laptop GPU
33737 Points -4%
Усредн. модель с Intel Core Ultra 7 155H
  (18236 - 47685, n=32)
33205 Points -5%
Dell Inspiron 16 Plus 7620
Intel Core i7-12700H, GeForce RTX 3050 Ti Laptop GPU
31113 Points -11%
AIDA64 / CPU AES
Asus VivoBook Pro 16 K6602VU
Intel Core i9-13900H, NVIDIA GeForce RTX 4050 Laptop GPU
121588 MB/s +79%
Lenovo Legion 5 16IRX G9
Intel Core i7-14650HX, NVIDIA GeForce RTX 4060 Laptop GPU
86485 MB/s +27%
Усредн. модель с Intel Core Ultra 7 155H
  (45713 - 152179, n=32)
75079 MB/s +10%
Samsung Galaxy Book4 Ultra
Intel Core Ultra 7 155H, NVIDIA GeForce RTX 4050 Laptop GPU
68288 MB/s 0%
Dell Inspiron 16 Plus 7640
Intel Core Ultra 7 155H, NVIDIA GeForce RTX 4060 Laptop GPU
68050 MB/s
Dell Inspiron 16 Plus 7620
Intel Core i7-12700H, GeForce RTX 3050 Ti Laptop GPU
65597 MB/s -4%
Dell Inspiron 16 Plus 7630
Intel Core i7-13700H, NVIDIA GeForce RTX 4060 Laptop GPU
63127 MB/s -7%
AIDA64 / CPU ZLib
Lenovo Legion 5 16IRX G9
Intel Core i7-14650HX, NVIDIA GeForce RTX 4060 Laptop GPU
1289 MB/s +23%
Dell Inspiron 16 Plus 7640
Intel Core Ultra 7 155H, NVIDIA GeForce RTX 4060 Laptop GPU
1045 MB/s
Dell Inspiron 16 Plus 7620
Intel Core i7-12700H, GeForce RTX 3050 Ti Laptop GPU
969 MB/s -7%
Samsung Galaxy Book4 Ultra
Intel Core Ultra 7 155H, NVIDIA GeForce RTX 4050 Laptop GPU
968 MB/s -7%
Asus VivoBook Pro 16 K6602VU
Intel Core i9-13900H, NVIDIA GeForce RTX 4050 Laptop GPU
966 MB/s -8%
Усредн. модель с Intel Core Ultra 7 155H
  (557 - 1250, n=32)
954 MB/s -9%
Dell Inspiron 16 Plus 7630
Intel Core i7-13700H, NVIDIA GeForce RTX 4060 Laptop GPU
829 MB/s -21%
AIDA64 / FP64 Ray-Trace
Lenovo Legion 5 16IRX G9
Intel Core i7-14650HX, NVIDIA GeForce RTX 4060 Laptop GPU
10316 KRay/s +40%
Asus VivoBook Pro 16 K6602VU
Intel Core i9-13900H, NVIDIA GeForce RTX 4050 Laptop GPU
7420 KRay/s +1%
Dell Inspiron 16 Plus 7640
Intel Core Ultra 7 155H, NVIDIA GeForce RTX 4060 Laptop GPU
7347 KRay/s
Dell Inspiron 16 Plus 7630
Intel Core i7-13700H, NVIDIA GeForce RTX 4060 Laptop GPU
7318 KRay/s 0%
Samsung Galaxy Book4 Ultra
Intel Core Ultra 7 155H, NVIDIA GeForce RTX 4050 Laptop GPU
7087 KRay/s -4%
Dell Inspiron 16 Plus 7620
Intel Core i7-12700H, GeForce RTX 3050 Ti Laptop GPU
6747 KRay/s -8%
Усредн. модель с Intel Core Ultra 7 155H
  (3569 - 9802, n=32)
6745 KRay/s -8%
AIDA64 / CPU PhotoWorxx
Samsung Galaxy Book4 Ultra
Intel Core Ultra 7 155H, NVIDIA GeForce RTX 4050 Laptop GPU
50926 MPixel/s +29%
Усредн. модель с Intel Core Ultra 7 155H
  (32719 - 54223, n=32)
47087 MPixel/s +19%
Dell Inspiron 16 Plus 7640
Intel Core Ultra 7 155H, NVIDIA GeForce RTX 4060 Laptop GPU
39530 MPixel/s
Asus VivoBook Pro 16 K6602VU
Intel Core i9-13900H, NVIDIA GeForce RTX 4050 Laptop GPU
38636 MPixel/s -2%
Dell Inspiron 16 Plus 7630
Intel Core i7-13700H, NVIDIA GeForce RTX 4060 Laptop GPU
37857 MPixel/s -4%
Dell Inspiron 16 Plus 7620
Intel Core i7-12700H, GeForce RTX 3050 Ti Laptop GPU
35147 MPixel/s -11%
Lenovo Legion 5 16IRX G9
Intel Core i7-14650HX, NVIDIA GeForce RTX 4060 Laptop GPU
33763 MPixel/s -15%

Стресс-тест

При запуске стресса Prime95 процессор разгоняется в среднем до 3,2 ГГц, 97 Вт и 101 C в течение примерно 25 секунд. После этого он снижается до ~2,3 ГГц и 44 Вт, чтобы поддерживать температуру ядра на уровне 83 C. Таким образом, производительность Turbo Boost в этой системе недолговечна, как мы наблюдали в предшествующей модели.

Графический процессор Nvidia стабилизируется на частоте 2070 МГц, 76 C и 60 Вт при работе Witcher 3 по сравнению с 2250 МГц, 72 C и 69 Вт на прошлогодней модели при аналогичных условиях тестирования. Эти результаты дополняют общую более низкую производительность в играх, о чем подробно говорится в разделе "Игровая производительность" ниже. Мощность GPU в новой модели Dell достигает 60 Вт по сравнению с 70 Вт в старой модели Dell даже в режиме Performance.

Система простаивает
Система простаивает
Witcher 3 стресс
Witcher 3 стресс
Prime95 стресс
Prime95 стресс
Prime95+FurMark стресс
Средняя тактовая частота CPU (ГГц) Тактовая частота GPU (МГц) Средняя температура CPU (°C) Средняя температура GPU (°C)
Простой системы -- -- 63 45
Prime95 Stress 2.1 - 2.4 -- 83 56
Prime95 + FurMark Stress 0.5 2160 74 70
Witcher 3 Стресс 0.4 2070 77 77

Производительность системы

Результаты PCMark сопоставимы с прошлогодней моделью, несмотря на обновление процессора, и показывают, что новая модель не обязательно быстрее, когда речь идет о большинстве повседневных операций.

PCMark 10 Standard
PCMark 10 Standard
PCMark 10 / Score
Dell Inspiron 16 Plus 7630
NVIDIA GeForce RTX 4060 Laptop GPU, i7-13700H, WD PC SN740 SDDPTQD-1T00
7661 Points +9%
Lenovo Legion 5 16IRX G9
NVIDIA GeForce RTX 4060 Laptop GPU, i7-14650HX, Samsung PM9A1 MZVL21T0HCLR
7645 Points +9%
Asus VivoBook Pro 16 K6602VU
NVIDIA GeForce RTX 4050 Laptop GPU, i9-13900H, Micron 2400 MTFDKBA1T0QFM
7054 Points 0%
Dell Inspiron 16 Plus 7640
NVIDIA GeForce RTX 4060 Laptop GPU, Ultra 7 155H, SK hynix BC901 HFS001TEJ4X164N
7042 Points
Samsung Galaxy Book4 Ultra
NVIDIA GeForce RTX 4050 Laptop GPU, Ultra 7 155H, Samsung PM9A1 MZVL2512HCJQ
6973 Points -1%
Усредн. модель с Intel Core Ultra 7 155H, NVIDIA GeForce RTX 4060 Laptop GPU
  (6800 - 7042, n=3)
6935 Points -2%
Dell Inspiron 16 Plus 7620
GeForce RTX 3050 Ti Laptop GPU, i7-12700H, Kioxia BG5 KBG50ZNS512G
6846 Points -3%
PCMark 10 / Essentials
Dell Inspiron 16 Plus 7630
NVIDIA GeForce RTX 4060 Laptop GPU, i7-13700H, WD PC SN740 SDDPTQD-1T00
11200 Points +9%
Lenovo Legion 5 16IRX G9
NVIDIA GeForce RTX 4060 Laptop GPU, i7-14650HX, Samsung PM9A1 MZVL21T0HCLR
10804 Points +5%
Samsung Galaxy Book4 Ultra
NVIDIA GeForce RTX 4050 Laptop GPU, Ultra 7 155H, Samsung PM9A1 MZVL2512HCJQ
10446 Points +2%
Dell Inspiron 16 Plus 7640
NVIDIA GeForce RTX 4060 Laptop GPU, Ultra 7 155H, SK hynix BC901 HFS001TEJ4X164N
10279 Points
Asus VivoBook Pro 16 K6602VU
NVIDIA GeForce RTX 4050 Laptop GPU, i9-13900H, Micron 2400 MTFDKBA1T0QFM
10237 Points 0%
Dell Inspiron 16 Plus 7620
GeForce RTX 3050 Ti Laptop GPU, i7-12700H, Kioxia BG5 KBG50ZNS512G
10172 Points -1%
Усредн. модель с Intel Core Ultra 7 155H, NVIDIA GeForce RTX 4060 Laptop GPU
  (9476 - 10279, n=3)
9868 Points -4%
PCMark 10 / Productivity
Dell Inspiron 16 Plus 7630
NVIDIA GeForce RTX 4060 Laptop GPU, i7-13700H, WD PC SN740 SDDPTQD-1T00
9394 Points +16%
Lenovo Legion 5 16IRX G9
NVIDIA GeForce RTX 4060 Laptop GPU, i7-14650HX, Samsung PM9A1 MZVL21T0HCLR
9241 Points +14%
Samsung Galaxy Book4 Ultra
NVIDIA GeForce RTX 4050 Laptop GPU, Ultra 7 155H, Samsung PM9A1 MZVL2512HCJQ
9152 Points +13%
Dell Inspiron 16 Plus 7620
GeForce RTX 3050 Ti Laptop GPU, i7-12700H, Kioxia BG5 KBG50ZNS512G
9098 Points +13%
Усредн. модель с Intel Core Ultra 7 155H, NVIDIA GeForce RTX 4060 Laptop GPU
  (8079 - 9477, n=3)
8672 Points +7%
Asus VivoBook Pro 16 K6602VU
NVIDIA GeForce RTX 4050 Laptop GPU, i9-13900H, Micron 2400 MTFDKBA1T0QFM
8667 Points +7%
Dell Inspiron 16 Plus 7640
NVIDIA GeForce RTX 4060 Laptop GPU, Ultra 7 155H, SK hynix BC901 HFS001TEJ4X164N
8079 Points
PCMark 10 / Digital Content Creation
Lenovo Legion 5 16IRX G9
NVIDIA GeForce RTX 4060 Laptop GPU, i7-14650HX, Samsung PM9A1 MZVL21T0HCLR
12144 Points +6%
Dell Inspiron 16 Plus 7630
NVIDIA GeForce RTX 4060 Laptop GPU, i7-13700H, WD PC SN740 SDDPTQD-1T00
11598 Points +2%
Dell Inspiron 16 Plus 7640
NVIDIA GeForce RTX 4060 Laptop GPU, Ultra 7 155H, SK hynix BC901 HFS001TEJ4X164N
11413 Points
Asus VivoBook Pro 16 K6602VU
NVIDIA GeForce RTX 4050 Laptop GPU, i9-13900H, Micron 2400 MTFDKBA1T0QFM
10737 Points -6%
Усредн. модель с Intel Core Ultra 7 155H, NVIDIA GeForce RTX 4060 Laptop GPU
  (9811 - 11413, n=3)
10622 Points -7%
Samsung Galaxy Book4 Ultra
NVIDIA GeForce RTX 4050 Laptop GPU, Ultra 7 155H, Samsung PM9A1 MZVL2512HCJQ
9624 Points -16%
Dell Inspiron 16 Plus 7620
GeForce RTX 3050 Ti Laptop GPU, i7-12700H, Kioxia BG5 KBG50ZNS512G
9409 Points -18%
CrossMark / Overall
Lenovo Legion 5 16IRX G9
NVIDIA GeForce RTX 4060 Laptop GPU, i7-14650HX, Samsung PM9A1 MZVL21T0HCLR
2092 Points +24%
Dell Inspiron 16 Plus 7630
NVIDIA GeForce RTX 4060 Laptop GPU, i7-13700H, WD PC SN740 SDDPTQD-1T00
1849 Points +10%
Dell Inspiron 16 Plus 7620
GeForce RTX 3050 Ti Laptop GPU, i7-12700H, Kioxia BG5 KBG50ZNS512G
1740 Points +3%
Samsung Galaxy Book4 Ultra
NVIDIA GeForce RTX 4050 Laptop GPU, Ultra 7 155H, Samsung PM9A1 MZVL2512HCJQ
1740 Points +3%
Asus VivoBook Pro 16 K6602VU
NVIDIA GeForce RTX 4050 Laptop GPU, i9-13900H, Micron 2400 MTFDKBA1T0QFM
1724 Points +2%
Dell Inspiron 16 Plus 7640
NVIDIA GeForce RTX 4060 Laptop GPU, Ultra 7 155H, SK hynix BC901 HFS001TEJ4X164N
1685 Points
Усредн. модель с Intel Core Ultra 7 155H, NVIDIA GeForce RTX 4060 Laptop GPU
  (1540 - 1723, n=3)
1649 Points -2%
CrossMark / Productivity
Lenovo Legion 5 16IRX G9
NVIDIA GeForce RTX 4060 Laptop GPU, i7-14650HX, Samsung PM9A1 MZVL21T0HCLR
1938 Points +22%
Dell Inspiron 16 Plus 7630
NVIDIA GeForce RTX 4060 Laptop GPU, i7-13700H, WD PC SN740 SDDPTQD-1T00
1743 Points +9%
Asus VivoBook Pro 16 K6602VU
NVIDIA GeForce RTX 4050 Laptop GPU, i9-13900H, Micron 2400 MTFDKBA1T0QFM
1666 Points +5%
Samsung Galaxy Book4 Ultra
NVIDIA GeForce RTX 4050 Laptop GPU, Ultra 7 155H, Samsung PM9A1 MZVL2512HCJQ
1659 Points +4%
Dell Inspiron 16 Plus 7620
GeForce RTX 3050 Ti Laptop GPU, i7-12700H, Kioxia BG5 KBG50ZNS512G
1651 Points +4%
Dell Inspiron 16 Plus 7640
NVIDIA GeForce RTX 4060 Laptop GPU, Ultra 7 155H, SK hynix BC901 HFS001TEJ4X164N
1592 Points
Усредн. модель с Intel Core Ultra 7 155H, NVIDIA GeForce RTX 4060 Laptop GPU
  (1436 - 1677, n=3)
1568 Points -2%
CrossMark / Creativity
Lenovo Legion 5 16IRX G9
NVIDIA GeForce RTX 4060 Laptop GPU, i7-14650HX, Samsung PM9A1 MZVL21T0HCLR
2336 Points +21%
Dell Inspiron 16 Plus 7630
NVIDIA GeForce RTX 4060 Laptop GPU, i7-13700H, WD PC SN740 SDDPTQD-1T00
2064 Points +7%
Samsung Galaxy Book4 Ultra
NVIDIA GeForce RTX 4050 Laptop GPU, Ultra 7 155H, Samsung PM9A1 MZVL2512HCJQ
1930 Points 0%
Dell Inspiron 16 Plus 7640
NVIDIA GeForce RTX 4060 Laptop GPU, Ultra 7 155H, SK hynix BC901 HFS001TEJ4X164N
1929 Points
Dell Inspiron 16 Plus 7620
GeForce RTX 3050 Ti Laptop GPU, i7-12700H, Kioxia BG5 KBG50ZNS512G
1916 Points -1%
Asus VivoBook Pro 16 K6602VU
NVIDIA GeForce RTX 4050 Laptop GPU, i9-13900H, Micron 2400 MTFDKBA1T0QFM
1860 Points -4%
Усредн. модель с Intel Core Ultra 7 155H, NVIDIA GeForce RTX 4060 Laptop GPU
  (1811 - 1929, n=3)
1851 Points -4%
CrossMark / Responsiveness
Lenovo Legion 5 16IRX G9
NVIDIA GeForce RTX 4060 Laptop GPU, i7-14650HX, Samsung PM9A1 MZVL21T0HCLR
1889 Points +42%
Dell Inspiron 16 Plus 7630
NVIDIA GeForce RTX 4060 Laptop GPU, i7-13700H, WD PC SN740 SDDPTQD-1T00
1589 Points +19%
Asus VivoBook Pro 16 K6602VU
NVIDIA GeForce RTX 4050 Laptop GPU, i9-13900H, Micron 2400 MTFDKBA1T0QFM
1524 Points +14%
Dell Inspiron 16 Plus 7620
GeForce RTX 3050 Ti Laptop GPU, i7-12700H, Kioxia BG5 KBG50ZNS512G
1523 Points +14%
Samsung Galaxy Book4 Ultra
NVIDIA GeForce RTX 4050 Laptop GPU, Ultra 7 155H, Samsung PM9A1 MZVL2512HCJQ
1467 Points +10%
Усредн. модель с Intel Core Ultra 7 155H, NVIDIA GeForce RTX 4060 Laptop GPU
  (1165 - 1608, n=3)
1369 Points +3%
Dell Inspiron 16 Plus 7640
NVIDIA GeForce RTX 4060 Laptop GPU, Ultra 7 155H, SK hynix BC901 HFS001TEJ4X164N
1333 Points
WebXPRT 3 / Overall
Dell Inspiron 16 Plus 7630
NVIDIA GeForce RTX 4060 Laptop GPU, i7-13700H, WD PC SN740 SDDPTQD-1T00
314 Points +8%
Lenovo Legion 5 16IRX G9
NVIDIA GeForce RTX 4060 Laptop GPU, i7-14650HX, Samsung PM9A1 MZVL21T0HCLR
311 Points +7%
Dell Inspiron 16 Plus 7620
GeForce RTX 3050 Ti Laptop GPU, i7-12700H, Kioxia BG5 KBG50ZNS512G
291 Points 0%
Dell Inspiron 16 Plus 7640
NVIDIA GeForce RTX 4060 Laptop GPU, Ultra 7 155H, SK hynix BC901 HFS001TEJ4X164N
290 Points
Усредн. модель с Intel Core Ultra 7 155H, NVIDIA GeForce RTX 4060 Laptop GPU
  (274 - 290, n=3)
284 Points -2%
Samsung Galaxy Book4 Ultra
NVIDIA GeForce RTX 4050 Laptop GPU, Ultra 7 155H, Samsung PM9A1 MZVL2512HCJQ
281 Points -3%
WebXPRT 4 / Overall
Lenovo Legion 5 16IRX G9
NVIDIA GeForce RTX 4060 Laptop GPU, i7-14650HX, Samsung PM9A1 MZVL21T0HCLR
283 Points +10%
Dell Inspiron 16 Plus 7630
NVIDIA GeForce RTX 4060 Laptop GPU, i7-13700H, WD PC SN740 SDDPTQD-1T00
274 Points +7%
Dell Inspiron 16 Plus 7620
GeForce RTX 3050 Ti Laptop GPU, i7-12700H, Kioxia BG5 KBG50ZNS512G
258 Points 0%
Samsung Galaxy Book4 Ultra
NVIDIA GeForce RTX 4050 Laptop GPU, Ultra 7 155H, Samsung PM9A1 MZVL2512HCJQ
258 Points 0%
Dell Inspiron 16 Plus 7640
NVIDIA GeForce RTX 4060 Laptop GPU, Ultra 7 155H, SK hynix BC901 HFS001TEJ4X164N
257 Points
Усредн. модель с Intel Core Ultra 7 155H, NVIDIA GeForce RTX 4060 Laptop GPU
  (236 - 262, n=3)
252 Points -2%
Asus VivoBook Pro 16 K6602VU
NVIDIA GeForce RTX 4050 Laptop GPU, i9-13900H, Micron 2400 MTFDKBA1T0QFM
233 Points -9%
Mozilla Kraken 1.1 / Total
Asus VivoBook Pro 16 K6602VU
NVIDIA GeForce RTX 4050 Laptop GPU, i9-13900H, Micron 2400 MTFDKBA1T0QFM
545 ms * -5%
Усредн. модель с Intel Core Ultra 7 155H, NVIDIA GeForce RTX 4060 Laptop GPU
  (519 - 585, n=3)
542 ms * -4%
Dell Inspiron 16 Plus 7620
GeForce RTX 3050 Ti Laptop GPU, i7-12700H, Kioxia BG5 KBG50ZNS512G
530 ms * -2%
Dell Inspiron 16 Plus 7640
NVIDIA GeForce RTX 4060 Laptop GPU, Ultra 7 155H, SK hynix BC901 HFS001TEJ4X164N
519 ms *
Dell Inspiron 16 Plus 7630
NVIDIA GeForce RTX 4060 Laptop GPU, i7-13700H, WD PC SN740 SDDPTQD-1T00
500 ms * +4%
Lenovo Legion 5 16IRX G9
NVIDIA GeForce RTX 4060 Laptop GPU, i7-14650HX, Samsung PM9A1 MZVL21T0HCLR
486 ms * +6%
Samsung Galaxy Book4 Ultra
NVIDIA GeForce RTX 4050 Laptop GPU, Ultra 7 155H, Samsung PM9A1 MZVL2512HCJQ
416.4 ms * +20%

* ... меньше = лучше

PCMark 10 Score
7042 баллов
?
AIDA64 / Memory Copy
Samsung Galaxy Book4 Ultra
Intel Core Ultra 7 155H, NVIDIA GeForce RTX 4050 Laptop GPU
90918 MB/s +43%
Усредн. модель с Intel Core Ultra 7 155H
  (62397 - 96791, n=32)
85576 MB/s +35%
Dell Inspiron 16 Plus 7640
Intel Core Ultra 7 155H, NVIDIA GeForce RTX 4060 Laptop GPU
63520 MB/s
Lenovo Legion 5 16IRX G9
Intel Core i7-14650HX, NVIDIA GeForce RTX 4060 Laptop GPU
59727 MB/s -6%
Dell Inspiron 16 Plus 7630
Intel Core i7-13700H, NVIDIA GeForce RTX 4060 Laptop GPU
59555 MB/s -6%
Asus VivoBook Pro 16 K6602VU
Intel Core i9-13900H, NVIDIA GeForce RTX 4050 Laptop GPU
59266 MB/s -7%
Dell Inspiron 16 Plus 7620
Intel Core i7-12700H, GeForce RTX 3050 Ti Laptop GPU
54375 MB/s -14%
AIDA64 / Memory Read
Samsung Galaxy Book4 Ultra
Intel Core Ultra 7 155H, NVIDIA GeForce RTX 4050 Laptop GPU
89474 MB/s +16%
Усредн. модель с Intel Core Ultra 7 155H
  (60544 - 90647, n=32)
81126 MB/s +5%
Dell Inspiron 16 Plus 7640
Intel Core Ultra 7 155H, NVIDIA GeForce RTX 4060 Laptop GPU
77153 MB/s
Lenovo Legion 5 16IRX G9
Intel Core i7-14650HX, NVIDIA GeForce RTX 4060 Laptop GPU
71455 MB/s -7%
Dell Inspiron 16 Plus 7630
Intel Core i7-13700H, NVIDIA GeForce RTX 4060 Laptop GPU
68066 MB/s -12%
Asus VivoBook Pro 16 K6602VU
Intel Core i9-13900H, NVIDIA GeForce RTX 4050 Laptop GPU
67398 MB/s -13%
Dell Inspiron 16 Plus 7620
Intel Core i7-12700H, GeForce RTX 3050 Ti Laptop GPU
62046 MB/s -20%
AIDA64 / Memory Write
Samsung Galaxy Book4 Ultra
Intel Core Ultra 7 155H, NVIDIA GeForce RTX 4050 Laptop GPU
75813 MB/s +16%
Усредн. модель с Intel Core Ultra 7 155H
  (58692 - 93451, n=32)
73561 MB/s +12%
Dell Inspiron 16 Plus 7640
Intel Core Ultra 7 155H, NVIDIA GeForce RTX 4060 Laptop GPU
65616 MB/s
Asus VivoBook Pro 16 K6602VU
Intel Core i9-13900H, NVIDIA GeForce RTX 4050 Laptop GPU
60548 MB/s -8%
Dell Inspiron 16 Plus 7630
Intel Core i7-13700H, NVIDIA GeForce RTX 4060 Laptop GPU
59733 MB/s -9%
Dell Inspiron 16 Plus 7620
Intel Core i7-12700H, GeForce RTX 3050 Ti Laptop GPU
57432 MB/s -12%
Lenovo Legion 5 16IRX G9
Intel Core i7-14650HX, NVIDIA GeForce RTX 4060 Laptop GPU
51138 MB/s -22%
AIDA64 / Memory Latency
Усредн. модель с Intel Core Ultra 7 155H
  (120.2 - 233, n=32)
146 ns * -21%
Samsung Galaxy Book4 Ultra
Intel Core Ultra 7 155H, NVIDIA GeForce RTX 4050 Laptop GPU
141.4 ns * -18%
Dell Inspiron 16 Plus 7640
Intel Core Ultra 7 155H, NVIDIA GeForce RTX 4060 Laptop GPU
120.2 ns *
Dell Inspiron 16 Plus 7620
Intel Core i7-12700H, GeForce RTX 3050 Ti Laptop GPU
94.7 ns * +21%
Dell Inspiron 16 Plus 7630
Intel Core i7-13700H, NVIDIA GeForce RTX 4060 Laptop GPU
93.7 ns * +22%
Asus VivoBook Pro 16 K6602VU
Intel Core i9-13900H, NVIDIA GeForce RTX 4050 Laptop GPU
93.7 ns * +22%
Lenovo Legion 5 16IRX G9
Intel Core i7-14650HX, NVIDIA GeForce RTX 4060 Laptop GPU
89.8 ns * +25%

* ... меньше = лучше

Задержка DPC

LatencyMon выявляет лишь незначительные проблемы с DPC при открытии нескольких вкладок браузера на нашей домашней странице. воспроизведение 4K-видео с частотой 60 кадров в секунду в остальном безупречно, не зафиксировано ни одного выпавшего кадра.

LatencyMon
LatencyMon
Список драйверов
Список драйверов
DPC Latencies / LatencyMon - interrupt to process latency (max), Web, Youtube, Prime95
Lenovo Legion 5 16IRX G9
NVIDIA GeForce RTX 4060 Laptop GPU, i7-14650HX, Samsung PM9A1 MZVL21T0HCLR
2024.9 μs * -163%
Asus VivoBook Pro 16 K6602VU
NVIDIA GeForce RTX 4050 Laptop GPU, i9-13900H, Micron 2400 MTFDKBA1T0QFM
1753.6 μs * -128%
Dell Inspiron 16 Plus 7630
NVIDIA GeForce RTX 4060 Laptop GPU, i7-13700H, WD PC SN740 SDDPTQD-1T00
1020.2 μs * -32%
Dell Inspiron 16 Plus 7620
GeForce RTX 3050 Ti Laptop GPU, i7-12700H, Kioxia BG5 KBG50ZNS512G
989.5 μs * -28%
Dell Inspiron 16 Plus 7640
NVIDIA GeForce RTX 4060 Laptop GPU, Ultra 7 155H, SK hynix BC901 HFS001TEJ4X164N
770.1 μs *
Samsung Galaxy Book4 Ultra
NVIDIA GeForce RTX 4050 Laptop GPU, Ultra 7 155H, Samsung PM9A1 MZVL2512HCJQ
596.3 μs * +23%

* ... меньше = лучше

Хранение данных

Наше тестовое устройство поставляется с более медленным диском SK Hynix вместо диска Western Digital, установленного в прошлогодней модели. Диск SK Hynix заметно медленнее, как показали наши эталонные тесты, но он не страдает от проблем с дросселированием производительности, что обеспечивает более стабильную скорость передачи данных в целом.

CDM 8
CDM 8
AS SSD
AS SSD
SK hynix BC901 HFS001TEJ4X164N
CDM 5/6 Read Seq Q32T1: 4990 MB/s
CDM 5/6 Write Seq Q32T1: 4141 MB/s
CDM 5/6 Read 4K Q32T1: 371.6 MB/s
CDM 5/6 Write 4K Q32T1: 416.5 MB/s
CDM 5 Read Seq: 2923 MB/s
CDM 5 Write Seq: 2600 MB/s
CDM 5/6 Read 4K: 58.31 MB/s
CDM 5/6 Write 4K: 125.3 MB/s
Drive Performance Rating - Percent
Lenovo Legion 5 16IRX G9
Samsung PM9A1 MZVL21T0HCLR
96 pt
Samsung Galaxy Book4 Ultra
Samsung PM9A1 MZVL2512HCJQ
83.6 pt
Dell Inspiron 16 Plus 7630
WD PC SN740 SDDPTQD-1T00
63.4 pt
Asus VivoBook Pro 16 K6602VU
Micron 2400 MTFDKBA1T0QFM
50.7 pt
Dell Inspiron 16 Plus 7640
SK hynix BC901 HFS001TEJ4X164N
46.8 pt
Dell Inspiron 16 Plus 7620
Kioxia BG5 KBG50ZNS512G
44.9 pt
DiskSpd
seq read
Lenovo Legion 5 16IRX G9
Samsung PM9A1 MZVL21T0HCLR
4182 (4112.68min - 4181.96max) MB/s +86%
Samsung Galaxy Book4 Ultra
Samsung PM9A1 MZVL2512HCJQ
3712 (3688.85min - 3711.75max) MB/s +65%
Dell Inspiron 16 Plus 7630
WD PC SN740 SDDPTQD-1T00
3156 (3078.2min - 3156.21max) MB/s +40%
Dell Inspiron 16 Plus 7620
Kioxia BG5 KBG50ZNS512G
2355 (2335.33min - 2354.8max) MB/s +5%
Dell Inspiron 16 Plus 7640
SK hynix BC901 HFS001TEJ4X164N
2253 (2222.1min - 2252.66max) MB/s
Asus VivoBook Pro 16 K6602VU
Micron 2400 MTFDKBA1T0QFM
1939 (1922.39min - 1939.24max) MB/s -14%
seq write
Samsung Galaxy Book4 Ultra
Samsung PM9A1 MZVL2512HCJQ
4152 (3343.49min - 4151.61max) MB/s +75%
Lenovo Legion 5 16IRX G9
Samsung PM9A1 MZVL21T0HCLR
4064 (3527.07min - 4064.49max) MB/s +72%
Dell Inspiron 16 Plus 7630
WD PC SN740 SDDPTQD-1T00
3503 (3341.99min - 3503.29max) MB/s +48%
Asus VivoBook Pro 16 K6602VU
Micron 2400 MTFDKBA1T0QFM
2433 (2278.56min - 2432.65max) MB/s +3%
Dell Inspiron 16 Plus 7640
SK hynix BC901 HFS001TEJ4X164N
2368 (2226.29min - 2367.89max) MB/s
Dell Inspiron 16 Plus 7620
Kioxia BG5 KBG50ZNS512G
2020 (1893.72min - 2020.34max) MB/s -15%
seq q8 t1 read
Lenovo Legion 5 16IRX G9
Samsung PM9A1 MZVL21T0HCLR
6651 (5971.64min - 6651.33max) MB/s +102%
Samsung Galaxy Book4 Ultra
Samsung PM9A1 MZVL2512HCJQ
5759 (4945.05min - 5758.78max) MB/s +75%
Dell Inspiron 16 Plus 7630
WD PC SN740 SDDPTQD-1T00
5187 (4478.95min - 5186.89max) MB/s +58%
Asus VivoBook Pro 16 K6602VU
Micron 2400 MTFDKBA1T0QFM
4529 (3752.85min - 4529.22max) MB/s +38%
Dell Inspiron 16 Plus 7640
SK hynix BC901 HFS001TEJ4X164N
3290 (2756.65min - 3289.51max) MB/s
Dell Inspiron 16 Plus 7620
Kioxia BG5 KBG50ZNS512G
2569 (2176.89min - 2569.43max) MB/s -22%
seq q8 t1 write
Samsung Galaxy Book4 Ultra
Samsung PM9A1 MZVL2512HCJQ
5032 (4977.28min - 5031.91max) MB/s +24%
Lenovo Legion 5 16IRX G9
Samsung PM9A1 MZVL21T0HCLR
4952 (4919.08min - 4952.42max) MB/s +22%
Dell Inspiron 16 Plus 7630
WD PC SN740 SDDPTQD-1T00
4824 (4712.92min - 4824.08max) MB/s +19%
Dell Inspiron 16 Plus 7640
SK hynix BC901 HFS001TEJ4X164N
4053 (3806.69min - 4053.03max) MB/s
Asus VivoBook Pro 16 K6602VU
Micron 2400 MTFDKBA1T0QFM
3154 (3143.42min - 3153.68max) MB/s -22%
Dell Inspiron 16 Plus 7620
Kioxia BG5 KBG50ZNS512G
2752 (2520.98min - 2752.46max) MB/s -32%
4k q1 t1 read
Lenovo Legion 5 16IRX G9
Samsung PM9A1 MZVL21T0HCLR
83.9 (83.66min - 83.86max) MB/s +89%
Samsung Galaxy Book4 Ultra
Samsung PM9A1 MZVL2512HCJQ
78.3 (76.54min - 78.34max) MB/s +76%
Dell Inspiron 16 Plus 7630
WD PC SN740 SDDPTQD-1T00
73.2 (70.67min - 73.2max) MB/s +64%
Dell Inspiron 16 Plus 7620
Kioxia BG5 KBG50ZNS512G
62.7 (61.51min - 62.72max) MB/s +41%
Dell Inspiron 16 Plus 7640
SK hynix BC901 HFS001TEJ4X164N
44.5 (43.13min - 44.5max) MB/s
Asus VivoBook Pro 16 K6602VU
Micron 2400 MTFDKBA1T0QFM
14.6 (12.18min - 14.59max) MB/s -67%
4k q1 t1 write
Lenovo Legion 5 16IRX G9
Samsung PM9A1 MZVL21T0HCLR
246 (236.18min - 245.56max) MB/s +100%
Asus VivoBook Pro 16 K6602VU
Micron 2400 MTFDKBA1T0QFM
205 (179.98min - 205.28max) MB/s +67%
Samsung Galaxy Book4 Ultra
Samsung PM9A1 MZVL2512HCJQ
164.2 (156.89min - 164.15max) MB/s +33%
Dell Inspiron 16 Plus 7620
Kioxia BG5 KBG50ZNS512G
162.6 (156.2min - 162.6max) MB/s +32%
Dell Inspiron 16 Plus 7630
WD PC SN740 SDDPTQD-1T00
158.8 (155.42min - 158.82max) MB/s +29%
Dell Inspiron 16 Plus 7640
SK hynix BC901 HFS001TEJ4X164N
123 (117.55min - 122.97max) MB/s
4k q32 t16 read
Lenovo Legion 5 16IRX G9
Samsung PM9A1 MZVL21T0HCLR
4010 (4002.81min - 4009.85max) MB/s +597%
Samsung Galaxy Book4 Ultra
Samsung PM9A1 MZVL2512HCJQ
2181 (2156.61min - 2181.46max) MB/s +279%
Asus VivoBook Pro 16 K6602VU
Micron 2400 MTFDKBA1T0QFM
1015 (955.09min - 1015.02max) MB/s +77%
Dell Inspiron 16 Plus 7630
WD PC SN740 SDDPTQD-1T00
725 (704.24min - 724.66max) MB/s +26%
Dell Inspiron 16 Plus 7620
Kioxia BG5 KBG50ZNS512G
652 (637.52min - 651.63max) MB/s +13%
Dell Inspiron 16 Plus 7640
SK hynix BC901 HFS001TEJ4X164N
575 (568.91min - 575.1max) MB/s
4k q32 t16 write
Samsung Galaxy Book4 Ultra
Samsung PM9A1 MZVL2512HCJQ
3101 (2756.05min - 3100.73max) MB/s +687%
Lenovo Legion 5 16IRX G9
Samsung PM9A1 MZVL21T0HCLR
2646 (2422.02min - 2645.88max) MB/s +572%
Asus VivoBook Pro 16 K6602VU
Micron 2400 MTFDKBA1T0QFM
649 (615.74min - 649.21max) MB/s +65%
Dell Inspiron 16 Plus 7630
WD PC SN740 SDDPTQD-1T00
513 (490.37min - 513.26max) MB/s +30%
Dell Inspiron 16 Plus 7620
Kioxia BG5 KBG50ZNS512G
408 (386.27min - 408.12max) MB/s +4%
Dell Inspiron 16 Plus 7640
SK hynix BC901 HFS001TEJ4X164N
394 (375.37min - 394.14max) MB/s
AS SSD
Score Total
Lenovo Legion 5 16IRX G9
Samsung PM9A1 MZVL21T0HCLR
8677 Points +101%
Samsung Galaxy Book4 Ultra
Samsung PM9A1 MZVL2512HCJQ
7043 Points +64%
Dell Inspiron 16 Plus 7630
WD PC SN740 SDDPTQD-1T00
4383 Points +2%
Dell Inspiron 16 Plus 7640
SK hynix BC901 HFS001TEJ4X164N
4307 Points
Asus VivoBook Pro 16 K6602VU
Micron 2400 MTFDKBA1T0QFM
4175 Points -3%
Dell Inspiron 16 Plus 7620
Kioxia BG5 KBG50ZNS512G
2529 Points -41%
Score Read
Lenovo Legion 5 16IRX G9
Samsung PM9A1 MZVL21T0HCLR
3242 Points +157%
Samsung Galaxy Book4 Ultra
Samsung PM9A1 MZVL2512HCJQ
2413 Points +92%
Asus VivoBook Pro 16 K6602VU
Micron 2400 MTFDKBA1T0QFM
1675 Points +33%
Dell Inspiron 16 Plus 7630
WD PC SN740 SDDPTQD-1T00
1459 Points +16%
Dell Inspiron 16 Plus 7640
SK hynix BC901 HFS001TEJ4X164N
1260 Points
Dell Inspiron 16 Plus 7620
Kioxia BG5 KBG50ZNS512G
1190 Points -6%
Score Write
Lenovo Legion 5 16IRX G9
Samsung PM9A1 MZVL21T0HCLR
3846 Points +55%
Samsung Galaxy Book4 Ultra
Samsung PM9A1 MZVL2512HCJQ
3462 Points +39%
Dell Inspiron 16 Plus 7640
SK hynix BC901 HFS001TEJ4X164N
2482 Points
Dell Inspiron 16 Plus 7630
WD PC SN740 SDDPTQD-1T00
2233 Points -10%
Asus VivoBook Pro 16 K6602VU
Micron 2400 MTFDKBA1T0QFM
1707 Points -31%
Dell Inspiron 16 Plus 7620
Kioxia BG5 KBG50ZNS512G
762 Points -69%
Seq Read
Lenovo Legion 5 16IRX G9
Samsung PM9A1 MZVL21T0HCLR
5413 MB/s +33%
Samsung Galaxy Book4 Ultra
Samsung PM9A1 MZVL2512HCJQ
5351 MB/s +32%
Dell Inspiron 16 Plus 7630
WD PC SN740 SDDPTQD-1T00
4349.04 MB/s +7%
Dell Inspiron 16 Plus 7640
SK hynix BC901 HFS001TEJ4X164N
4056.14 MB/s
Asus VivoBook Pro 16 K6602VU
Micron 2400 MTFDKBA1T0QFM
3615.69 MB/s -11%
Dell Inspiron 16 Plus 7620
Kioxia BG5 KBG50ZNS512G
2693.29 MB/s -34%
Seq Write
Lenovo Legion 5 16IRX G9
Samsung PM9A1 MZVL21T0HCLR
3979 MB/s +76%
Samsung Galaxy Book4 Ultra
Samsung PM9A1 MZVL2512HCJQ
3925 MB/s +73%
Dell Inspiron 16 Plus 7630
WD PC SN740 SDDPTQD-1T00
2904.62 MB/s +28%
Dell Inspiron 16 Plus 7640
SK hynix BC901 HFS001TEJ4X164N
2267 MB/s
Asus VivoBook Pro 16 K6602VU
Micron 2400 MTFDKBA1T0QFM
2237.69 MB/s -1%
Dell Inspiron 16 Plus 7620
Kioxia BG5 KBG50ZNS512G
1683.46 MB/s -26%
4K Read
Lenovo Legion 5 16IRX G9
Samsung PM9A1 MZVL21T0HCLR
81.2 MB/s +64%
Dell Inspiron 16 Plus 7630
WD PC SN740 SDDPTQD-1T00
65.43 MB/s +32%
Samsung Galaxy Book4 Ultra
Samsung PM9A1 MZVL2512HCJQ
65.3 MB/s +32%
Dell Inspiron 16 Plus 7620
Kioxia BG5 KBG50ZNS512G
65.01 MB/s +31%
Asus VivoBook Pro 16 K6602VU
Micron 2400 MTFDKBA1T0QFM
50.14 MB/s +1%
Dell Inspiron 16 Plus 7640
SK hynix BC901 HFS001TEJ4X164N
49.59 MB/s
4K Write
Asus VivoBook Pro 16 K6602VU
Micron 2400 MTFDKBA1T0QFM
287.67 MB/s +75%
Dell Inspiron 16 Plus 7630
WD PC SN740 SDDPTQD-1T00
225.06 MB/s +37%
Dell Inspiron 16 Plus 7620
Kioxia BG5 KBG50ZNS512G
197.81 MB/s +20%
Lenovo Legion 5 16IRX G9
Samsung PM9A1 MZVL21T0HCLR
194.6 MB/s +18%
Dell Inspiron 16 Plus 7640
SK hynix BC901 HFS001TEJ4X164N
164.61 MB/s
Samsung Galaxy Book4 Ultra
Samsung PM9A1 MZVL2512HCJQ
153.2 MB/s -7%
4K-64 Read
Lenovo Legion 5 16IRX G9
Samsung PM9A1 MZVL21T0HCLR
2619 MB/s +225%
Samsung Galaxy Book4 Ultra
Samsung PM9A1 MZVL2512HCJQ
1813 MB/s +125%
Asus VivoBook Pro 16 K6602VU
Micron 2400 MTFDKBA1T0QFM
1263.15 MB/s +57%
Dell Inspiron 16 Plus 7630
WD PC SN740 SDDPTQD-1T00
959.03 MB/s +19%
Dell Inspiron 16 Plus 7620
Kioxia BG5 KBG50ZNS512G
855.48 MB/s +6%
Dell Inspiron 16 Plus 7640
SK hynix BC901 HFS001TEJ4X164N
804.71 MB/s
4K-64 Write
Lenovo Legion 5 16IRX G9
Samsung PM9A1 MZVL21T0HCLR
3253 MB/s +56%
Samsung Galaxy Book4 Ultra
Samsung PM9A1 MZVL2512HCJQ
2916 MB/s +39%
Dell Inspiron 16 Plus 7640
SK hynix BC901 HFS001TEJ4X164N
2090.45 MB/s
Dell Inspiron 16 Plus 7630
WD PC SN740 SDDPTQD-1T00
1717.85 MB/s -18%
Asus VivoBook Pro 16 K6602VU
Micron 2400 MTFDKBA1T0QFM
1195.4 MB/s -43%
Dell Inspiron 16 Plus 7620
Kioxia BG5 KBG50ZNS512G
395.8 MB/s -81%
Access Time Read
Asus VivoBook Pro 16 K6602VU
Micron 2400 MTFDKBA1T0QFM
0.116 ms * -25%
Dell Inspiron 16 Plus 7640
SK hynix BC901 HFS001TEJ4X164N
0.093 ms *
Dell Inspiron 16 Plus 7620
Kioxia BG5 KBG50ZNS512G
0.078 ms * +16%
Dell Inspiron 16 Plus 7630
WD PC SN740 SDDPTQD-1T00
0.057 ms * +39%
Samsung Galaxy Book4 Ultra
Samsung PM9A1 MZVL2512HCJQ
0.033 ms * +65%
Lenovo Legion 5 16IRX G9
Samsung PM9A1 MZVL21T0HCLR
0.021 ms * +77%
Access Time Write
Dell Inspiron 16 Plus 7640
SK hynix BC901 HFS001TEJ4X164N
0.318 ms *
Asus VivoBook Pro 16 K6602VU
Micron 2400 MTFDKBA1T0QFM
0.104 ms * +67%
Dell Inspiron 16 Plus 7630
WD PC SN740 SDDPTQD-1T00
0.07 ms * +78%
Dell Inspiron 16 Plus 7620
Kioxia BG5 KBG50ZNS512G
0.06 ms * +81%
Samsung Galaxy Book4 Ultra
Samsung PM9A1 MZVL2512HCJQ
0.027 ms * +92%
Lenovo Legion 5 16IRX G9
Samsung PM9A1 MZVL21T0HCLR
0.02 ms * +94%

* ... меньше = лучше

Чтение в DiskSpd, Глубина запроса 8

02655307951060132515901855212023852650291531803445371039754240450547705035Tooltip
Dell Inspiron 16 Plus 7640 SK hynix BC901 HFS001TEJ4X164N; diskspd 2.0.17 f: Ø3418 (2978.08-3468.04)
Dell Inspiron 16 Plus 7630 WD PC SN740 SDDPTQD-1T00: Ø3914 (2328.05-5205.69)

Видеокарта

Варианты графических процессоров Nvidia остаются прежними GeForce RTX 4050 и 4060 варианты. результаты 3DMark на несколько процентных пунктов выше, чем раньше, но это, к сожалению, не отражается на реальной игровой производительности.

Ожидается, что снижение производительности до RTX 4050 повлияет на производительность всего на 10%. Отказ от дискретной графики повлияет на производительность гораздо значительнее - на 60-80%.

Профиль мощностиОценка графикиОценка физикиКомбинированный балл
Режим производительности224762631710876
Сбалансированный режим22542 (-0%)27226 (-0%)10829 (-0%)
Питание от аккумулятора21957 (-2%)26817 (-0%)9623 (-12%)

Работа в сбалансированном режиме вместо режима производительности не оказывает существенного влияния на производительность, как показано в нашей таблице результатов Fire Strike выше. Даже работа от батареи сохраняет производительность достаточно хорошо.

Speed Highway
Speed Highway
Stell Nomad
Stell Nomad
Fire Strike Производительность
Time Spy
Time Spy
3DMark Performance Rating - Percent
Acer Nitro 16 AN16-41
NVIDIA GeForce RTX 4070 Laptop GPU, AMD Ryzen 7 7735HS
99.6 pt
Lenovo Legion 5 16IRX G9
NVIDIA GeForce RTX 4060 Laptop GPU, Intel Core i7-14650HX
94.6 pt
Framework Laptop 16
AMD Radeon RX 7700S, AMD Ryzen 9 7940HS
86.9 pt
Усредн. модель с NVIDIA GeForce RTX 4060 Laptop GPU
 
84.9 pt
Lenovo Legion S7 16ARHA7
AMD Radeon RX 6800S, AMD Ryzen 9 6900HX
80.8 pt
Acer Nitro 16 AN16-41-R7YE
NVIDIA GeForce RTX 4050 Laptop GPU, AMD Ryzen 5 7535HS
73.3 pt
Dell Inspiron 16 Plus 7640
NVIDIA GeForce RTX 4060 Laptop GPU, Intel Core Ultra 7 155H
72.8 pt
Dell Inspiron 16 Plus 7630
NVIDIA GeForce RTX 4060 Laptop GPU, Intel Core i7-13700H
69.7 pt
Asus VivoBook Pro 16 K6602VU
NVIDIA GeForce RTX 4050 Laptop GPU, Intel Core i9-13900H
65.4 pt
Dell Inspiron 16 Plus 7620
NVIDIA GeForce RTX 3050 Ti Laptop GPU, Intel Core i7-12700H
46.6 pt
Acer Swift Edge SFE16 Ryzen 7 7840U
AMD Radeon 780M, AMD Ryzen 7 7840U
23.6 pt
Lenovo Yoga 7 2-in-1 16IML9
Intel Graphics 4-Cores iGPU (Arc), Intel Core Ultra 5 125U
15.8 pt
Lenovo ThinkPad E16 G1-21JUS08X00
AMD Radeon RX Vega 8 (Ryzen 4000/5000), AMD Ryzen 7 7730U
11.8 pt
Lenovo ThinkBook 16 G6 ABP
AMD Radeon RX Vega 7, AMD Ryzen 5 7530U
11.3 pt
3DMark 11 - 1280x720 Performance GPU
Acer Nitro 16 AN16-41
NVIDIA GeForce RTX 4070 Laptop GPU, AMD Ryzen 7 7735HS
40995 Points +36%
Framework Laptop 16
AMD Radeon RX 7700S, AMD Ryzen 9 7940HS
37918 Points +26%
Lenovo Legion 5 16IRX G9
NVIDIA GeForce RTX 4060 Laptop GPU, Intel Core i7-14650HX
37410 Points +24%
Lenovo Legion S7 16ARHA7
AMD Radeon RX 6800S, AMD Ryzen 9 6900HX
35198 Points +17%
Усредн. модель с NVIDIA GeForce RTX 4060 Laptop GPU
  (28136 - 38912, n=42)
34554 Points +15%
Acer Nitro 16 AN16-41-R7YE
NVIDIA GeForce RTX 4050 Laptop GPU, AMD Ryzen 5 7535HS
30717 Points +2%
Dell Inspiron 16 Plus 7640
NVIDIA GeForce RTX 4060 Laptop GPU, Intel Core Ultra 7 155H
30097 Points
Dell Inspiron 16 Plus 7630
NVIDIA GeForce RTX 4060 Laptop GPU, Intel Core i7-13700H
28621 Points -5%
Asus VivoBook Pro 16 K6602VU
NVIDIA GeForce RTX 4050 Laptop GPU, Intel Core i9-13900H
27686 Points -8%
Dell Inspiron 16 Plus 7620
NVIDIA GeForce RTX 3050 Ti Laptop GPU, Intel Core i7-12700H
18679 Points -38%
Acer Swift Edge SFE16 Ryzen 7 7840U
AMD Radeon 780M, AMD Ryzen 7 7840U
11636 Points -61%
Lenovo Yoga 7 2-in-1 16IML9
Intel Graphics 4-Cores iGPU (Arc), Intel Core Ultra 5 125U
6711 Points -78%
Lenovo ThinkPad E16 G1-21JUS08X00
AMD Radeon RX Vega 8 (Ryzen 4000/5000), AMD Ryzen 7 7730U
5847 Points -81%
Lenovo ThinkBook 16 G6 ABP
AMD Radeon RX Vega 7, AMD Ryzen 5 7530U
5517 Points -82%
3DMark
1920x1080 Fire Strike Graphics
Acer Nitro 16 AN16-41
NVIDIA GeForce RTX 4070 Laptop GPU, AMD Ryzen 7 7735HS
29853 Points +33%
Lenovo Legion 5 16IRX G9
NVIDIA GeForce RTX 4060 Laptop GPU, Intel Core i7-14650HX
27474 Points +22%
Lenovo Legion S7 16ARHA7
AMD Radeon RX 6800S, AMD Ryzen 9 6900HX
25625 Points +14%
Усредн. модель с NVIDIA GeForce RTX 4060 Laptop GPU
  (20533 - 29656, n=39)
25441 Points +13%
Framework Laptop 16
AMD Radeon RX 7700S, AMD Ryzen 9 7940HS
24246 Points +8%
Acer Nitro 16 AN16-41-R7YE
NVIDIA GeForce RTX 4050 Laptop GPU, AMD Ryzen 5 7535HS
23204 Points +3%
Dell Inspiron 16 Plus 7640
NVIDIA GeForce RTX 4060 Laptop GPU, Intel Core Ultra 7 155H
22476 Points
Dell Inspiron 16 Plus 7630
NVIDIA GeForce RTX 4060 Laptop GPU, Intel Core i7-13700H
21600 Points -4%
Asus VivoBook Pro 16 K6602VU
NVIDIA GeForce RTX 4050 Laptop GPU, Intel Core i9-13900H
20359 Points -9%
Dell Inspiron 16 Plus 7620
NVIDIA GeForce RTX 3050 Ti Laptop GPU, Intel Core i7-12700H
13760 Points -39%
Acer Swift Edge SFE16 Ryzen 7 7840U
AMD Radeon 780M, AMD Ryzen 7 7840U
7156 Points -68%
Lenovo Yoga 7 2-in-1 16IML9
Intel Graphics 4-Cores iGPU (Arc), Intel Core Ultra 5 125U
4786 Points -79%
Lenovo ThinkPad E16 G1-21JUS08X00
AMD Radeon RX Vega 8 (Ryzen 4000/5000), AMD Ryzen 7 7730U
3516 Points -84%
Lenovo ThinkBook 16 G6 ABP
AMD Radeon RX Vega 7, AMD Ryzen 5 7530U
3437 Points -85%
2560x1440 Time Spy Graphics
Acer Nitro 16 AN16-41
NVIDIA GeForce RTX 4070 Laptop GPU, AMD Ryzen 7 7735HS
11868 Points +44%
Lenovo Legion 5 16IRX G9
NVIDIA GeForce RTX 4060 Laptop GPU, Intel Core i7-14650HX
11267 Points +37%
Framework Laptop 16
AMD Radeon RX 7700S, AMD Ryzen 9 7940HS
10206 Points +24%
Усредн. модель с NVIDIA GeForce RTX 4060 Laptop GPU
  (7484 - 11451, n=41)
9860 Points +20%
Lenovo Legion S7 16ARHA7
AMD Radeon RX 6800S, AMD Ryzen 9 6900HX
8820 Points +7%
Acer Nitro 16 AN16-41-R7YE
NVIDIA GeForce RTX 4050 Laptop GPU, AMD Ryzen 5 7535HS
8363 Points +2%
Dell Inspiron 16 Plus 7640
NVIDIA GeForce RTX 4060 Laptop GPU, Intel Core Ultra 7 155H
8229 Points
Dell Inspiron 16 Plus 7630
NVIDIA GeForce RTX 4060 Laptop GPU, Intel Core i7-13700H
7877 Points -4%
Asus VivoBook Pro 16 K6602VU
NVIDIA GeForce RTX 4050 Laptop GPU, Intel Core i9-13900H
7391 Points -10%
Dell Inspiron 16 Plus 7620
NVIDIA GeForce RTX 3050 Ti Laptop GPU, Intel Core i7-12700H
5352 Points -35%
Acer Swift Edge SFE16 Ryzen 7 7840U
AMD Radeon 780M, AMD Ryzen 7 7840U
2363 Points -71%
Lenovo Yoga 7 2-in-1 16IML9
Intel Graphics 4-Cores iGPU (Arc), Intel Core Ultra 5 125U
1704 Points -79%
Lenovo ThinkPad E16 G1-21JUS08X00
AMD Radeon RX Vega 8 (Ryzen 4000/5000), AMD Ryzen 7 7730U
1164 Points -86%
Lenovo ThinkBook 16 G6 ABP
AMD Radeon RX Vega 7, AMD Ryzen 5 7530U
1123 Points -86%
2560x1440 Time Spy Score
Lenovo Legion 5 16IRX G9
NVIDIA GeForce RTX 4060 Laptop GPU, Intel Core i7-14650HX
11731 Points +37%
Acer Nitro 16 AN16-41
NVIDIA GeForce RTX 4070 Laptop GPU, AMD Ryzen 7 7735HS
11530 Points +34%
Framework Laptop 16
AMD Radeon RX 7700S, AMD Ryzen 9 7940HS
10294 Points +20%
Усредн. модель с NVIDIA GeForce RTX 4060 Laptop GPU
  (7918 - 11738, n=41)
10212 Points +19%
Lenovo Legion S7 16ARHA7
AMD Radeon RX 6800S, AMD Ryzen 9 6900HX
9060 Points +6%
Dell Inspiron 16 Plus 7640
NVIDIA GeForce RTX 4060 Laptop GPU, Intel Core Ultra 7 155H
8576 Points
Dell Inspiron 16 Plus 7630
NVIDIA GeForce RTX 4060 Laptop GPU, Intel Core i7-13700H
8240 Points -4%
Acer Nitro 16 AN16-41-R7YE
NVIDIA GeForce RTX 4050 Laptop GPU, AMD Ryzen 5 7535HS
8227 Points -4%
Asus VivoBook Pro 16 K6602VU
NVIDIA GeForce RTX 4050 Laptop GPU, Intel Core i9-13900H
7458 Points -13%
Dell Inspiron 16 Plus 7620
NVIDIA GeForce RTX 3050 Ti Laptop GPU, Intel Core i7-12700H
5835 Points -32%
Acer Swift Edge SFE16 Ryzen 7 7840U
AMD Radeon 780M, AMD Ryzen 7 7840U
2613 Points -70%
Lenovo Yoga 7 2-in-1 16IML9
Intel Graphics 4-Cores iGPU (Arc), Intel Core Ultra 5 125U
1919 Points -78%
Lenovo ThinkPad E16 G1-21JUS08X00
AMD Radeon RX Vega 8 (Ryzen 4000/5000), AMD Ryzen 7 7730U
1328 Points -85%
Lenovo ThinkBook 16 G6 ABP
AMD Radeon RX Vega 7, AMD Ryzen 5 7530U
1275 Points -85%
3DMark 11 Performance
21491 баллов
3DMark Fire Strike Score
20719 баллов
3DMark Time Spy Score
8576 баллов
3DMark Steel Nomad Score
1829 баллов
?
Blender
v3.3 Classroom HIP/AMD
Lenovo ThinkBook 16 G6 ABP
AMD Radeon RX Vega 7, AMD Ryzen 5 7530U
710 Seconds *
Lenovo ThinkPad E16 G1-21JUS08X00
AMD Radeon RX Vega 8 (Ryzen 4000/5000), AMD Ryzen 7 7730U
697 Seconds *
Lenovo Legion S7 16ARHA7
AMD Radeon RX 6800S, AMD Ryzen 9 6900HX
75 Seconds *
v3.3 Classroom OPTIX/RTX
Dell Inspiron 16 Plus 7620
NVIDIA GeForce RTX 3050 Ti Laptop GPU, Intel Core i7-12700H
49 Seconds * -104%
Asus VivoBook Pro 16 K6602VU
NVIDIA GeForce RTX 4050 Laptop GPU, Intel Core i9-13900H
29 Seconds * -21%
Dell Inspiron 16 Plus 7630
NVIDIA GeForce RTX 4060 Laptop GPU, Intel Core i7-13700H
27 Seconds * -13%
Acer Nitro 16 AN16-41-R7YE
NVIDIA GeForce RTX 4050 Laptop GPU, AMD Ryzen 5 7535HS
26 Seconds * -8%
Dell Inspiron 16 Plus 7640
NVIDIA GeForce RTX 4060 Laptop GPU, Intel Core Ultra 7 155H
24 Seconds *
Усредн. модель с NVIDIA GeForce RTX 4060 Laptop GPU
  (19 - 28, n=38)
23.1 Seconds * +4%
Lenovo Legion 5 16IRX G9
NVIDIA GeForce RTX 4060 Laptop GPU, Intel Core i7-14650HX
23 Seconds * +4%
Acer Nitro 16 AN16-41
NVIDIA GeForce RTX 4070 Laptop GPU, AMD Ryzen 7 7735HS
21 Seconds * +12%
v3.3 Classroom CUDA
Dell Inspiron 16 Plus 7620
NVIDIA GeForce RTX 3050 Ti Laptop GPU, Intel Core i7-12700H
84 Seconds * -91%
Asus VivoBook Pro 16 K6602VU
NVIDIA GeForce RTX 4050 Laptop GPU, Intel Core i9-13900H
53 Seconds * -20%
Acer Nitro 16 AN16-41-R7YE
NVIDIA GeForce RTX 4050 Laptop GPU, AMD Ryzen 5 7535HS
50 Seconds * -14%
Dell Inspiron 16 Plus 7630
NVIDIA GeForce RTX 4060 Laptop GPU, Intel Core i7-13700H
49 Seconds * -11%
Dell Inspiron 16 Plus 7640
NVIDIA GeForce RTX 4060 Laptop GPU, Intel Core Ultra 7 155H
44 Seconds *
Усредн. модель с NVIDIA GeForce RTX 4060 Laptop GPU
  (39 - 53, n=38)
43.6 Seconds * +1%
Lenovo Legion 5 16IRX G9
NVIDIA GeForce RTX 4060 Laptop GPU, Intel Core i7-14650HX
41 Seconds * +7%
Acer Nitro 16 AN16-41
NVIDIA GeForce RTX 4070 Laptop GPU, AMD Ryzen 7 7735HS
35 Seconds * +20%
v3.3 Classroom CPU
Lenovo Yoga 7 2-in-1 16IML9
Intel Graphics 4-Cores iGPU (Arc), Intel Core Ultra 5 125U
648 Seconds * -78%
Lenovo ThinkBook 16 G6 ABP
AMD Radeon RX Vega 7, AMD Ryzen 5 7530U
583 Seconds * -60%
Lenovo ThinkPad E16 G1-21JUS08X00
AMD Radeon RX Vega 8 (Ryzen 4000/5000), AMD Ryzen 7 7730U
524 Seconds * -44%
Acer Nitro 16 AN16-41-R7YE
NVIDIA GeForce RTX 4050 Laptop GPU, AMD Ryzen 5 7535HS
481 Seconds * -32%
Acer Swift Edge SFE16 Ryzen 7 7840U
AMD Radeon 780M, AMD Ryzen 7 7840U
460 Seconds * -26%
Dell Inspiron 16 Plus 7620
NVIDIA GeForce RTX 3050 Ti Laptop GPU, Intel Core i7-12700H
436 Seconds * -19%
Dell Inspiron 16 Plus 7630
NVIDIA GeForce RTX 4060 Laptop GPU, Intel Core i7-13700H
400 Seconds * -10%
Asus VivoBook Pro 16 K6602VU
NVIDIA GeForce RTX 4050 Laptop GPU, Intel Core i9-13900H
377 Seconds * -3%
Dell Inspiron 16 Plus 7640
NVIDIA GeForce RTX 4060 Laptop GPU, Intel Core Ultra 7 155H
365 Seconds *
Acer Nitro 16 AN16-41
NVIDIA GeForce RTX 4070 Laptop GPU, AMD Ryzen 7 7735HS
364 Seconds * -0%
Lenovo Legion S7 16ARHA7
AMD Radeon RX 6800S, AMD Ryzen 9 6900HX
361 Seconds * +1%
Усредн. модель с NVIDIA GeForce RTX 4060 Laptop GPU
  (189 - 452, n=38)
312 Seconds * +15%
Framework Laptop 16
AMD Radeon RX 7700S, AMD Ryzen 9 7940HS
311 Seconds * +15%
Lenovo Legion 5 16IRX G9
NVIDIA GeForce RTX 4060 Laptop GPU, Intel Core i7-14650HX
247 Seconds * +32%

* ... меньше = лучше

Игры

Производительность в играх не изменилась и даже может быть немного хуже, чем раньше. Final Fantasy XV, например, может работать на 10% медленнее, чем на Inspiron 16 Plus 7630, меньший дефицит наблюдается и в других играх, включая F1 22 и Strange Brigade.

Performance Rating - Percent
Lenovo Legion 5 16IRX G9
Intel Core i7-14650HX, NVIDIA GeForce RTX 4060 Laptop GPU
100 pt
Dell Inspiron 16 Plus 7630
Intel Core i7-13700H, NVIDIA GeForce RTX 4060 Laptop GPU
82.4 pt
Dell Inspiron 16 Plus 7640
Intel Core Ultra 7 155H, NVIDIA GeForce RTX 4060 Laptop GPU
75.8 pt
Asus VivoBook Pro 16 K6602VU
Intel Core i9-13900H, NVIDIA GeForce RTX 4050 Laptop GPU
73.5 pt
Dell Inspiron 16 Plus 7620 -1!
Intel Core i7-12700H, NVIDIA GeForce RTX 3050 Ti Laptop GPU
61.8 pt
Samsung Galaxy Book4 Ultra
Intel Core Ultra 7 155H, NVIDIA GeForce RTX 4050 Laptop GPU
59.2 pt
The Witcher 3 - 1920x1080 Ultra Graphics & Postprocessing (HBAO+)
Lenovo Legion 5 16IRX G9
Intel Core i7-14650HX, NVIDIA GeForce RTX 4060 Laptop GPU
97.2 (93min, 94P1) fps +16%
Dell Inspiron 16 Plus 7630
Intel Core i7-13700H, NVIDIA GeForce RTX 4060 Laptop GPU
90.9 (85min) fps +8%
Dell Inspiron 16 Plus 7640
Intel Core Ultra 7 155H, NVIDIA GeForce RTX 4060 Laptop GPU
84.1 (80min) fps
Asus VivoBook Pro 16 K6602VU
Intel Core i9-13900H, NVIDIA GeForce RTX 4050 Laptop GPU
76.6 (69min, 69.34P1) fps -9%
Dell Inspiron 16 Plus 7620
Intel Core i7-12700H, NVIDIA GeForce RTX 3050 Ti Laptop GPU
57 (53min) fps -32%
Samsung Galaxy Book4 Ultra
Intel Core Ultra 7 155H, NVIDIA GeForce RTX 4050 Laptop GPU
54.5 (51min, 52P1) fps -35%
Final Fantasy XV Benchmark - 1920x1080 High Quality
Lenovo Legion 5 16IRX G9
Intel Core i7-14650HX, NVIDIA GeForce RTX 4060 Laptop GPU
106.3 fps +35%
Dell Inspiron 16 Plus 7630
Intel Core i7-13700H, NVIDIA GeForce RTX 4060 Laptop GPU
88.9 fps +13%
Dell Inspiron 16 Plus 7640
Intel Core Ultra 7 155H, NVIDIA GeForce RTX 4060 Laptop GPU
78.8 fps
Asus VivoBook Pro 16 K6602VU
Intel Core i9-13900H, NVIDIA GeForce RTX 4050 Laptop GPU
75.6 fps -4%
Samsung Galaxy Book4 Ultra
Intel Core Ultra 7 155H, NVIDIA GeForce RTX 4050 Laptop GPU
56.7 fps -28%
Dell Inspiron 16 Plus 7620
Intel Core i7-12700H, NVIDIA GeForce RTX 3050 Ti Laptop GPU
54.1 fps -31%
Strange Brigade - 1920x1080 ultra AA:ultra AF:16
Lenovo Legion 5 16IRX G9
Intel Core i7-14650HX, NVIDIA GeForce RTX 4060 Laptop GPU
210 fps +37%
Dell Inspiron 16 Plus 7630
Intel Core i7-13700H, NVIDIA GeForce RTX 4060 Laptop GPU
161 (79.8min, 120.7P1) fps +5%
Dell Inspiron 16 Plus 7640
Intel Core Ultra 7 155H, NVIDIA GeForce RTX 4060 Laptop GPU
153.5 (48min, 114.7P1) fps
Asus VivoBook Pro 16 K6602VU
Intel Core i9-13900H, NVIDIA GeForce RTX 4050 Laptop GPU
132 (22.5min, 102.9P1) fps -14%
Samsung Galaxy Book4 Ultra
Intel Core Ultra 7 155H, NVIDIA GeForce RTX 4050 Laptop GPU
113 fps -26%
Dell Inspiron 16 Plus 7620
Intel Core i7-12700H, NVIDIA GeForce RTX 3050 Ti Laptop GPU
95.2 (68.1min, 72.5P1) fps -38%
Dota 2 Reborn - 1920x1080 ultra (3/3) best looking
Lenovo Legion 5 16IRX G9
Intel Core i7-14650HX, NVIDIA GeForce RTX 4060 Laptop GPU
168.7 (146.8min) fps +25%
Dell Inspiron 16 Plus 7630
Intel Core i7-13700H, NVIDIA GeForce RTX 4060 Laptop GPU
146.1 (126.2min) fps +8%
Dell Inspiron 16 Plus 7620
Intel Core i7-12700H, NVIDIA GeForce RTX 3050 Ti Laptop GPU
140.7 (122.6min) fps +4%
Dell Inspiron 16 Plus 7640
Intel Core Ultra 7 155H, NVIDIA GeForce RTX 4060 Laptop GPU
135.1 (116.3min) fps
Samsung Galaxy Book4 Ultra
Intel Core Ultra 7 155H, NVIDIA GeForce RTX 4050 Laptop GPU
126.8 (108.1min) fps -6%
Asus VivoBook Pro 16 K6602VU
Intel Core i9-13900H, NVIDIA GeForce RTX 4050 Laptop GPU
126 (107.9min) fps -7%
X-Plane 11.11 - 1920x1080 high (fps_test=3)
Lenovo Legion 5 16IRX G9
Intel Core i7-14650HX, NVIDIA GeForce RTX 4060 Laptop GPU
130.9 fps +51%
Dell Inspiron 16 Plus 7630
Intel Core i7-13700H, NVIDIA GeForce RTX 4060 Laptop GPU
109.7 fps +27%
Asus VivoBook Pro 16 K6602VU
Intel Core i9-13900H, NVIDIA GeForce RTX 4050 Laptop GPU
108.4 fps +25%
Dell Inspiron 16 Plus 7620
Intel Core i7-12700H, NVIDIA GeForce RTX 3050 Ti Laptop GPU
92.8 fps +7%
Dell Inspiron 16 Plus 7640
Intel Core Ultra 7 155H, NVIDIA GeForce RTX 4060 Laptop GPU
86.5 fps
Samsung Galaxy Book4 Ultra
Intel Core Ultra 7 155H, NVIDIA GeForce RTX 4050 Laptop GPU
81.5 fps -6%
Far Cry 5 - 1920x1080 Ultra Preset AA:T
Lenovo Legion 5 16IRX G9
Intel Core i7-14650HX, NVIDIA GeForce RTX 4060 Laptop GPU
147 fps +34%
Dell Inspiron 16 Plus 7640
Intel Core Ultra 7 155H, NVIDIA GeForce RTX 4060 Laptop GPU
110 (81min) fps
Asus VivoBook Pro 16 K6602VU
Intel Core i9-13900H, NVIDIA GeForce RTX 4050 Laptop GPU
104 (73min) fps -5%
Dell Inspiron 16 Plus 7630
Intel Core i7-13700H, NVIDIA GeForce RTX 4060 Laptop GPU
103 (74min) fps -6%
Samsung Galaxy Book4 Ultra
Intel Core Ultra 7 155H, NVIDIA GeForce RTX 4050 Laptop GPU
80 fps -27%
Tiny Tina's Wonderlands
1920x1080 Low Preset (DX12)
Усредн. модель с NVIDIA GeForce RTX 4060 Laptop GPU
  (164.4 - 235, n=8)
199.4 fps +12%
Framework Laptop 16
AMD Ryzen 9 7940HS, AMD Radeon RX 7700S
183.5 fps +3%
Dell Inspiron 16 Plus 7640
Intel Core Ultra 7 155H, NVIDIA GeForce RTX 4060 Laptop GPU
177.4 fps
Dell Inspiron 16 Plus 7630
Intel Core i7-13700H, NVIDIA GeForce RTX 4060 Laptop GPU
169.5 fps -4%
Acer Swift Edge SFE16 Ryzen 7 7840U
AMD Ryzen 7 7840U, AMD Radeon 780M
34.3 fps -81%
Lenovo Yoga 7 2-in-1 16IML9
Intel Core Ultra 5 125U, Intel Graphics 4-Cores iGPU (Arc)
29.9 fps -83%
1920x1080 Medium Preset (DX12)
Усредн. модель с NVIDIA GeForce RTX 4060 Laptop GPU
  (116 - 192.3, n=8)
158.8 fps +37%
Dell Inspiron 16 Plus 7630
Intel Core i7-13700H, NVIDIA GeForce RTX 4060 Laptop GPU
141.5 fps +22%
Framework Laptop 16
AMD Ryzen 9 7940HS, AMD Radeon RX 7700S
140.4 fps +21%
Dell Inspiron 16 Plus 7640
Intel Core Ultra 7 155H, NVIDIA GeForce RTX 4060 Laptop GPU
116 fps
Acer Swift Edge SFE16 Ryzen 7 7840U
AMD Ryzen 7 7840U, AMD Radeon 780M
28.4 fps -76%
Lenovo Yoga 7 2-in-1 16IML9
Intel Core Ultra 5 125U, Intel Graphics 4-Cores iGPU (Arc)
24 fps -79%
1920x1080 High Preset (DX12)
Усредн. модель с NVIDIA GeForce RTX 4060 Laptop GPU
  (86.6 - 121.2, n=9)
105.8 fps +15%
Dell Inspiron 16 Plus 7630
Intel Core i7-13700H, NVIDIA GeForce RTX 4060 Laptop GPU
92.1 fps 0%
Framework Laptop 16
AMD Ryzen 9 7940HS, AMD Radeon RX 7700S
92 fps 0%
Dell Inspiron 16 Plus 7640
Intel Core Ultra 7 155H, NVIDIA GeForce RTX 4060 Laptop GPU
91.9 fps
Acer Swift Edge SFE16 Ryzen 7 7840U
AMD Ryzen 7 7840U, AMD Radeon 780M
18.6 fps -80%
Lenovo Yoga 7 2-in-1 16IML9
Intel Core Ultra 5 125U, Intel Graphics 4-Cores iGPU (Arc)
16.1 fps -82%
1920x1080 Badass Preset (DX12)
Усредн. модель с NVIDIA GeForce RTX 4060 Laptop GPU
  (67.5 - 92.7, n=10)
82.2 fps +16%
Dell Inspiron 16 Plus 7630
Intel Core i7-13700H, NVIDIA GeForce RTX 4060 Laptop GPU
71.4 fps 0%
Framework Laptop 16
AMD Ryzen 9 7940HS, AMD Radeon RX 7700S
71.2 fps 0%
Dell Inspiron 16 Plus 7640
Intel Core Ultra 7 155H, NVIDIA GeForce RTX 4060 Laptop GPU
71.1 fps
Acer Swift Edge SFE16 Ryzen 7 7840U
AMD Ryzen 7 7840U, AMD Radeon 780M
16.5 fps -77%
Lenovo Yoga 7 2-in-1 16IML9
Intel Core Ultra 5 125U, Intel Graphics 4-Cores iGPU (Arc)
12.7 fps -82%
2560x1440 Badass Preset (DX12)
Усредн. модель с NVIDIA GeForce RTX 4060 Laptop GPU
  (45.3 - 64.2, n=8)
54.9 fps +14%
Dell Inspiron 16 Plus 7630
Intel Core i7-13700H, NVIDIA GeForce RTX 4060 Laptop GPU
48 fps 0%
Dell Inspiron 16 Plus 7640
Intel Core Ultra 7 155H, NVIDIA GeForce RTX 4060 Laptop GPU
48 fps
Framework Laptop 16
AMD Ryzen 9 7940HS, AMD Radeon RX 7700S
47.3 fps -1%
The Witcher 3
1366x768 Medium Graphics & Postprocessing
Усредн. модель с NVIDIA GeForce RTX 4060 Laptop GPU
  (176.4 - 369, n=27)
295 fps +7%
Framework Laptop 16
AMD Ryzen 9 7940HS, AMD Radeon RX 7700S
277.5 (216min) fps 0%
Dell Inspiron 16 Plus 7640
Intel Core Ultra 7 155H, NVIDIA GeForce RTX 4060 Laptop GPU
276.8 (262min) fps
Dell Inspiron 16 Plus 7630
Intel Core i7-13700H, NVIDIA GeForce RTX 4060 Laptop GPU
275.3 (249min) fps -1%
Acer Nitro 16 AN16-41-R7YE
AMD Ryzen 5 7535HS, NVIDIA GeForce RTX 4050 Laptop GPU
262.4 (229min) fps -5%
Asus VivoBook Pro 16 K6602VU
Intel Core i9-13900H, NVIDIA GeForce RTX 4050 Laptop GPU
258 (224min, 224.31P1) fps -7%
Lenovo Legion S7 16ARHA7
AMD Ryzen 9 6900HX, AMD Radeon RX 6800S
223 (223min) fps -19%
Dell Inspiron 16 Plus 7620
Intel Core i7-12700H, NVIDIA GeForce RTX 3050 Ti Laptop GPU
183 (168min) fps -34%
Lenovo Yoga 7 2-in-1 16IML9
Intel Core Ultra 5 125U, Intel Graphics 4-Cores iGPU (Arc)
49.6 (40min) fps -82%
1920x1080 High Graphics & Postprocessing (Nvidia HairWorks Off)
Lenovo Legion 5 16IRX G9
Intel Core i7-14650HX, NVIDIA GeForce RTX 4060 Laptop GPU
229 fps +43%
Acer Nitro 16 AN16-41
AMD Ryzen 7 7735HS, NVIDIA GeForce RTX 4070 Laptop GPU
213.3 (182min) fps +33%
Усредн. модель с NVIDIA GeForce RTX 4060 Laptop GPU
  (110 - 229, n=35)
185.2 fps +16%
Dell Inspiron 16 Plus 7630
Intel Core i7-13700H, NVIDIA GeForce RTX 4060 Laptop GPU
169.5 (158min) fps +6%
Lenovo Legion S7 16ARHA7
AMD Ryzen 9 6900HX, AMD Radeon RX 6800S
164 (156min) fps +2%
Dell Inspiron 16 Plus 7640
Intel Core Ultra 7 155H, NVIDIA GeForce RTX 4060 Laptop GPU
160.3 (154min) fps
Acer Nitro 16 AN16-41-R7YE
AMD Ryzen 5 7535HS, NVIDIA GeForce RTX 4050 Laptop GPU
156.2 (136min) fps -3%
Framework Laptop 16
AMD Ryzen 9 7940HS, AMD Radeon RX 7700S
147.1 (136min) fps -8%
Asus VivoBook Pro 16 K6602VU
Intel Core i9-13900H, NVIDIA GeForce RTX 4050 Laptop GPU
138.7 (123min, 123.66P1) fps -13%
Dell Inspiron 16 Plus 7620
Intel Core i7-12700H, NVIDIA GeForce RTX 3050 Ti Laptop GPU
108.4 (94min) fps -32%
Acer Swift Edge SFE16 Ryzen 7 7840U
AMD Ryzen 7 7840U, AMD Radeon 780M
36.1 (27min) fps -77%
Lenovo Yoga 7 2-in-1 16IML9
Intel Core Ultra 5 125U, Intel Graphics 4-Cores iGPU (Arc)
28.4 (25min) fps -82%
Lenovo ThinkPad E16 G1-21JUS08X00
AMD Ryzen 7 7730U, AMD Radeon RX Vega 8 (Ryzen 4000/5000)
20 fps -88%
Lenovo ThinkBook 16 G6 ABP
AMD Ryzen 5 7530U, AMD Radeon RX Vega 7
20 fps -88%
1920x1080 Ultra Graphics & Postprocessing (HBAO+)
Acer Nitro 16 AN16-41
AMD Ryzen 7 7735HS, NVIDIA GeForce RTX 4070 Laptop GPU
113.2 (98min) fps +35%
Усредн. модель с NVIDIA GeForce RTX 4060 Laptop GPU
  (77 - 159.7, n=41)
100.6 fps +20%
Lenovo Legion 5 16IRX G9
Intel Core i7-14650HX, NVIDIA GeForce RTX 4060 Laptop GPU
97.2 (93min, 94P1) fps +16%
Dell Inspiron 16 Plus 7630
Intel Core i7-13700H, NVIDIA GeForce RTX 4060 Laptop GPU
90.9 (85min) fps +8%
Lenovo Legion S7 16ARHA7
AMD Ryzen 9 6900HX, AMD Radeon RX 6800S
90.7 (86min) fps +8%
Dell Inspiron 16 Plus 7640
Intel Core Ultra 7 155H, NVIDIA GeForce RTX 4060 Laptop GPU
84.1 (80min) fps
Framework Laptop 16
AMD Ryzen 9 7940HS, AMD Radeon RX 7700S
84 (79min) fps 0%
Acer Nitro 16 AN16-41-R7YE
AMD Ryzen 5 7535HS, NVIDIA GeForce RTX 4050 Laptop GPU
83.9 (71min) fps 0%
Asus VivoBook Pro 16 K6602VU
Intel Core i9-13900H, NVIDIA GeForce RTX 4050 Laptop GPU
76.6 (69min, 69.34P1) fps -9%
Dell Inspiron 16 Plus 7620
Intel Core i7-12700H, NVIDIA GeForce RTX 3050 Ti Laptop GPU
57 (53min) fps -32%
Acer Swift Edge SFE16 Ryzen 7 7840U
AMD Ryzen 7 7840U, AMD Radeon 780M
20.4 (18min) fps -76%
Lenovo Yoga 7 2-in-1 16IML9
Intel Core Ultra 5 125U, Intel Graphics 4-Cores iGPU (Arc)
15 (11min) fps -82%
Lenovo ThinkPad E16 G1-21JUS08X00
AMD Ryzen 7 7730U, AMD Radeon RX Vega 8 (Ryzen 4000/5000)
12.9 (12min, 12P1) fps -85%
Lenovo ThinkBook 16 G6 ABP
AMD Ryzen 5 7530U, AMD Radeon RX Vega 7
12.9 (9min, 10P1) fps -85%
2560x1440 Ultra Graphics & Postprocessing (HBAO+)
Lenovo Legion 5 16IRX G9
Intel Core i7-14650HX, NVIDIA GeForce RTX 4060 Laptop GPU
83 fps +34%
Усредн. модель с NVIDIA GeForce RTX 4060 Laptop GPU
  (42.4 - 83.4, n=13)
72.5 fps +17%
Dell Inspiron 16 Plus 7630
Intel Core i7-13700H, NVIDIA GeForce RTX 4060 Laptop GPU
68 (65min) fps +10%
Dell Inspiron 16 Plus 7640
Intel Core Ultra 7 155H, NVIDIA GeForce RTX 4060 Laptop GPU
61.9 (58min) fps
Asus VivoBook Pro 16 K6602VU
Intel Core i9-13900H, NVIDIA GeForce RTX 4050 Laptop GPU
56.1 (50min, 50.33P1) fps -9%
Final Fantasy XV Benchmark
1920x1080 Standard Quality
Lenovo Legion 5 16IRX G9
Intel Core i7-14650HX, NVIDIA GeForce RTX 4060 Laptop GPU
154.2 fps +57%
Acer Nitro 16 AN16-41
AMD Ryzen 7 7735HS, NVIDIA GeForce RTX 4070 Laptop GPU
147.7 fps +50%
Усредн. модель с NVIDIA GeForce RTX 4060 Laptop GPU
  (98.4 - 161.2, n=32)
135 fps +37%
Dell Inspiron 16 Plus 7630
Intel Core i7-13700H, NVIDIA GeForce RTX 4060 Laptop GPU
122.2 fps +24%
Lenovo Legion S7 16ARHA7
AMD Ryzen 9 6900HX, AMD Radeon RX 6800S
120.1 fps +22%
Acer Nitro 16 AN16-41-R7YE
AMD Ryzen 5 7535HS, NVIDIA GeForce RTX 4050 Laptop GPU
116.2 fps +18%
Asus VivoBook Pro 16 K6602VU
Intel Core i9-13900H, NVIDIA GeForce RTX 4050 Laptop GPU
107.2 fps +9%
Framework Laptop 16
AMD Ryzen 9 7940HS, AMD Radeon RX 7700S
106 fps +8%
Dell Inspiron 16 Plus 7640
Intel Core Ultra 7 155H, NVIDIA GeForce RTX 4060 Laptop GPU
98.4 fps
Dell Inspiron 16 Plus 7620
Intel Core i7-12700H, NVIDIA GeForce RTX 3050 Ti Laptop GPU
77.7 fps -21%
Acer Swift Edge SFE16 Ryzen 7 7840U
AMD Ryzen 7 7840U, AMD Radeon 780M
27.4 fps -72%
Lenovo Yoga 7 2-in-1 16IML9
Intel Core Ultra 5 125U, Intel Graphics 4-Cores iGPU (Arc)
23 fps -77%
Lenovo ThinkPad E16 G1-21JUS08X00
AMD Ryzen 7 7730U, AMD Radeon RX Vega 8 (Ryzen 4000/5000)
17.1 fps -83%
Lenovo ThinkBook 16 G6 ABP
AMD Ryzen 5 7530U, AMD Radeon RX Vega 7
17 fps -83%
1920x1080 High Quality
Acer Nitro 16 AN16-41
AMD Ryzen 7 7735HS, NVIDIA GeForce RTX 4070 Laptop GPU
109.1 fps +38%
Lenovo Legion 5 16IRX G9
Intel Core i7-14650HX, NVIDIA GeForce RTX 4060 Laptop GPU
106.3 fps +35%
Усредн. модель с NVIDIA GeForce RTX 4060 Laptop GPU
  (75.1 - 109.8, n=36)
96.3 fps +22%
Dell Inspiron 16 Plus 7630
Intel Core i7-13700H, NVIDIA GeForce RTX 4060 Laptop GPU
88.9 fps +13%
Lenovo Legion S7 16ARHA7
AMD Ryzen 9 6900HX, AMD Radeon RX 6800S
87.6 fps +11%
Acer Nitro 16 AN16-41-R7YE
AMD Ryzen 5 7535HS, NVIDIA GeForce RTX 4050 Laptop GPU
83.5 fps +6%
Dell Inspiron 16 Plus 7640
Intel Core Ultra 7 155H, NVIDIA GeForce RTX 4060 Laptop GPU
78.8 fps
Asus VivoBook Pro 16 K6602VU
Intel Core i9-13900H, NVIDIA GeForce RTX 4050 Laptop GPU
75.6 fps -4%
Framework Laptop 16
AMD Ryzen 9 7940HS, AMD Radeon RX 7700S
74.8 fps -5%
Dell Inspiron 16 Plus 7620
Intel Core i7-12700H, NVIDIA GeForce RTX 3050 Ti Laptop GPU
54.1 fps -31%
Acer Swift Edge SFE16 Ryzen 7 7840U
AMD Ryzen 7 7840U, AMD Radeon 780M
21.2 fps -73%
Lenovo Yoga 7 2-in-1 16IML9
Intel Core Ultra 5 125U, Intel Graphics 4-Cores iGPU (Arc)
16.3 fps -79%
Lenovo ThinkPad E16 G1-21JUS08X00
AMD Ryzen 7 7730U, AMD Radeon RX Vega 8 (Ryzen 4000/5000)
12.4 fps -84%
Lenovo ThinkBook 16 G6 ABP
AMD Ryzen 5 7530U, AMD Radeon RX Vega 7
11.9 fps -85%
2560x1440 High Quality
Acer Nitro 16 AN16-41
AMD Ryzen 7 7735HS, NVIDIA GeForce RTX 4070 Laptop GPU
81.2 fps +38%
Lenovo Legion 5 16IRX G9
Intel Core i7-14650HX, NVIDIA GeForce RTX 4060 Laptop GPU
77.5 fps +32%
Усредн. модель с NVIDIA GeForce RTX 4060 Laptop GPU
  (56 - 79.4, n=26)
70.8 fps +20%
Dell Inspiron 16 Plus 7630
Intel Core i7-13700H, NVIDIA GeForce RTX 4060 Laptop GPU
64.4 fps +10%
Lenovo Legion S7 16ARHA7
AMD Ryzen 9 6900HX, AMD Radeon RX 6800S
62.1 fps +6%
Dell Inspiron 16 Plus 7640
Intel Core Ultra 7 155H, NVIDIA GeForce RTX 4060 Laptop GPU
58.8 fps
Framework Laptop 16
AMD Ryzen 9 7940HS, AMD Radeon RX 7700S
54.5 fps -7%
Asus VivoBook Pro 16 K6602VU
Intel Core i9-13900H, NVIDIA GeForce RTX 4050 Laptop GPU
53.6 fps -9%
Dell Inspiron 16 Plus 7620
Intel Core i7-12700H, NVIDIA GeForce RTX 3050 Ti Laptop GPU
38.1 fps -35%
Dota 2 Reborn
1280x720 min (0/3) fastest
Lenovo Legion 5 16IRX G9
Intel Core i7-14650HX, NVIDIA GeForce RTX 4060 Laptop GPU
209 (180.8min) fps +20%
Dell Inspiron 16 Plus 7630
Intel Core i7-13700H, NVIDIA GeForce RTX 4060 Laptop GPU
184.7 (161.7min) fps +6%
Усредн. модель с NVIDIA GeForce RTX 4060 Laptop GPU
  (146 - 232, n=36)
181.9 fps +5%
Framework Laptop 16
AMD Ryzen 9 7940HS, AMD Radeon RX 7700S
174 (148.3min) fps 0%
Dell Inspiron 16 Plus 7640
Intel Core Ultra 7 155H, NVIDIA GeForce RTX 4060 Laptop GPU
173.5 (150.9min) fps
Dell Inspiron 16 Plus 7620
Intel Core i7-12700H, NVIDIA GeForce RTX 3050 Ti Laptop GPU
171.8 (151.3min) fps -1%
Asus VivoBook Pro 16 K6602VU
Intel Core i9-13900H, NVIDIA GeForce RTX 4050 Laptop GPU
169.6 (146.3min) fps -2%
Acer Nitro 16 AN16-41-R7YE
AMD Ryzen 5 7535HS, NVIDIA GeForce RTX 4050 Laptop GPU
151 (132.6min) fps -13%
Lenovo Legion S7 16ARHA7
AMD Ryzen 9 6900HX, AMD Radeon RX 6800S
150 (126.8min) fps -14%
Acer Nitro 16 AN16-41
AMD Ryzen 7 7735HS, NVIDIA GeForce RTX 4070 Laptop GPU
137.7 (119.1min) fps -21%
Acer Swift Edge SFE16 Ryzen 7 7840U
AMD Ryzen 7 7840U, AMD Radeon 780M
128.1 (105.1min) fps -26%
Lenovo ThinkBook 16 G6 ABP
AMD Ryzen 5 7530U, AMD Radeon RX Vega 7
111.5 (91.2min) fps -36%
Lenovo ThinkPad E16 G1-21JUS08X00
AMD Ryzen 7 7730U, AMD Radeon RX Vega 8 (Ryzen 4000/5000)
107.8 (93.7min) fps -38%
Lenovo Yoga 7 2-in-1 16IML9
Intel Core Ultra 5 125U, Intel Graphics 4-Cores iGPU (Arc)
101.9 (62min) fps -41%
1366x768 med (1/3)
Lenovo Legion 5 16IRX G9
Intel Core i7-14650HX, NVIDIA GeForce RTX 4060 Laptop GPU
189.7 (166.8min) fps +25%
Dell Inspiron 16 Plus 7630
Intel Core i7-13700H, NVIDIA GeForce RTX 4060 Laptop GPU
166.6 (145.3min) fps +10%
Усредн. модель с NVIDIA GeForce RTX 4060 Laptop GPU
  (130 - 207, n=36)
164.5 fps +8%
Framework Laptop 16
AMD Ryzen 9 7940HS, AMD Radeon RX 7700S
159.8 (135.6min) fps +5%
Dell Inspiron 16 Plus 7620
Intel Core i7-12700H, NVIDIA GeForce RTX 3050 Ti Laptop GPU
157.5 (139.3min) fps +4%
Asus VivoBook Pro 16 K6602VU
Intel Core i9-13900H, NVIDIA GeForce RTX 4050 Laptop GPU
153.7 (135.6min) fps +1%
Dell Inspiron 16 Plus 7640
Intel Core Ultra 7 155H, NVIDIA GeForce RTX 4060 Laptop GPU
152.1 (133.4min) fps
Acer Nitro 16 AN16-41-R7YE
AMD Ryzen 5 7535HS, NVIDIA GeForce RTX 4050 Laptop GPU
136.5 (119.3min) fps -10%
Acer Nitro 16 AN16-41
AMD Ryzen 7 7735HS, NVIDIA GeForce RTX 4070 Laptop GPU
131.9 (113.4min) fps -13%
Lenovo Legion S7 16ARHA7
AMD Ryzen 9 6900HX, AMD Radeon RX 6800S
128.4 (109.4min) fps -16%
Acer Swift Edge SFE16 Ryzen 7 7840U
AMD Ryzen 7 7840U, AMD Radeon 780M
101.5 (86.7min) fps -33%
Lenovo ThinkBook 16 G6 ABP
AMD Ryzen 5 7530U, AMD Radeon RX Vega 7
87.8 (70.1min) fps -42%
Lenovo ThinkPad E16 G1-21JUS08X00
AMD Ryzen 7 7730U, AMD Radeon RX Vega 8 (Ryzen 4000/5000)
85.5 (72.3min) fps -44%
Lenovo Yoga 7 2-in-1 16IML9
Intel Core Ultra 5 125U, Intel Graphics 4-Cores iGPU (Arc)
60.7 (38.1min) fps -60%
1920x1080 high (2/3)
Lenovo Legion 5 16IRX G9
Intel Core i7-14650HX, NVIDIA GeForce RTX 4060 Laptop GPU
179.9 (157.8min) fps +26%
Dell Inspiron 16 Plus 7630
Intel Core i7-13700H, NVIDIA GeForce RTX 4060 Laptop GPU
157.9 (135min) fps +10%
Усредн. модель с NVIDIA GeForce RTX 4060 Laptop GPU
  (124 - 199, n=38)
156.8 fps +9%
Framework Laptop 16
AMD Ryzen 9 7940HS, AMD Radeon RX 7700S
156.5 (129.7min) fps +9%
Dell Inspiron 16 Plus 7620
Intel Core i7-12700H, NVIDIA GeForce RTX 3050 Ti Laptop GPU
148 (128.8min) fps +3%
Dell Inspiron 16 Plus 7640
Intel Core Ultra 7 155H, NVIDIA GeForce RTX 4060 Laptop GPU
143.2 (112.1min) fps
Asus VivoBook Pro 16 K6602VU
Intel Core i9-13900H, NVIDIA GeForce RTX 4050 Laptop GPU
140.1 (117.9min) fps -2%
Lenovo Legion S7 16ARHA7
AMD Ryzen 9 6900HX, AMD Radeon RX 6800S
134.7 (97.6min) fps -6%
Acer Nitro 16 AN16-41-R7YE
AMD Ryzen 5 7535HS, NVIDIA GeForce RTX 4050 Laptop GPU
132.1 (115.6min) fps -8%
Acer Nitro 16 AN16-41
AMD Ryzen 7 7735HS, NVIDIA GeForce RTX 4070 Laptop GPU
118.9 (102.5min) fps -17%
Acer Swift Edge SFE16 Ryzen 7 7840U
AMD Ryzen 7 7840U, AMD Radeon 780M
66.8 (55.4min) fps -53%
Lenovo Yoga 7 2-in-1 16IML9
Intel Core Ultra 5 125U, Intel Graphics 4-Cores iGPU (Arc)
61.1 (37.9min) fps -57%
Lenovo ThinkPad E16 G1-21JUS08X00
AMD Ryzen 7 7730U, AMD Radeon RX Vega 8 (Ryzen 4000/5000)
50.7 (46.3min) fps -65%
Lenovo ThinkBook 16 G6 ABP
AMD Ryzen 5 7530U, AMD Radeon RX Vega 7
49.1 (45.3min) fps -66%
1920x1080 ultra (3/3) best looking
Lenovo Legion 5 16IRX G9
Intel Core i7-14650HX, NVIDIA GeForce RTX 4060 Laptop GPU
168.7 (146.8min) fps +25%
Усредн. модель с NVIDIA GeForce RTX 4060 Laptop GPU
  (115 - 183.8, n=38)
146.2 fps +8%
Dell Inspiron 16 Plus 7630
Intel Core i7-13700H, NVIDIA GeForce RTX 4060 Laptop GPU
146.1 (126.2min) fps +8%
Dell Inspiron 16 Plus 7620
Intel Core i7-12700H, NVIDIA GeForce RTX 3050 Ti Laptop GPU
140.7 (122.6min) fps +4%
Framework Laptop 16
AMD Ryzen 9 7940HS, AMD Radeon RX 7700S
136.8 (116min) fps +1%
Dell Inspiron 16 Plus 7640
Intel Core Ultra 7 155H, NVIDIA GeForce RTX 4060 Laptop GPU
135.1 (116.3min) fps
Asus VivoBook Pro 16 K6602VU
Intel Core i9-13900H, NVIDIA GeForce RTX 4050 Laptop GPU
126 (107.9min) fps -7%
Acer Nitro 16 AN16-41-R7YE
AMD Ryzen 5 7535HS, NVIDIA GeForce RTX 4050 Laptop GPU
125.2 (109.9min) fps -7%
Acer Nitro 16 AN16-41
AMD Ryzen 7 7735HS, NVIDIA GeForce RTX 4070 Laptop GPU
114.8 (97.8min) fps -15%
Lenovo Legion S7 16ARHA7
AMD Ryzen 9 6900HX, AMD Radeon RX 6800S
99.4 (82.9min) fps -26%
Acer Swift Edge SFE16 Ryzen 7 7840U
AMD Ryzen 7 7840U, AMD Radeon 780M
61.4 (52min) fps -55%
Lenovo Yoga 7 2-in-1 16IML9
Intel Core Ultra 5 125U, Intel Graphics 4-Cores iGPU (Arc)
57.6 (37.5min) fps -57%
Lenovo ThinkPad E16 G1-21JUS08X00
AMD Ryzen 7 7730U, AMD Radeon RX Vega 8 (Ryzen 4000/5000)
47.7 (43.2min) fps -65%
Lenovo ThinkBook 16 G6 ABP
AMD Ryzen 5 7530U, AMD Radeon RX Vega 7
45.8 (42.7min) fps -66%
X-Plane 11.11
1280x720 low (fps_test=1)
Lenovo Legion 5 16IRX G9
Intel Core i7-14650HX, NVIDIA GeForce RTX 4060 Laptop GPU
180.8 fps +46%
Asus VivoBook Pro 16 K6602VU
Intel Core i9-13900H, NVIDIA GeForce RTX 4050 Laptop GPU
159.2 fps +29%
Dell Inspiron 16 Plus 7630
Intel Core i7-13700H, NVIDIA GeForce RTX 4060 Laptop GPU
153.5 fps +24%
Усредн. модель с NVIDIA GeForce RTX 4060 Laptop GPU
  (110.1 - 209, n=37)
152.5 fps +23%
Dell Inspiron 16 Plus 7620
Intel Core i7-12700H, NVIDIA GeForce RTX 3050 Ti Laptop GPU
132.5 fps +7%
Dell Inspiron 16 Plus 7640
Intel Core Ultra 7 155H, NVIDIA GeForce RTX 4060 Laptop GPU
123.7 fps
Acer Nitro 16 AN16-41-R7YE
AMD Ryzen 5 7535HS, NVIDIA GeForce RTX 4050 Laptop GPU
115.3 fps -7%
Acer Nitro 16 AN16-41
AMD Ryzen 7 7735HS, NVIDIA GeForce RTX 4070 Laptop GPU
107 fps -14%
Framework Laptop 16
AMD Ryzen 9 7940HS, AMD Radeon RX 7700S
97.6 fps -21%
Lenovo Legion S7 16ARHA7
AMD Ryzen 9 6900HX, AMD Radeon RX 6800S
75.2 fps -39%
Acer Swift Edge SFE16 Ryzen 7 7840U
AMD Ryzen 7 7840U, AMD Radeon 780M
49.1 fps -60%
Lenovo ThinkPad E16 G1-21JUS08X00
AMD Ryzen 7 7730U, AMD Radeon RX Vega 8 (Ryzen 4000/5000)
40.9 fps -67%
Lenovo ThinkBook 16 G6 ABP
AMD Ryzen 5 7530U, AMD Radeon RX Vega 7
37.5 fps -70%
Lenovo Yoga 7 2-in-1 16IML9
Intel Core Ultra 5 125U, Intel Graphics 4-Cores iGPU (Arc)
36.5 fps -70%
1920x1080 med (fps_test=2)
Lenovo Legion 5 16IRX G9
Intel Core i7-14650HX, NVIDIA GeForce RTX 4060 Laptop GPU
171 fps +57%
Dell Inspiron 16 Plus 7630
Intel Core i7-13700H, NVIDIA GeForce RTX 4060 Laptop GPU
135.7 fps +24%
Asus VivoBook Pro 16 K6602VU
Intel Core i9-13900H, NVIDIA GeForce RTX 4050 Laptop GPU
134.6 fps +23%
Усредн. модель с NVIDIA GeForce RTX 4060 Laptop GPU
  (102.2 - 184, n=37)
133.7 fps +23%
Dell Inspiron 16 Plus 7620
Intel Core i7-12700H, NVIDIA GeForce RTX 3050 Ti Laptop GPU
115.6 fps +6%
Dell Inspiron 16 Plus 7640
Intel Core Ultra 7 155H, NVIDIA GeForce RTX 4060 Laptop GPU
109 fps
Acer Nitro 16 AN16-41-R7YE
AMD Ryzen 5 7535HS, NVIDIA GeForce RTX 4050 Laptop GPU
101.6 fps -7%
Acer Nitro 16 AN16-41
AMD Ryzen 7 7735HS, NVIDIA GeForce RTX 4070 Laptop GPU
94.2 fps -14%
Framework Laptop 16
AMD Ryzen 9 7940HS, AMD Radeon RX 7700S
79.3 fps -27%
Lenovo Legion S7 16ARHA7
AMD Ryzen 9 6900HX, AMD Radeon RX 6800S
61.5 fps -44%
Acer Swift Edge SFE16 Ryzen 7 7840U
AMD Ryzen 7 7840U, AMD Radeon 780M
37 fps -66%
Lenovo ThinkPad E16 G1-21JUS08X00
AMD Ryzen 7 7730U, AMD Radeon RX Vega 8 (Ryzen 4000/5000)
31.4 fps -71%
Lenovo ThinkBook 16 G6 ABP
AMD Ryzen 5 7530U, AMD Radeon RX Vega 7
30 fps -72%
Lenovo Yoga 7 2-in-1 16IML9
Intel Core Ultra 5 125U, Intel Graphics 4-Cores iGPU (Arc)
28 fps -74%
1920x1080 high (fps_test=3)
Lenovo Legion 5 16IRX G9
Intel Core i7-14650HX, NVIDIA GeForce RTX 4060 Laptop GPU
130.9 fps +51%
Dell Inspiron 16 Plus 7630
Intel Core i7-13700H, NVIDIA GeForce RTX 4060 Laptop GPU
109.7 fps +27%
Asus VivoBook Pro 16 K6602VU
Intel Core i9-13900H, NVIDIA GeForce RTX 4050 Laptop GPU
108.4 fps +25%
Усредн. модель с NVIDIA GeForce RTX 4060 Laptop GPU
  (79.5 - 141.1, n=39)
105.1 fps +22%
Dell Inspiron 16 Plus 7620
Intel Core i7-12700H, NVIDIA GeForce RTX 3050 Ti Laptop GPU
92.8 fps +7%
Dell Inspiron 16 Plus 7640
Intel Core Ultra 7 155H, NVIDIA GeForce RTX 4060 Laptop GPU
86.5 fps
Acer Nitro 16 AN16-41-R7YE
AMD Ryzen 5 7535HS, NVIDIA GeForce RTX 4050 Laptop GPU
81.4 fps -6%
Acer Nitro 16 AN16-41
AMD Ryzen 7 7735HS, NVIDIA GeForce RTX 4070 Laptop GPU
76.3 fps -12%
Framework Laptop 16
AMD Ryzen 9 7940HS, AMD Radeon RX 7700S
65 fps -25%
Lenovo Legion S7 16ARHA7
AMD Ryzen 9 6900HX, AMD Radeon RX 6800S
52.3 fps -40%
Acer Swift Edge SFE16 Ryzen 7 7840U
AMD Ryzen 7 7840U, AMD Radeon 780M
30.3 fps -65%
Lenovo ThinkPad E16 G1-21JUS08X00
AMD Ryzen 7 7730U, AMD Radeon RX Vega 8 (Ryzen 4000/5000)
27.8 fps -68%
Lenovo ThinkBook 16 G6 ABP
AMD Ryzen 5 7530U, AMD Radeon RX Vega 7
26.2 fps -70%
Lenovo Yoga 7 2-in-1 16IML9
Intel Core Ultra 5 125U, Intel Graphics 4-Cores iGPU (Arc)
23.4 fps -73%
Far Cry 5
1920x1080 Medium Preset AA:T
Lenovo Legion 5 16IRX G9
Intel Core i7-14650HX, NVIDIA GeForce RTX 4060 Laptop GPU
161 fps +29%
Усредн. модель с NVIDIA GeForce RTX 4060 Laptop GPU
  (110 - 165, n=24)
136.6 fps +9%
Framework Laptop 16
AMD Ryzen 9 7940HS, AMD Radeon RX 7700S
130 (108min) fps +4%
Dell Inspiron 16 Plus 7640
Intel Core Ultra 7 155H, NVIDIA GeForce RTX 4060 Laptop GPU
125 (94min) fps
Acer Nitro 16 AN16-41
AMD Ryzen 7 7735HS, NVIDIA GeForce RTX 4070 Laptop GPU
120 (90min) fps -4%
Dell Inspiron 16 Plus 7630
Intel Core i7-13700H, NVIDIA GeForce RTX 4060 Laptop GPU
120 (89min) fps -4%
Acer Nitro 16 AN16-41-R7YE
AMD Ryzen 5 7535HS, NVIDIA GeForce RTX 4050 Laptop GPU
114 (89min) fps -9%
Asus VivoBook Pro 16 K6602VU
Intel Core i9-13900H, NVIDIA GeForce RTX 4050 Laptop GPU
114 (80min) fps -9%
Acer Swift Edge SFE16 Ryzen 7 7840U
AMD Ryzen 7 7840U, AMD Radeon 780M
28 (6min) fps -78%
Lenovo Yoga 7 2-in-1 16IML9
Intel Core Ultra 5 125U, Intel Graphics 4-Cores iGPU (Arc)
25 (17min) fps -80%
Lenovo ThinkPad E16 G1-21JUS08X00
AMD Ryzen 7 7730U, AMD Radeon RX Vega 8 (Ryzen 4000/5000)
21 fps -83%
Lenovo ThinkBook 16 G6 ABP
AMD Ryzen 5 7530U, AMD Radeon RX Vega 7
20 fps -84%
1920x1080 High Preset AA:T
Lenovo Legion 5 16IRX G9
Intel Core i7-14650HX, NVIDIA GeForce RTX 4060 Laptop GPU
155 fps +31%
Усредн. модель с NVIDIA GeForce RTX 4060 Laptop GPU
  (104 - 158, n=27)
130.9 fps +11%
Framework Laptop 16
AMD Ryzen 9 7940HS, AMD Radeon RX 7700S
123 (106min) fps +4%
Dell Inspiron 16 Plus 7640
Intel Core Ultra 7 155H, NVIDIA GeForce RTX 4060 Laptop GPU
118 (88min) fps
Acer Nitro 16 AN16-41
AMD Ryzen 7 7735HS, NVIDIA GeForce RTX 4070 Laptop GPU
116 (88min) fps -2%
Dell Inspiron 16 Plus 7630
Intel Core i7-13700H, NVIDIA GeForce RTX 4060 Laptop GPU
115 (74min) fps -3%
Acer Nitro 16 AN16-41-R7YE
AMD Ryzen 5 7535HS, NVIDIA GeForce RTX 4050 Laptop GPU
108 (82min) fps -8%
Asus VivoBook Pro 16 K6602VU
Intel Core i9-13900H, NVIDIA GeForce RTX 4050 Laptop GPU
107 (69min) fps -9%
Acer Swift Edge SFE16 Ryzen 7 7840U
AMD Ryzen 7 7840U, AMD Radeon 780M
26 (16min) fps -78%
Lenovo Yoga 7 2-in-1 16IML9
Intel Core Ultra 5 125U, Intel Graphics 4-Cores iGPU (Arc)
25 (22min) fps -79%
Lenovo ThinkBook 16 G6 ABP
AMD Ryzen 5 7530U, AMD Radeon RX Vega 7
19 fps -84%
Lenovo ThinkPad E16 G1-21JUS08X00
AMD Ryzen 7 7730U, AMD Radeon RX Vega 8 (Ryzen 4000/5000)
18 fps -85%
1920x1080 Ultra Preset AA:T
Lenovo Legion 5 16IRX G9
Intel Core i7-14650HX, NVIDIA GeForce RTX 4060 Laptop GPU
147 fps +34%
Усредн. модель с NVIDIA GeForce RTX 4060 Laptop GPU
  (95 - 148, n=28)
123.3 fps +12%
Framework Laptop 16
AMD Ryzen 9 7940HS, AMD Radeon RX 7700S
117 (96min) fps +6%
Dell Inspiron 16 Plus 7640
Intel Core Ultra 7 155H, NVIDIA GeForce RTX 4060 Laptop GPU
110 (81min) fps
Acer Nitro 16 AN16-41
AMD Ryzen 7 7735HS, NVIDIA GeForce RTX 4070 Laptop GPU
109 (81min) fps -1%
Asus VivoBook Pro 16 K6602VU
Intel Core i9-13900H, NVIDIA GeForce RTX 4050 Laptop GPU
104 (73min) fps -5%
Dell Inspiron 16 Plus 7630
Intel Core i7-13700H, NVIDIA GeForce RTX 4060 Laptop GPU
103 (74min) fps -6%
Acer Nitro 16 AN16-41-R7YE
AMD Ryzen 5 7535HS, NVIDIA GeForce RTX 4050 Laptop GPU
102 (70min) fps -7%
Acer Swift Edge SFE16 Ryzen 7 7840U
AMD Ryzen 7 7840U, AMD Radeon 780M
24 (22min) fps -78%
Lenovo Yoga 7 2-in-1 16IML9
Intel Core Ultra 5 125U, Intel Graphics 4-Cores iGPU (Arc)
23 (20min) fps -79%
Lenovo ThinkBook 16 G6 ABP
AMD Ryzen 5 7530U, AMD Radeon RX Vega 7
18 fps -84%
Lenovo ThinkPad E16 G1-21JUS08X00
AMD Ryzen 7 7730U, AMD Radeon RX Vega 8 (Ryzen 4000/5000)
17 fps -85%
2560x1440 Ultra Preset AA:T
Lenovo Legion 5 16IRX G9
Intel Core i7-14650HX, NVIDIA GeForce RTX 4060 Laptop GPU
111 fps +34%
Acer Nitro 16 AN16-41
AMD Ryzen 7 7735HS, NVIDIA GeForce RTX 4070 Laptop GPU
102 (78min) fps +23%
Усредн. модель с NVIDIA GeForce RTX 4060 Laptop GPU
  (71 - 111, n=21)
95 fps +14%
Dell Inspiron 16 Plus 7630
Intel Core i7-13700H, NVIDIA GeForce RTX 4060 Laptop GPU
83 (74min) fps 0%
Dell Inspiron 16 Plus 7640
Intel Core Ultra 7 155H, NVIDIA GeForce RTX 4060 Laptop GPU
83 (72min) fps
Framework Laptop 16
AMD Ryzen 9 7940HS, AMD Radeon RX 7700S
81 (65min) fps -2%
Asus VivoBook Pro 16 K6602VU
Intel Core i9-13900H, NVIDIA GeForce RTX 4050 Laptop GPU
68 (31min) fps -18%
Strange Brigade
1920x1080 medium AA:medium AF:4
Acer Nitro 16 AN16-41
AMD Ryzen 7 7735HS, NVIDIA GeForce RTX 4070 Laptop GPU
273 (146.3min, 211P1) fps +21%
Усредн. модель с NVIDIA GeForce RTX 4060 Laptop GPU
  (195.4 - 305, n=32)
261 fps +16%
Lenovo Legion S7 16ARHA7
AMD Ryzen 9 6900HX, AMD Radeon RX 6800S
243 (172.7min, 208P1) fps +8%
Dell Inspiron 16 Plus 7630
Intel Core i7-13700H, NVIDIA GeForce RTX 4060 Laptop GPU
234 (137.3min, 187.4P1) fps +4%
Dell Inspiron 16 Plus 7640
Intel Core Ultra 7 155H, NVIDIA GeForce RTX 4060 Laptop GPU
225 (62.5min, 186.2P1) fps
Acer Nitro 16 AN16-41-R7YE
AMD Ryzen 5 7535HS, NVIDIA GeForce RTX 4050 Laptop GPU
209 (108.8min, 180.4P1) fps -7%
Framework Laptop 16
AMD Ryzen 9 7940HS, AMD Radeon RX 7700S
202 (102.7min, 166.3P1) fps -10%
Asus VivoBook Pro 16 K6602VU
Intel Core i9-13900H, NVIDIA GeForce RTX 4050 Laptop GPU
187.4 (68.1min, 163.7P1) fps -17%
Dell Inspiron 16 Plus 7620
Intel Core i7-12700H, NVIDIA GeForce RTX 3050 Ti Laptop GPU
138.3 (84.4min, 116.2P1) fps -39%
Acer Swift Edge SFE16 Ryzen 7 7840U
AMD Ryzen 7 7840U, AMD Radeon 780M
60.6 (11.7min, 51.7P1) fps -73%
Lenovo Yoga 7 2-in-1 16IML9
Intel Core Ultra 5 125U, Intel Graphics 4-Cores iGPU (Arc)
50 (24.3min, 41.3P1) fps -78%
Lenovo ThinkBook 16 G6 ABP
AMD Ryzen 5 7530U, AMD Radeon RX Vega 7
29.7 (24.7min, 25.9P1) fps -87%
Lenovo ThinkPad E16 G1-21JUS08X00
AMD Ryzen 7 7730U, AMD Radeon RX Vega 8 (Ryzen 4000/5000)
29.3 (22.1min, 26P1) fps -87%
1920x1080 high AA:high AF:8
Lenovo Legion 5 16IRX G9
Intel Core i7-14650HX, NVIDIA GeForce RTX 4060 Laptop GPU
243 fps +36%
Acer Nitro 16 AN16-41
AMD Ryzen 7 7735HS, NVIDIA GeForce RTX 4070 Laptop GPU
221 (35.6min, 162.5P1) fps +24%
Усредн. модель с NVIDIA GeForce RTX 4060 Laptop GPU
  (156.1 - 243, n=36)
209 fps +17%
Lenovo Legion S7 16ARHA7
AMD Ryzen 9 6900HX, AMD Radeon RX 6800S
195.7 (90.9min, 141.8P1) fps +10%
Dell Inspiron 16 Plus 7630
Intel Core i7-13700H, NVIDIA GeForce RTX 4060 Laptop GPU
185.9 (60.8min, 136.8P1) fps +4%
Dell Inspiron 16 Plus 7640
Intel Core Ultra 7 155H, NVIDIA GeForce RTX 4060 Laptop GPU
178.1 (44.1min, 131.8P1) fps
Acer Nitro 16 AN16-41-R7YE
AMD Ryzen 5 7535HS, NVIDIA GeForce RTX 4050 Laptop GPU
169.3 (91.4min, 130.3P1) fps -5%
Framework Laptop 16
AMD Ryzen 9 7940HS, AMD Radeon RX 7700S
167.4 (88.3min, 121P1) fps -6%
Asus VivoBook Pro 16 K6602VU
Intel Core i9-13900H, NVIDIA GeForce RTX 4050 Laptop GPU
151.6 (21.1min, 116.6P1) fps -15%
Dell Inspiron 16 Plus 7620
Intel Core i7-12700H, NVIDIA GeForce RTX 3050 Ti Laptop GPU
110.2 (76.2min, 84.7P1) fps -38%
Acer Swift Edge SFE16 Ryzen 7 7840U
AMD Ryzen 7 7840U, AMD Radeon 780M
49.5 (8min, 13.9P1) fps -72%
Lenovo Yoga 7 2-in-1 16IML9
Intel Core Ultra 5 125U, Intel Graphics 4-Cores iGPU (Arc)
39.2 (10min, 24P1) fps -78%
Lenovo ThinkPad E16 G1-21JUS08X00
AMD Ryzen 7 7730U, AMD Radeon RX Vega 8 (Ryzen 4000/5000)
24.5 (5.8min, 8.47P1) fps -86%
Lenovo ThinkBook 16 G6 ABP
AMD Ryzen 5 7530U, AMD Radeon RX Vega 7
24.5 (18.1min, 19.1P1) fps -86%
1920x1080 ultra AA:ultra AF:16
Lenovo Legion 5 16IRX G9
Intel Core i7-14650HX, NVIDIA GeForce RTX 4060 Laptop GPU
210 fps +37%
Acer Nitro 16 AN16-41
AMD Ryzen 7 7735HS, NVIDIA GeForce RTX 4070 Laptop GPU
192.6 (25.1min, 144.3P1) fps +25%
Усредн. модель с NVIDIA GeForce RTX 4060 Laptop GPU
  (135.3 - 210, n=37)
180.2 fps +17%
Lenovo Legion S7 16ARHA7
AMD Ryzen 9 6900HX, AMD Radeon RX 6800S
171.1 (119.3min, 125.3P1) fps +11%
Dell Inspiron 16 Plus 7630
Intel Core i7-13700H, NVIDIA GeForce RTX 4060 Laptop GPU
161 (79.8min, 120.7P1) fps +5%
Dell Inspiron 16 Plus 7640
Intel Core Ultra 7 155H, NVIDIA GeForce RTX 4060 Laptop GPU
153.5 (48min, 114.7P1) fps
Acer Nitro 16 AN16-41-R7YE
AMD Ryzen 5 7535HS, NVIDIA GeForce RTX 4050 Laptop GPU
146.8 (93.6min, 114.3P1) fps -4%
Framework Laptop 16
AMD Ryzen 9 7940HS, AMD Radeon RX 7700S
143.9 (84.9min, 104.3P1) fps -6%
Asus VivoBook Pro 16 K6602VU
Intel Core i9-13900H, NVIDIA GeForce RTX 4050 Laptop GPU
132 (22.5min, 102.9P1) fps -14%
Dell Inspiron 16 Plus 7620
Intel Core i7-12700H, NVIDIA GeForce RTX 3050 Ti Laptop GPU
95.2 (68.1min, 72.5P1) fps -38%
Acer Swift Edge SFE16 Ryzen 7 7840U
AMD Ryzen 7 7840U, AMD Radeon 780M
41.3 (7.5min, 9.37P1) fps -73%
Lenovo Yoga 7 2-in-1 16IML9
Intel Core Ultra 5 125U, Intel Graphics 4-Cores iGPU (Arc)
30.2 (7.6min, 10.6P1) fps -80%
Lenovo ThinkPad E16 G1-21JUS08X00
AMD Ryzen 7 7730U, AMD Radeon RX Vega 8 (Ryzen 4000/5000)
20.9 (5.1min, 6.57P1) fps -86%
Lenovo ThinkBook 16 G6 ABP
AMD Ryzen 5 7530U, AMD Radeon RX Vega 7
20.6 (7.3min, 9.63P1) fps -87%
2560x1440 ultra AA:ultra AF:16
Lenovo Legion 5 16IRX G9
Intel Core i7-14650HX, NVIDIA GeForce RTX 4060 Laptop GPU
130 fps +24%
Acer Nitro 16 AN16-41
AMD Ryzen 7 7735HS, NVIDIA GeForce RTX 4070 Laptop GPU
129 (62.9min, 106.6P1) fps +23%
Усредн. модель с NVIDIA GeForce RTX 4060 Laptop GPU
  (102 - 136.3, n=22)
122.6 fps +17%
Lenovo Legion S7 16ARHA7
AMD Ryzen 9 6900HX, AMD Radeon RX 6800S
111.4 (85.9min, 89.9P1) fps +6%
Dell Inspiron 16 Plus 7630
Intel Core i7-13700H, NVIDIA GeForce RTX 4060 Laptop GPU
110.9 (68.7min, 89.9P1) fps +5%
Dell Inspiron 16 Plus 7640
Intel Core Ultra 7 155H, NVIDIA GeForce RTX 4060 Laptop GPU
105.2 (52.2min, 85.3P1) fps
Framework Laptop 16
AMD Ryzen 9 7940HS, AMD Radeon RX 7700S
91.9 (66min, 75.1P1) fps -13%
Dell Inspiron 16 Plus 7620
Intel Core i7-12700H, NVIDIA GeForce RTX 3050 Ti Laptop GPU
69.1 (51.2min, 55.5P1) fps -34%
F1 22
1920x1080 Low Preset AA:T AF:16x
Lenovo Legion 5 16IRX G9
Intel Core i7-14650HX, NVIDIA GeForce RTX 4060 Laptop GPU
296 (217min, 162P1) fps +50%
Framework Laptop 16
AMD Ryzen 9 7940HS, AMD Radeon RX 7700S
251 (206min, 170P1) fps +27%
Acer Nitro 16 AN16-41-R7YE
AMD Ryzen 5 7535HS, NVIDIA GeForce RTX 4050 Laptop GPU
237 (178min, 148P1) fps +20%
Acer Nitro 16 AN16-41-R7YE
AMD Ryzen 5 7535HS, NVIDIA GeForce RTX 4050 Laptop GPU
207 (152min, 121P1) fps +5%
Усредн. модель с NVIDIA GeForce RTX 4060 Laptop GPU
  (169.8 - 296, n=20)
232 fps +18%
Acer Nitro 16 AN16-41
AMD Ryzen 7 7735HS, NVIDIA GeForce RTX 4070 Laptop GPU
225 (166min, 138P1) fps +14%
Dell Inspiron 16 Plus 7630
Intel Core i7-13700H, NVIDIA GeForce RTX 4060 Laptop GPU
205 (156min, 114P1) fps +4%
Dell Inspiron 16 Plus 7640
Intel Core Ultra 7 155H, NVIDIA GeForce RTX 4060 Laptop GPU
197 (138min, 114P1) fps
Asus VivoBook Pro 16 K6602VU
Intel Core i9-13900H, NVIDIA GeForce RTX 4050 Laptop GPU
182.4 (97min, 86P1) fps -7%
Acer Swift Edge SFE16 Ryzen 7 7840U
AMD Ryzen 7 7840U, AMD Radeon 780M
65.4 (52min, 37P1) fps -67%
Lenovo Yoga 7 2-in-1 16IML9
Intel Core Ultra 5 125U, Intel Graphics 4-Cores iGPU (Arc)
41.7 (34min, 33P1) fps -79%
Lenovo ThinkBook 16 G6 ABP
AMD Ryzen 5 7530U, AMD Radeon RX Vega 7
33.8 (28min, 26P1) fps -83%
Lenovo ThinkPad E16 G1-21JUS08X00
AMD Ryzen 7 7730U, AMD Radeon RX Vega 8 (Ryzen 4000/5000)
33.7 (25min, 25P1) fps -83%
1920x1080 Medium Preset AA:T AF:16x
Lenovo Legion 5 16IRX G9
Intel Core i7-14650HX, NVIDIA GeForce RTX 4060 Laptop GPU
287 (232min, 168P1) fps +56%
Усредн. модель с NVIDIA GeForce RTX 4060 Laptop GPU
  (162.3 - 287, n=20)
223 fps +21%
Acer Nitro 16 AN16-41
AMD Ryzen 7 7735HS, NVIDIA GeForce RTX 4070 Laptop GPU
222 (172min, 141P1) fps +20%
Framework Laptop 16
AMD Ryzen 9 7940HS, AMD Radeon RX 7700S
221 (193min, 157P1) fps +20%
Dell Inspiron 16 Plus 7630
Intel Core i7-13700H, NVIDIA GeForce RTX 4060 Laptop GPU
201 (162min, 111P1) fps +9%
Acer Nitro 16 AN16-41-R7YE
AMD Ryzen 5 7535HS, NVIDIA GeForce RTX 4050 Laptop GPU
198.1 (152min, 123P1) fps +7%
Asus VivoBook Pro 16 K6602VU
Intel Core i9-13900H, NVIDIA GeForce RTX 4050 Laptop GPU
193.1 (139min, 105P1) fps +5%
Dell Inspiron 16 Plus 7640
Intel Core Ultra 7 155H, NVIDIA GeForce RTX 4060 Laptop GPU
184.3 (102min, 90P1) fps
Acer Swift Edge SFE16 Ryzen 7 7840U
AMD Ryzen 7 7840U, AMD Radeon 780M
62.1 (47min, 37P1) fps -66%
Lenovo Yoga 7 2-in-1 16IML9
Intel Core Ultra 5 125U, Intel Graphics 4-Cores iGPU (Arc)
39.7 (33min, 32P1) fps -78%
Lenovo ThinkPad E16 G1-21JUS08X00
AMD Ryzen 7 7730U, AMD Radeon RX Vega 8 (Ryzen 4000/5000)
30.1 (24min, 21P1) fps -84%
Lenovo ThinkBook 16 G6 ABP
AMD Ryzen 5 7530U, AMD Radeon RX Vega 7
29.3 (23min, 22P1) fps -84%
1920x1080 High Preset AA:T AF:16x
Lenovo Legion 5 16IRX G9
Intel Core i7-14650HX, NVIDIA GeForce RTX 4060 Laptop GPU
217 (187min, 135P1) fps +43%
Acer Nitro 16 AN16-41
AMD Ryzen 7 7735HS, NVIDIA GeForce RTX 4070 Laptop GPU
205 (164min, 128P1) fps +35%
Усредн. модель с NVIDIA GeForce RTX 4060 Laptop GPU
  (124.7 - 217, n=22)
172.9 fps +14%
Framework Laptop 16
AMD Ryzen 9 7940HS, AMD Radeon RX 7700S
168 (142min, 123P1) fps +11%
Acer Nitro 16 AN16-41-R7YE
AMD Ryzen 5 7535HS, NVIDIA GeForce RTX 4050 Laptop GPU
166.8 (144min, 110P1) fps +10%
Asus VivoBook Pro 16 K6602VU
Intel Core i9-13900H, NVIDIA GeForce RTX 4050 Laptop GPU
152.1 (101min, 92P1) fps +1%
Dell Inspiron 16 Plus 7640
Intel Core Ultra 7 155H, NVIDIA GeForce RTX 4060 Laptop GPU
151.3 (101min, 89P1) fps
Dell Inspiron 16 Plus 7630
Intel Core i7-13700H, NVIDIA GeForce RTX 4060 Laptop GPU
148.4 (129min, 89P1) fps -2%
Acer Swift Edge SFE16 Ryzen 7 7840U
AMD Ryzen 7 7840U, AMD Radeon 780M
42.6 (31min, 27P1) fps -72%
Lenovo ThinkPad E16 G1-21JUS08X00
AMD Ryzen 7 7730U, AMD Radeon RX Vega 8 (Ryzen 4000/5000)
22.5 (16min, 14P1) fps -85%
Lenovo ThinkBook 16 G6 ABP
AMD Ryzen 5 7530U, AMD Radeon RX Vega 7
21.9 (13min, 13P1) fps -86%
1920x1080 Ultra High Preset AA:T AF:16x
Acer Nitro 16 AN16-41
AMD Ryzen 7 7735HS, NVIDIA GeForce RTX 4070 Laptop GPU
79.3 (66min, 59P1) fps +53%
Lenovo Legion 5 16IRX G9
Intel Core i7-14650HX, NVIDIA GeForce RTX 4060 Laptop GPU
71.4 (61min, 56P1) fps +38%
Усредн. модель с NVIDIA GeForce RTX 4060 Laptop GPU
  (48.7 - 71.4, n=22)
60.7 fps +17%
Dell Inspiron 16 Plus 7630
Intel Core i7-13700H, NVIDIA GeForce RTX 4060 Laptop GPU
53.8 (46min, 45P1) fps +4%
Acer Nitro 16 AN16-41-R7YE
AMD Ryzen 5 7535HS, NVIDIA GeForce RTX 4050 Laptop GPU
52.9 (43min, 44P1) fps +2%
Dell Inspiron 16 Plus 7640
Intel Core Ultra 7 155H, NVIDIA GeForce RTX 4060 Laptop GPU
51.8 (44min, 43P1) fps
Framework Laptop 16
AMD Ryzen 9 7940HS, AMD Radeon RX 7700S
47.7 (32min, 34P1) fps -8%
Asus VivoBook Pro 16 K6602VU
Intel Core i9-13900H, NVIDIA GeForce RTX 4050 Laptop GPU
47.5 (40min, 34P1) fps -8%
Acer Swift Edge SFE16 Ryzen 7 7840U
AMD Ryzen 7 7840U, AMD Radeon 780M
9.92 (7min, 7P1) fps -81%
2560x1440 Ultra High Preset AA:T AF:16x
Acer Nitro 16 AN16-41
AMD Ryzen 7 7735HS, NVIDIA GeForce RTX 4070 Laptop GPU
50.3 (43min, 41P1) fps +57%
Lenovo Legion 5 16IRX G9
Intel Core i7-14650HX, NVIDIA GeForce RTX 4060 Laptop GPU
45.2 (39min, 37P1) fps +41%
Усредн. модель с NVIDIA GeForce RTX 4060 Laptop GPU
  (31 - 45.2, n=17)
39 fps +21%
Dell Inspiron 16 Plus 7630
Intel Core i7-13700H, NVIDIA GeForce RTX 4060 Laptop GPU
34.1 (28min, 28P1) fps +6%
Dell Inspiron 16 Plus 7640
Intel Core Ultra 7 155H, NVIDIA GeForce RTX 4060 Laptop GPU
32.1 (27min, 26P1) fps
Framework Laptop 16
AMD Ryzen 9 7940HS, AMD Radeon RX 7700S
29.9 (20min, 21P1) fps -7%
Asus VivoBook Pro 16 K6602VU
Intel Core i9-13900H, NVIDIA GeForce RTX 4050 Laptop GPU
29.6 (24min, 22P1) fps -8%
Baldur's Gate 3
1920x1080 Low Preset
Усредн. модель с NVIDIA GeForce RTX 4060 Laptop GPU
  (104.2 - 160.3, n=5)
125.5 fps +13%
Dell Inspiron 16 Plus 7640
Intel Core Ultra 7 155H, NVIDIA GeForce RTX 4060 Laptop GPU
111.1 fps
Framework Laptop 16
AMD Ryzen 9 7940HS, AMD Radeon RX 7700S
106.8 fps -4%
Lenovo Yoga 7 2-in-1 16IML9
Intel Core Ultra 5 125U, Intel Graphics 4-Cores iGPU (Arc)
15.4 fps -86%
1920x1080 Medium Preset
Усредн. модель с NVIDIA GeForce RTX 4060 Laptop GPU
  (85.2 - 125.7, n=7)
98.2 fps +5%
Dell Inspiron 16 Plus 7640
Intel Core Ultra 7 155H, NVIDIA GeForce RTX 4060 Laptop GPU
93.2 fps
Framework Laptop 16
AMD Ryzen 9 7940HS, AMD Radeon RX 7700S
88 fps -6%
1920x1080 High Preset
Усредн. модель с NVIDIA GeForce RTX 4060 Laptop GPU
  (71.1 - 110.7, n=7)
85 fps +3%
Dell Inspiron 16 Plus 7640
Intel Core Ultra 7 155H, NVIDIA GeForce RTX 4060 Laptop GPU
82.4 fps
Framework Laptop 16
AMD Ryzen 9 7940HS, AMD Radeon RX 7700S
76.4 fps -7%
1920x1080 Ultra Preset
Усредн. модель с NVIDIA GeForce RTX 4060 Laptop GPU
  (66.5 - 105.5, n=8)
83 fps +8%
Dell Inspiron 16 Plus 7640
Intel Core Ultra 7 155H, NVIDIA GeForce RTX 4060 Laptop GPU
76.7 fps
Framework Laptop 16
AMD Ryzen 9 7940HS, AMD Radeon RX 7700S
73.6 fps -4%
2560x1440 Ultra Preset
Усредн. модель с NVIDIA GeForce RTX 4060 Laptop GPU
  (48.9 - 72.2, n=7)
58.1 fps +9%
Dell Inspiron 16 Plus 7640
Intel Core Ultra 7 155H, NVIDIA GeForce RTX 4060 Laptop GPU
53.2 fps
Framework Laptop 16
AMD Ryzen 9 7940HS, AMD Radeon RX 7700S
51.1 fps -4%
Cyberpunk 2077 2.1 Phantom Liberty
1920x1080 Low Preset (FSR off)
Lenovo Legion 5 16IRX G9
Intel Core i7-14650HX, NVIDIA GeForce RTX 4060 Laptop GPU
133.1 (21.2min) fps +38%
Усредн. модель с NVIDIA GeForce RTX 4060 Laptop GPU
  (96.7 - 136.1, n=11)
117.3 fps +21%
Framework Laptop 16
AMD Ryzen 9 7940HS, AMD Radeon RX 7700S
100.7 (55.4min) fps +4%
Dell Inspiron 16 Plus 7640
Intel Core Ultra 7 155H, NVIDIA GeForce RTX 4060 Laptop GPU
96.8 (78.1min) fps
Lenovo Yoga 7 2-in-1 16IML9
Intel Core Ultra 5 125U, Intel Graphics 4-Cores iGPU (Arc)
20.9 (8.34min) fps -78%
1920x1080 Medium Preset (FSR off)
Lenovo Legion 5 16IRX G9
Intel Core i7-14650HX, NVIDIA GeForce RTX 4060 Laptop GPU
110.4 (18.7min) fps +33%
Усредн. модель с NVIDIA GeForce RTX 4060 Laptop GPU
  (77.7 - 110.4, n=11)
93.9 fps +13%
Dell Inspiron 16 Plus 7640
Intel Core Ultra 7 155H, NVIDIA GeForce RTX 4060 Laptop GPU
83.1 (71.3min) fps
Framework Laptop 16
AMD Ryzen 9 7940HS, AMD Radeon RX 7700S
80.5 (59.6min) fps -3%
Lenovo Yoga 7 2-in-1 16IML9
Intel Core Ultra 5 125U, Intel Graphics 4-Cores iGPU (Arc)
16.9 (7.96min) fps -80%
1920x1080 High Preset (FSR off)
Lenovo Legion 5 16IRX G9
Intel Core i7-14650HX, NVIDIA GeForce RTX 4060 Laptop GPU
95.3 (18.5min) fps +36%
Усредн. модель с NVIDIA GeForce RTX 4060 Laptop GPU
  (65.2 - 102, n=14)
80.8 fps +16%
Dell Inspiron 16 Plus 7640
Intel Core Ultra 7 155H, NVIDIA GeForce RTX 4060 Laptop GPU
69.9 (60.2min) fps
Framework Laptop 16
AMD Ryzen 9 7940HS, AMD Radeon RX 7700S
68.1 (47.8min) fps -3%
Lenovo Yoga 7 2-in-1 16IML9
Intel Core Ultra 5 125U, Intel Graphics 4-Cores iGPU (Arc)
14.3 (3.34min) fps -80%
1920x1080 Ultra Preset (FSR off)
Lenovo Legion 5 16IRX G9
Intel Core i7-14650HX, NVIDIA GeForce RTX 4060 Laptop GPU
81.8 (19.5min) fps +37%
Усредн. модель с NVIDIA GeForce RTX 4060 Laptop GPU
  (56.7 - 93.1, n=16)
71.7 fps +20%
Framework Laptop 16
AMD Ryzen 9 7940HS, AMD Radeon RX 7700S
60.7 (46.5min) fps +2%
Dell Inspiron 16 Plus 7640
Intel Core Ultra 7 155H, NVIDIA GeForce RTX 4060 Laptop GPU
59.8 (50.5min) fps
Lenovo Yoga 7 2-in-1 16IML9
Intel Core Ultra 5 125U, Intel Graphics 4-Cores iGPU (Arc)
12.5 (2.72min) fps -79%
2560x1440 Ultra Preset (FSR off)
Lenovo Legion 5 16IRX G9
Intel Core i7-14650HX, NVIDIA GeForce RTX 4060 Laptop GPU
49.7 (26.6min) fps +35%
Усредн. модель с NVIDIA GeForce RTX 4060 Laptop GPU
  (32.9 - 51.8, n=11)
44 fps +20%
Framework Laptop 16
AMD Ryzen 9 7940HS, AMD Radeon RX 7700S
37.3 (30.7min) fps +1%
Dell Inspiron 16 Plus 7640
Intel Core Ultra 7 155H, NVIDIA GeForce RTX 4060 Laptop GPU
36.8 (32min) fps

Частота кадров, Witcher 3

05101520253035404550556065707580Tooltip
Dell Inspiron 16 Plus 7640 Ultra 7 155H, NVIDIA GeForce RTX 4060 Laptop GPU: Ø78.8 (75-84)
мин. сред. выс. макс.QHD
The Witcher 3 (2015) 375.8 276.8 160.3 84.1 61.9
Dota 2 Reborn (2015) 173.5 152.1 143.2 135.1
Final Fantasy XV Benchmark (2018) 137.6 98.4 78.8 58.8
X-Plane 11.11 (2018) 123.7 109 86.5
Far Cry 5 (2018) 138 125 118 110 83
Strange Brigade (2018) 360 225 178.1 153.5 105.2
Tiny Tina's Wonderlands (2022) 177.4 116 91.9 71.1 48
F1 22 (2022) 197 184.3 151.3 51.8 32.1
Baldur's Gate 3 (2023) 111.1 93.2 82.4 76.7 53.2
Cyberpunk 2077 2.1 Phantom Liberty (2023) 96.8 83.1 69.9 59.8 36.8

Температурные и акустические показатели

Система охлаждения - Громкое охлаждение в играх

Внутренние вентиляторы работают тише, чем в прошлогодней модели. Например, при запуске 3DMark 06 шум вентиляторов держится на уровне 29 дБ(А) до конца первой сцены бенчмарка, тогда как Inspiron 16 Plus 7630 становится намного громче - 35 дБ(А). При длительной работе с более требовательными нагрузками, например, играми, уровень шума обоих ноутбуков стабилизируется на отметке более 50 дБ(А).

Шума вентилятора (Белый: Фоновый, Красный: Простой системы, Синий: 3DMark 06, Оранжевый: Witcher 3, Зеленый: Prime95 stress)

Уровень шума

Ожидание
24.2 / 24.2 / 24.2 дБ
Нагрузка
28.9 / 51 дБ
  red to green bar
 
 
30 dB
бесшумно
40 dB(A)
различимо
50 dB(A)
громко
 
min: dark, med: mid, max: light   Earthworks M23R, Arta (15 см от источника шума)   фоновый шум: 23.8 dB(A)
dB(A) 0102030405060708090Deep BassMiddle BassHigh BassLower RangeMidsHigher MidsLower HighsMid HighsUpper HighsSuper Highs2036.136.935.237.337.62526.328.82926.934.13124.826.924.525.828.54023.822.220.52023.55027.727.525.423.328.76327.828.628.228.627.58030.122.422.42230.210023.720.52018.627.112522.326.118.915.924.916025.218.815.115.426.120025.526.616.81626.525029.72116.51429.631531.520.917.915.730.940031.41814.613.831.350031.220.912.612.131.163032.916.913.611.632.980033.915.711.611.133.9100035.616.110.610.835.812503816.810.110.338160038.316.210.710.438.2200039.417.810.710.939.4250039.518.71110.939.2315039.415.311.611.439.4400040.913.911.81240.4500042.613.312.31242.7630041.713.712.412.241.7800038.815.412.612.338.71000033.615.112.512.433.51250030.514.312.712.430.31600027.114.112.211.527.1SPL5128.924.223.850.9N7.41.20.60.57.3median 33.6median 16.8median 12.5median 12.1median 33.5Delta5.92.721.95.9hearing rangehide median Fan NoiseDell Inspiron 16 Plus 7640
Dell Inspiron 16 Plus 7640
NVIDIA GeForce RTX 4060 Laptop GPU, Ultra 7 155H, SK hynix BC901 HFS001TEJ4X164N
Dell Inspiron 16 Plus 7630
NVIDIA GeForce RTX 4060 Laptop GPU, i7-13700H, WD PC SN740 SDDPTQD-1T00
Dell Inspiron 16 Plus 7620
GeForce RTX 3050 Ti Laptop GPU, i7-12700H, Kioxia BG5 KBG50ZNS512G
Samsung Galaxy Book4 Ultra
NVIDIA GeForce RTX 4050 Laptop GPU, Ultra 7 155H, Samsung PM9A1 MZVL2512HCJQ
Lenovo Legion 5 16IRX G9
NVIDIA GeForce RTX 4060 Laptop GPU, i7-14650HX, Samsung PM9A1 MZVL21T0HCLR
Asus VivoBook Pro 16 K6602VU
NVIDIA GeForce RTX 4050 Laptop GPU, i9-13900H, Micron 2400 MTFDKBA1T0QFM
Уровень шума
-2%
-13%
0%
-17%
-11%
в выкл. виде (фон) *
23.8
23.2
3%
23.3
2%
24.2
-2%
24
-1%
20.96
12%
Мин. в простое *
24.2
23.2
4%
25.7
-6%
24.2
-0%
24
1%
25.28
-4%
В простое, сред. *
24.2
23.2
4%
26.1
-8%
24.2
-0%
28.8
-19%
25.28
-4%
В простое, макс. *
24.2
23.2
4%
30.6
-26%
24.2
-0%
32
-32%
25.28
-4%
Нагрузка, сред. *
28.9
35.1
-21%
46.2
-60%
37.9
-31%
45.5
-57%
51.88
-80%
Witcher 3 ultra *
51
52.5
-3%
49.2
4%
41.7
18%
53.1
-4%
49
4%
Нагрузка, макс. *
51
52.5
-3%
49.4
3%
41.7
18%
55.7
-9%
51.8
-2%

* ... меньше = лучше

Температура

Температура поверхности может быть довольно высокой, несмотря на множество вентиляционных решеток по краям. Температура в горячих точках во время игр может достигать 43 C на обеих крышках корпуса C и D, что сравнимо с Lenovo Legion 5i 16 G9 игровым ноутбуком.

Выхлопные трубы сзади и по бокам
Адаптер переменного тока достигает температуры более 47 C при работе с высокими нагрузками
Макс.
 41.2 °C43.4 °C41 °C 
 41.4 °C42.6 °C38.8 °C 
 35.2 °C34.6 °C32.2 °C 
Макс.: 43.4 °C
Усредн.: 38.9 °C
38 °C41.6 °C37.4 °C
37 °C41.2 °C40.4 °C
33.6 °C35.2 °C34.6 °C
Макс.: 41.6 °C
Усредн.: 37.7 °C
ЗУ (макс.)  48 °C | Темп. воздуха 20 °C | Fluke 62 Mini IR Thermometer
(-) При нагрузочном тестировании верх корпуса нагревается в среднем до 38.9 град. Типичное значение для устройств этого же класса (Multimedia) = 31.2 градуса (-ов).
(±) Макс. температура верха корпуса составила 43.4 град. Цельсия. Типичное значение для устройств этого же класса (Multimedia) = 36.9 градуса (-ов) при минимуме в 21.1 град. и максимуме в 71 град.
(±) Макс. температура дна составила 41.6 град. Цельсия. Типичное значение для устройств этого же класса = 39.1 градуса (-ов).
(+) При отсутствии вычислительной нагрузки верх корпуса нагревается в среднем до 29.9 град. Типичное значение для устройств этого же класса = 31.2 градуса (-ов).
(+) Палуба на ощупь: Умеренно тепло (35.2 град. Цельсия).
(-) Средняя температура палубы у похожих моделей составила 28.8 град. Цельсия, это -6.4 градуса (-ов) разницы.
Нагрев в состоянии простоя, палуба ноутбука
Нагрев в состоянии простоя, днище ноутбука
Нагрев под нагрузкой, палуба ноутбука
Нагрев под нагрузкой, днище ноутбука
Dell Inspiron 16 Plus 7640
Intel Core Ultra 7 155H, NVIDIA GeForce RTX 4060 Laptop GPU
Dell Inspiron 16 Plus 7630
Intel Core i7-13700H, NVIDIA GeForce RTX 4060 Laptop GPU
Dell Inspiron 16 Plus 7620
Intel Core i7-12700H, NVIDIA GeForce RTX 3050 Ti Laptop GPU
Samsung Galaxy Book4 Ultra
Intel Core Ultra 7 155H, NVIDIA GeForce RTX 4050 Laptop GPU
Lenovo Legion 5 16IRX G9
Intel Core i7-14650HX, NVIDIA GeForce RTX 4060 Laptop GPU
Asus VivoBook Pro 16 K6602VU
Intel Core i9-13900H, NVIDIA GeForce RTX 4050 Laptop GPU
Нагрев
-7%
-0%
17%
0%
-14%
Нагрузка, макс. сверху *
43.4
47.8
-10%
46
-6%
38.5
11%
40.4
7%
42.6
2%
Нагрузка, макс. на дне *
41.6
42.2
-1%
45.8
-10%
41.2
1%
43.8
-5%
48.4
-16%
В простое сверху *
32.8
35.2
-7%
29.2
11%
23.5
28%
30.3
8%
39.4
-20%
В простое на дне *
32.4
35
-8%
31
4%
24.1
26%
35.3
-9%
39.8
-23%

* ... меньше = лучше

Акустическая система

Розовый шум демонстрирует отличную максимальную громкость и достойное воспроизведение низких частот для мультимедийного ноутбука
dB(A) 0102030405060708090Deep BassMiddle BassHigh BassLower RangeMidsHigher MidsLower HighsMid HighsUpper HighsSuper Highs2038.335.238.32528.12928.13125.324.525.34022.320.522.3502325.4236321.528.221.5802422.42410030.62030.612544.318.944.316060.615.160.620069.516.869.525071.816.571.83157117.97140071.614.671.650070.612.670.663075.813.675.880075.611.675.610007410.674125077.110.177.1160078.910.778.9200076.610.776.6250073.31173.3315069.611.669.6400067.311.867.3500065.912.365.9630075.412.475.4800078.412.678.4100007812.5781250068.112.768.11600067.912.267.9SPL87.124.287.1N75.20.675.2median 71.8median 12.5median 71.8Delta5.225.226.325.821.422.12624.925.127.622.532.523.448.72655.818.860.922.167.2267019.372.317.674.217.774.319.575.31571.711.871.311.27410.574.21072.710.17210.67210.97511.374.811.671.71269.71269.612.371.112.669.61270.111.269.824.784.70.666.6median 12median 71.73.42.2hearing rangehide median Pink NoiseDell Inspiron 16 Plus 7640Apple MacBook Pro 16 2021 M1 Pro
АЧХ (если нужно отключить сравнение, нажмите на квадратики сверху)
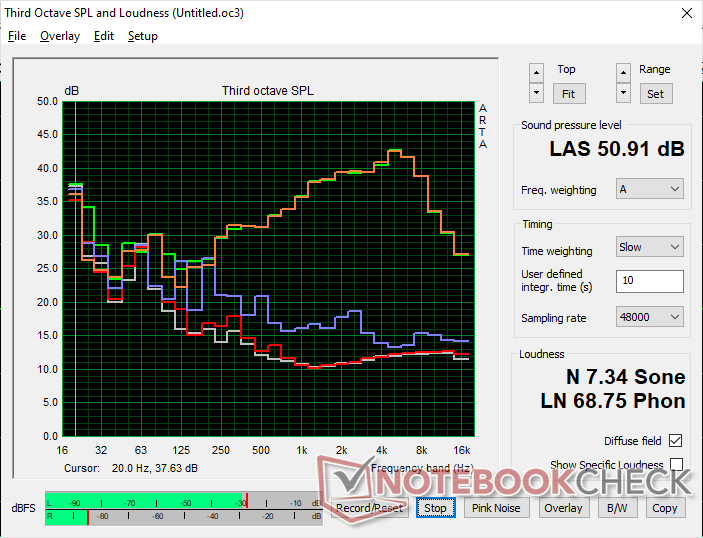
Анализ АЧХ аудиосистемы Dell Inspiron 16 Plus 7640

(+) | отличный уровень макс. громкости (87.1 дБА)
Низкие частоты (100 Гц - 315 Гц)
(±) | баса мало (на 13.9% меньше медианы)
(±) | он умеренно сбалансирован
Средние частоты (400 Гц - 2000 Гц)
(+) | диапазон не провален и не выпячен (отклонение лишь 3.6% от медианы)
(+) | он ровный, без "горбов" или провалов
Высокие частоты (2 кГц - 16 кГц)
(+) | диапазон отлично сбалансирован (отклонение лишь 4.3% от медианы)
(+) | он ровный, без "горбов" или провалов
Весь диапазон (100 - 16000 Гц)
(+) | звук в целом сбалансирован (11.3% отличия от медианы)
в сравнении с устройствами того же класса
» 11% прямо сравнимых устройств показал(и) себя лучше, 4% примерно так же, 85% значительно хуже
» Δ наилучшего устройства из прямо сравнимых: 5%, средняя Δ: 18%, худший результат: 45%
в сравнении со всеми тестированными устройствами
» 5% известных нам устройств показал(и) себя лучше, 2% примерно так же, 93% значительно хуже
» Δ наилучшего устройства среди известных нам: 4%, средняя Δ: 25%, худший результат: 134%

Анализ АЧХ аудиосистемы Apple MacBook Pro 16 2021 M1 Pro

(+) | отличный уровень макс. громкости (84.7 дБА)
Низкие частоты (100 Гц - 315 Гц)
(+) | бас отлично сбалансирован (отклонение лишь 3.8% от медианы)
(+) | он ровный, без "горбов" или провалов
Средние частоты (400 Гц - 2000 Гц)
(+) | диапазон не провален и не выпячен (отклонение лишь 1.3% от медианы)
(+) | он ровный, без "горбов" или провалов
Высокие частоты (2 кГц - 16 кГц)
(+) | диапазон отлично сбалансирован (отклонение лишь 1.9% от медианы)
(+) | он ровный, без "горбов" или провалов
Весь диапазон (100 - 16000 Гц)
(+) | звук в целом сбалансирован (4.6% отличия от медианы)
в сравнении с устройствами того же класса
» 0% прямо сравнимых устройств показал(и) себя лучше, 0% примерно так же, 100% значительно хуже
» Δ наилучшего устройства из прямо сравнимых: 5%, средняя Δ: 18%, худший результат: 45%
в сравнении со всеми тестированными устройствами
» 0% известных нам устройств показал(и) себя лучше, 0% примерно так же, 100% значительно хуже
» Δ наилучшего устройства среди известных нам: 4%, средняя Δ: 25%, худший результат: 134%

Энергопотребление и автономная работа

Энергопотребление

Энергопотребление заметно ниже, чем у прошлогодней модели в режиме ожидания на рабочем столе, что может объяснить более длительное время автономной работы в следующем разделе. Система потребляет от 4 до 16 Вт по сравнению с 16-21 Вт у Inspiron 16 Plus 7630. Потребление при запуске более требовательных приложений, таких как игры, в остальном почти такое же, если не ниже на несколько ватт.

Интересно, что модель поставляется с универсальным 130-ваттным USB-C адаптером переменного тока (~14,3 x 6,5 x 2,2 см) вместо 130-ваттного фирменного бочкового зарядного устройства переменного тока, которое поставлялось с прошлогодней моделью. Однако порт для бочкового адаптера переменного тока остался, то есть Вы по-прежнему можете подзаряжать систему с помощью совместимого бочкового зарядного устройства. При одновременной работе Prime95 и FurMark нам удалось зафиксировать временное максимальное потребление 138 Вт.

3DMark 06
3DMark 06
Witcher 3 ультрапотребление 1080p
Потребление резко возрастает до 138 Вт и длится около 25 секунд при запуске нагрузки Prime95, после чего снижается и стабилизируется на уровне 75
Prime95+FurMark стресс начался на отметке 10s
Энергопотребление
Выкл.darklight 0.25 / 1.2 Вт
Ожиданиеdarkmidlight 4.2 / 6.9 / 15.2 Вт
Нагрузка midlight 70.4 / 137.4 Вт
 color bar
Легенда: min: dark, med: mid, max: light        Metrahit Energy
В настоящий момент для этих замеров мы используем Metrahit Energy, однофазный профессиональный мультиметр.
Dell Inspiron 16 Plus 7640
Ultra 7 155H, NVIDIA GeForce RTX 4060 Laptop GPU, SK hynix BC901 HFS001TEJ4X164N, IPS, 2560x1600, 16.00
Dell Inspiron 16 Plus 7630
i7-13700H, NVIDIA GeForce RTX 4060 Laptop GPU, WD PC SN740 SDDPTQD-1T00, IPS, 2560x1600, 16.00
Dell Inspiron 16 Plus 7620
i7-12700H, GeForce RTX 3050 Ti Laptop GPU, Kioxia BG5 KBG50ZNS512G, IPS, 3072x1920, 16.00
Samsung Galaxy Book4 Ultra
Ultra 7 155H, NVIDIA GeForce RTX 4050 Laptop GPU, Samsung PM9A1 MZVL2512HCJQ, OLED, 2880x1800, 16.00
Lenovo Legion 5 16IRX G9
i7-14650HX, NVIDIA GeForce RTX 4060 Laptop GPU, Samsung PM9A1 MZVL21T0HCLR, IPS, 2560x1600, 16.00
Asus VivoBook Pro 16 K6602VU
i9-13900H, NVIDIA GeForce RTX 4050 Laptop GPU, Micron 2400 MTFDKBA1T0QFM, OLED, 3200x2000, 16.00
Энергопотребление
-82%
-30%
9%
-113%
-116%
В простое, мин. *
4.2
15.6
-271%
6.8
-62%
4.8
-14%
15.4
-267%
21.06
-401%
В простое, сред. *
6.9
17.7
-157%
9.6
-39%
7.5
-9%
19.7
-186%
24.27
-252%
В простое, макс. *
15.2
20.6
-36%
17
-12%
7.9
48%
20.7
-36%
25.12
-65%
Нагрузка, сред. *
70.4
87.4
-24%
117.5
-67%
79.3
-13%
102.6
-46%
52.4
26%
Witcher 3 ultra *
115.9
121.7
-5%
113.1
2%
79.2
32%
191.3
-65%
110.2
5%
Нагрузка, макс. *
137.4
138
-0%
137.4
-0%
125
9%
246.6
-79%
146
-6%

* ... меньше = лучше

Энергопотребление: Witcher 3, Стресс-тест

0102030405060708090100110120130Tooltip
Dell Inspiron 16 Plus 7640 Ultra 7 155H, NVIDIA GeForce RTX 4060 Laptop GPU; Witcher 3 ultra: Ø115.9 (111.1-127.1)
Dell Inspiron 16 Plus 7630 i7-13700H, NVIDIA GeForce RTX 4060 Laptop GPU; Witcher 3 ultra: Ø121.7 (116-127.6)
Dell Inspiron 16 Plus 7640 Ultra 7 155H, NVIDIA GeForce RTX 4060 Laptop GPU; 1280x720 Prime95 28.10 and Furmark 1.25: Ø119.2 (91.3-137.4)
Dell Inspiron 16 Plus 7630 i7-13700H, NVIDIA GeForce RTX 4060 Laptop GPU; 1280x720 Prime95 28.10 and Furmark 1.25: Ø120.3 (102.4-138)
Dell Inspiron 16 Plus 7640 Ultra 7 155H, NVIDIA GeForce RTX 4060 Laptop GPU; Idle 150cd/m2: Ø6.58 (3.03-17.2)
Dell Inspiron 16 Plus 7630 i7-13700H, NVIDIA GeForce RTX 4060 Laptop GPU; Idle 150cd/m2: Ø17.1 (16.2-22.9)

Энергопотребление с внешним монитором

0102030405060708090100110120130Tooltip
Dell Inspiron 16 Plus 7640 Ultra 7 155H, NVIDIA GeForce RTX 4060 Laptop GPU; Prime95 V2810 Stress (external Monitor): Ø84.9 (72.3-137.4)
Dell Inspiron 16 Plus 7630 i7-13700H, NVIDIA GeForce RTX 4060 Laptop GPU; Prime95 V2810 Stress (external Monitor): Ø82.1 (62.2-138)
Dell Inspiron 16 Plus 7640 Ultra 7 155H, NVIDIA GeForce RTX 4060 Laptop GPU; Cinebench R15 Multi (external Monitor): Ø84.8 (49-121.2)
Dell Inspiron 16 Plus 7630 i7-13700H, NVIDIA GeForce RTX 4060 Laptop GPU; Cinebench R15 Multi (external Monitor): Ø119.9 (110.7-133.4)
Dell Inspiron 16 Plus 7640 Ultra 7 155H, NVIDIA GeForce RTX 4060 Laptop GPU; 1280x720 FurMark 1.19 GPU Stress Test (external Monitor): Ø94.2 (91-111.7)
Dell Inspiron 16 Plus 7630 i7-13700H, NVIDIA GeForce RTX 4060 Laptop GPU; 1280x720 FurMark 1.19 GPU Stress Test (external Monitor): Ø103.6 (98.1-126.3)
Dell Inspiron 16 Plus 7640 Ultra 7 155H, NVIDIA GeForce RTX 4060 Laptop GPU; 1920x1080 The Witcher 3 ultra (external Monitor): Ø106.6 (100.5-116.2)
Dell Inspiron 16 Plus 7630 i7-13700H, NVIDIA GeForce RTX 4060 Laptop GPU; 1920x1080 The Witcher 3 ultra (external Monitor): Ø120.7 (116.9-127.8)
Dell Inspiron 16 Plus 7640 Ultra 7 155H, NVIDIA GeForce RTX 4060 Laptop GPU; Idle 1min (external Monitor): Ø4.09 (2.1-5.85)
Dell Inspiron 16 Plus 7630 i7-13700H, NVIDIA GeForce RTX 4060 Laptop GPU; Idle 1min (external Monitor): Ø16.3 (14.3-26.2)

Автономность

Время работы стало намного больше, чем раньше, вероятно, благодаря оптимизации и переходу на процессор Intel нового поколения. Нам удалось зафиксировать время автономной работы в реальном режиме WLAN почти 13,5 часов по сравнению с 9,5 часами у прошлогодней модели.

Зарядка от пустого до полного заряда занимает около 2 часов с помощью прилагаемого адаптера USB-C.

Автономная работа
WiFi Websurfing
13час. 19мин.
Dell Inspiron 16 Plus 7640
Ultra 7 155H, NVIDIA GeForce RTX 4060 Laptop GPU, 90 Вт⋅ч
Dell Inspiron 16 Plus 7630
i7-13700H, NVIDIA GeForce RTX 4060 Laptop GPU, 86 Вт⋅ч
Dell Inspiron 16 Plus 7620
i7-12700H, GeForce RTX 3050 Ti Laptop GPU, 86 Вт⋅ч
Samsung Galaxy Book4 Ultra
Ultra 7 155H, NVIDIA GeForce RTX 4050 Laptop GPU, 76 Вт⋅ч
Lenovo Legion 5 16IRX G9
i7-14650HX, NVIDIA GeForce RTX 4060 Laptop GPU, 80 Вт⋅ч
Asus VivoBook Pro 16 K6602VU
i9-13900H, NVIDIA GeForce RTX 4050 Laptop GPU, 96 Вт⋅ч
Время работы
-29%
-28%
-18%
-44%
-24%
Чтение сайтов по Wi-Fi v.2
799
566
-29%
575
-28%
656
-18%
444
-44%
606
-24%
В простое
1055
1114
Нагрузка и 100% яркости
85
69
78
46
Воспр. видео H.264
1076
576
585

За

+ откалиброванный дисплей с частотой 120 Гц и полным охватом sRGB
+ встроенный NPU для ускорения искусственного интеллекта
+ теперь поддерживает до двух твердотельных накопителей M.2
+ поддержка Thunderbolt 4
+ хорошая автономность

Против

- однопоточная производительность ниже, чем в прошлом году
- производительность в играх ниже, чем в прошлом году
- бесполезный проприетарный разъем питания
- нет G-Sync и Windows VRR
- один порт USB-C

Вердикт - Есть над чем поработать

В обзоре: Dell Inspiron 16 Plus 7640

Хотя Inspiron 16 Plus 7640 2024 года может выглядеть очень похоже на версию 2023 годано в ней достаточно новшеств, помимо ожидаемого ежегодного обновления процессора, о которых заинтересованным покупателям стоит знать. Новая модель поддерживает до двух твердотельных накопителей, предлагает более быстрое время отклика на черно-белые и серо-белые запросы, более длительное время автономной работы и ускорение искусственного интеллекта. Эти изменения в "подкапотном пространстве" важны для энтузиастов, которые ценят расширение памяти, быстрые игры, путешествия и программы с поддержкой искусственного интеллекта, такие как Co-Pilot. В этом отношении Inspiron 16 Plus 7640 становится несомненным преимуществом перед своим предшественником.

Inspiron 16 Plus 7640 устраняет некоторые недостатки своего предшественника, чтобы стать еще более совершенной мультимедийной машиной, чем раньше. Однако производительность однопоточного процессора и игровая производительность делают крошечный шаг назад.

К сожалению, производительность в играх в новой модели снизилась, поскольку большинство игр работает немного медленнее, чем раньше. Хардкорных игроков это может разочаровать, но недостаток не должен отпугнуть казуальных игроков, для которых и была разработана серия Inspiron. Геймерам, которые действительно хотят выжать больше производительности из своих ноутбуков, придется обратить внимание на более крупные и дорогие модели, такие как Dell серии G16, Asus Zephyrus G16или Razer Blade 16 где TGP часто может достигать трехзначных цифр.

Dell Inspiron 16 Plus 7640 - 21 June 2024 v8 (new)
Allen Ngo

Корпус
84 / 98 → 85%
Клавиатура
82%
Трекпад
78%
Порты и связь
60 / 80 → 75%
Вес
62 / 20-74 → 77%
Время работы
89 / 95 → 94%
Дисплей
82%
3D-производительность
76 / 88 → 87%
Производительность ЦП
81 / 92 → 88%
Нагрев
88%
Шумность
80 / 95 → 84%
Аудио
83%
Камера
38 / 75 → 50%
Средний балл
76%
83%
Multimedia - Итоговый рейтинг

Декларация о непредвзятости

Протестированный экземпляр был выдан автору этого материала на короткое время для целей тестирования. Производитель товара или магазин, выдавший нам этот товар на время, не имели никакого влияния на результаты тестирования и не видели текст обзора до его публикации; статья написана не в качестве исполнения любых обязательств перед кем-либо.

Pricecompare

Этот важный материал точно понравится твоим друзьям в социальных сетях!
'
> Обзоры Ноутбуков, Смартфонов, Планшетов. Тесты и Новости > Обзоры > Обзор ноутбука Dell Inspiron 16 Plus 7640: Небольшие, но важные изменения по сравнению с прошлогодней моделью
Allen Ngo, 2024-06-25 (Update: 2024-06-25)