Notebookcheck Logo

Intel Core i5-13400F
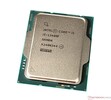
Intel i5-13400F

Intel Core i5-13400F - это процессор для настольных ПК среднего уровня из серии Raptor Lake. Он включает в себя гибридную архитектуру ядер процессора с объединенными 10 ядрами. Шесть быстрых производительных ядер Golden Cove / Raptor Cove (P-cores) с HyperThreading и тактовой частотой 3,5 - 5,1 ГГц и четыре эффективных ядра Gracemont без HyperThreading и тактовой частотой 2,6 - 3,9 ГГц. 13400F может быть основан на более старых чипах Alder Lake (по крайней мере, в ранних моделях) или на более новых чипах Raptor Lake. В процессоры серии F не интегрирован iGPU.

Производительность явно выше, чем у старых Core i5-12400F, благодаря дополнительным четырем ядрам E. Они помогают в многопоточных рабочих нагрузках, а более мощные ядра p-ядер помогают в однопоточных нагрузках.

Энергопотребление 13400F оценивается в 65 Вт при длительной нагрузке (PL1) и 148 Вт при коротких сериях (PL2).

СерияIntel Raptor Lake-S
Кодовое имяRaptor Lake-S

Серия: Raptor Lake-S Raptor Lake-S

Intel Core i7-137002.1 - 5.2 ГГц16 / 24 cores30 MB L3
Intel Core i5-13400F « 2.5 - 4.6 ГГц10 / 16 cores20 MB L3
Intel Core i5-134002.5 - 4.6 ГГц10 / 16 cores20 MB L3
Частота2500 - 4600 МГц
Кэш L10.1 MB
Кэш L29.5 MB
Кэш L320 MB
Ядер / потоков10 / 16
Теплопакет (TDP)65 Вт
Техпроцесс10 нм
Размер кристалла257 mm2
Макс. температура100 °C
Разъём (сокет)LGA 1700
ОсобенностиIntel SSE4.1, Intel SSE4.2, Intel AVX2
64 бита+
Architecturex86
Цена на начало продаж$196 U.S.
Дата анонса04 January 2023
Сайт производителяark.intel.com

Тесты на производительность

Performance Rating - CB R15 + R20 + 7-Zip + X265 + Blender + 3DM11 CPU
42.5 pt (59%)
Cinebench R23 - Cinebench R23 Multi Core
15911 Points (15%)
202 -99%
...
15291 -4%
15337 -4%
AMD Ryzen 9 5900X
15441 -3%
AMD Ryzen 7 5800X
15476 -3%
Intel Core i9-10850K
15538 -2%
15603 -2%
15743 -1%
15821 -1%
15902 0%
Intel Core i5-13400F
15911
15953 0%
16302 2%
16393 3%
16685 5%
16686 5%
16952 7%
16992 7%
17082 7%
17387 9%
...
107681 577%
0%
100%
Cinebench R23 - Cinebench R23 Single Core
1744 Points (74%)
Cinebench R20 - Cinebench R20 CPU (Single Core)
672 Points (75%)
Cinebench R20 - Cinebench R20 CPU (Multi Core)
6091 Points (15%)
Cinebench R15 - Cinebench R15 CPU Multi 64 Bit
2364 Points (15%)
31 -99%
...
2276 -4%
Intel Core i7-11700K
2299 -3%
Intel Core i9-10910
2302 -3%
2316 -2%
2317 -2%
2329 -1%
2339 -1%
2358 0%
2358 0%
Intel Core i5-13400F
2364
2373 0%
Intel Core i5-13500
2405 2%
2413 2%
2421 2%
2426 3%
2440 3%
2455 4%
2456 4%
Intel Core i9-10850K
2457 4%
...
15842 570%
0%
100%
012024036048060072084096010801200132014401560168018001920204021602280Tooltip
Cinebench R15 - Cinebench R15 CPU Single 64 Bit
252 Points (76%)
19 -92%
...
Intel Core i5-13500T
247 -2%
247 -2%
247.8 -2%
248 -2%
248.4 -1%
249 -1%
250.1 -1%
251.2 0%
251.6 0%
Intel Core i5-13400F
252
252.3 0%
AMD Ryzen 9 5900X
252.6 0%
253 0%
AMD Ryzen 5 5600X
254 1%
255.3 1%
255.6 1%
Intel Core i5-13500
256 2%
256.3 2%
256.5 2%
...
332 32%
0%
100%
Cinebench R11.5 - Cinebench R11.5 CPU Multi 64 Bit
27.5 Points (36%)
Cinebench R11.5 - Cinebench R11.5 CPU Single 64 Bit
3.1 Points (76%)
Cinebench R10 - Cinebench R10 Rend. Single (32bit)
8689 баллов (52%)
Cinebench R10 - Cinebench R10 Rend. Multi (32bit)
51113 баллов (37%)
Cinebench R10 - Cinebench R10 Rend. Multi (64bit)
82988 Points (58%)
Cinebench R10 - Cinebench R10 Rend. Single (64bit)
13947 Points (17%)
wPrime 2.10 - wPrime 2.0 1024m *
367.9 s (4%)
wPrime 2.10 - wPrime 2.0 32m *
3.3 s (1%)
WinRAR - WinRAR 4.0
8602 баллов (14%)
7-Zip 18.03 - 7-Zip 18.03 Multli Thread 4 runs
60048 MIPS (34%)
7-Zip 18.03 - 7-Zip 18.03 Single Thread 4 runs
5743 MIPS (69%)
X264 HD Benchmark 4.0 - x264 Pass 2
136.9 fps (48%)
X264 HD Benchmark 4.0 - x264 Pass 1
314.5 fps (73%)
HWBOT x265 Benchmark v2.2 - HWBOT x265 4k Preset
19.2 fps (34%)
051015202530Tooltip
TrueCrypt - TrueCrypt Serpent
1.1 GB/s (0%)
TrueCrypt - TrueCrypt Twofish
2 GB/s (34%)
TrueCrypt - TrueCrypt AES
12.2 GB/s (32%)
Blender - Blender 3.3 Classroom CPU *
336 Seconds (4%)
Blender - Blender 2.79 BMW27 CPU *
206 Seconds (1%)
R Benchmark 2.5 - R Benchmark 2.5 *
0.5 sec (10%)
3DMark 06 - CPU - 3DMark 06 - CPU
13989 Points (30%)
Super Pi mod 1.5 XS 1M - Super Pi mod 1.5 XS 1M *
8 s (2%)
Super Pi mod 1.5 XS 2M - Super Pi mod 1.5 XS 2M *
17.9 s (1%)
Super Pi Mod 1.5 XS 32M - Super Pi mod 1.5 XS 32M *
420.5 s (2%)
3DMark Vantage - 3DM Vant. Perf. CPU no Physx
77937 Points (68%)
3DMark 11 - 3DM11 Performance Physics
23820 Points (64%)
3DMark - 3DMark Ice Storm Physics
77765 Points (63%)
3DMark - 3DMark Ice Storm Extreme Physics
76636 Points (62%)
3DMark - 3DMark Ice Storm Unlimited Physics
80273 Points (68%)
3DMark - 3DMark Cloud Gate Physics
19846 Points (50%)
3DMark - 3DMark Fire Strike Standard Physics
28087 Points (50%)
3DMark - 3DMark Time Spy CPU
12669 Points (53%)
Geekbench 5.5 - Geekbench 5.1 - 5.4 64 Bit Single-Core
1792 баллов (76%)
Mediatek MT6737
58 -97%
...
1768 -1%
1769 -1%
1771 -1%
1774 -1%
1780 -1%
1782 -1%
1787 0%
1788 0%
1790 0%
Intel Core i5-13400F
1792
1793 0%
1795 0%
1796 0%
1797 0%
Intel Core i5-13500
1805 1%
1806 1%
1825 2%
AMD Ryzen Z1
1827 2%
1830 2%
...
2331 30%
0%
100%
Geekbench 5.5 - Geekbench 5.1 - 5.4 64 Bit Multi-Core
12095 баллов (22%)
Geekbench 5.0 - Geekbench 5.0 64 Bit Single-Core
1721 баллов (7%)
Geekbench 5.0 - Geekbench 5.0 64 Bit Multi-Core
12009 баллов (38%)
Geekbench 4.4 - Geekbench 4.1 - 4.4 64 Bit Single-Core
7684 баллов (77%)
Geekbench 4.4 - Geekbench 4.1 - 4.4 64 Bit Multi-Core
43856 баллов (48%)
Mozilla Kraken 1.1 - Kraken 1.1 Total Score *
535 ms (1%)
WebXPRT 4 - WebXPRT 4 Score
254 Points (73%)
WebXPRT 3 - WebXPRT 3 Score
294 Points (61%)
CrossMark - CrossMark Overall
1941 Points (74%)
Power Consumption - Prime95 Power Consumption - external Monitor *
214 Watt (37%)
0153045607590105120135150165180195210225Tooltip
Power Consumption - Cinebench R15 Multi Power Consumption - external Monitor *
184.2 Watt (34%)
0153045607590105120135150165180195210225Tooltip
Power Consumption - Idle Power Consumption - external Monitor *
76.3 Watt (50%)
05101520253035404550556065707580Tooltip
- Разброс результатов видеопроцессора
- Средний результат видеопроцессора
* Меньше = лучше

v1.28
log 02. 17:25:55

#0 no ids found in url (should be separated by "_") +0s ... 0s

#1 not redirecting to Ajax server +0s ... 0s

#2 did not recreate cache, as it is less than 5 days old! Created at Mon, 01 Jul 2024 05:29:49 +0200 +0.001s ... 0.001s

#3 no comparison url found in template nbc.compare_page_2 needed +0.005s ... 0.006s

#4 no comparison url found in template nbc.compare_page_2 needed +0s ... 0.006s

#5 composed specs +0s ... 0.006s

#6 did output specs +0s ... 0.006s

#7 getting avg benchmarks for device 14966 +0.016s ... 0.022s

#8 got single benchmarks 14966 +0.008s ... 0.031s

#9 got avg benchmarks for devices +0s ... 0.031s

#10 min, max, avg, median took s +0.956s ... 0.987s

#11 no comparison url found in template nbc.compare_page_2 needed +0s ... 0.987s

#12 return log +0s ... 0.987s

Не найдено обзоров для этого процессора.

Этот важный материал точно понравится твоим друзьям в социальных сетях!

Другие процессоры из серии Raptor Lake-S

» Intel Core i9-13900K
   24x 3 GHz - 5.8 GHz
» Intel Core i7-13700K
   16x 3.4 GHz - 5.4 GHz
» Intel Core i5-13600K
   14x 3.5 GHz - 5.1 GHz
» Intel Core i7-13700
   16x 2.1 GHz - 5.2 GHz
» Intel Core i5-13500
   14x 2.5 GHz - 4.8 GHz
» Intel Core i5-13400F
   10x 2.5 GHz - 4.6 GHz
» Intel Core i5-13400
   10x 2.5 GHz - 4.6 GHz
» Intel Core i5-13500T
   14x 2.5 GHz - 4.6 GHz

Процессоры, близкие по произв-ти

+ Intel Core i7-12700K
   12x 2.7 GHz - 5 GHz
+ AMD Ryzen 9 5900X
   12x 3.7 GHz - 4.8 GHz
+ Intel Core i9-10980XE
   18x 3 GHz - 4.6 GHz
+ Intel Core i9-9980XE
   18x 3 GHz - 4.4 GHz
+ Intel Core i5-13500
   14x 2.5 GHz - 4.8 GHz
» Intel Core i5-13400F
   10x 2.5 GHz - 4.6 GHz
- Intel Core i5-13400
   10x 2.5 GHz - 4.6 GHz
- Intel Core i7-12700F
   12x 3.3 GHz - 4.9 GHz
- Intel Core i7-12700
   12x 3.3 GHz - 4.9 GHz
- AMD Ryzen Threadripper 2950X
   16x 3.5 GHz - 4.4 GHz
- Intel Core i5-12600K
   10x 2.8 GHz - 4.9 GHz