Notebookcheck Logo
Intel Core Ultra 5 245K in review

Обзор Intel Core Ultra 5 245K: Идеальный баланс между мощностью и эффективностью?

Проклятие и благословение одновременно!

Intel начинает новую эру с процессорами Arrow Lake для настольных ПК. Новая схема наименования, новая архитектура и более низкое энергопотребление - вот некоторые из основных изменений. В этом обзоре мы расскажем и о других изменениях, а также проверим насколько хорош Intel Core Ultra 5 245K в повседневном использовании и в играх.
Sebastian Bade (перевод DeepL) Опубликовано 🇺🇸 🇩🇪 ...
CPU Intel PC и всё, что связано с ним игры и всё, что связано с ними

Вердикт: Эффективный процессор для множества задач

Intel Core Ultra 5 245K предстал в нашем тесте как универсальный и мощный процессор, обеспечивающий высокую производительность как для игр, так и для творческих приложений.

Благодаря гибридной архитектуре, состоящей из мощных ядер Lion Cove Performance (P-ядра) и ядер Skymont Efficiency (E-ядра), чип предлагает отличный баланс между вычислительной мощностью и энергоэффективностью.

Последняя была значительно улучшена по сравнению с предыдущей моделью, что является важным шагом для того, чтобы полностью не потерять связь с предложениями AMD.

Что касается производительности, Core Ultra 5 245K особенно впечатляет в тестах на чистое быстродействие процессора. Однако его производительность в игровых сценариях несколько хуже, чем у старшей модели Intel Core i5-14600K.

Тем не менее, предлагаемой производительности достаточно для плавного запуска всех современных игр. Что касается возможностей подключения, Core Ultra 5 245K поддерживает такие современные стандарты, как PCIe 5.0 и DDR5 RAM, что обеспечивает быструю передачу данных и перспективность.

Это позволяет оснастить систему новейшими SSD и видеокартами, что особенно полезно для геймеров и творческих профессионалов.

В качестве инновации Intel представляет новую архитектуру на базе Socket LGA 1851. Это означает, что простая модернизация процессора с предыдущего поколения невозможна.

Intel Core Ultra 5 245K оказывается экономичным универсалом в среднем сегменте производительности. Благодаря солидной игровой производительности, хорошим возможностям работы в многозадачном режиме и поддержке современных технологий, таких как NPU, он является отличным выбором для пользователей, ищущих хороший баланс между ценой и производительностью. Особого внимания заслуживает энергоэффективность процессора.

За

+ высокая производительность приложений
+ выдающаяся одноядерная и многоядерная производительность
+ PCI Express 5.0
+ значительно эффективнее предыдущих поколений
+ интегрированный НПУ
+ легкое охлаждение
+ модульная структура - дизайн чиплета

Против

- требуется новая материнская плата
- Игровая производительность хуже, чем у предшественника
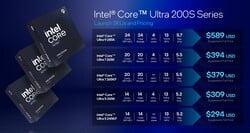
Процессоры Intel Arrow Lake-S. (Источник изображения: Intel)

Линейка Arrow Lake-S представляет собой следующее поколение процессоров Intel для настольных ПК и основана на новом сокете LGA 1851. Это означает, что не только модели Raptor Lake, но и сокет LGA 1700, представленный три года назад, отправляется в отставку.

Новые процессоры Arrow Lake S основаны на гибридной архитектуре с сочетанием мощных ядер Performance (P-ядра) и несколько более слабых ядер Efficiency (E-ядра). Эта гибридная архитектура, впервые представленная в Alder Lake, была дополнительно оптимизирована в Arrow Lake, чтобы в конечном итоге обеспечить лучшую энергоэффективность.

В Arrow Lake-S Intel делает ставку на значительное увеличение производительности как в одноядерной, так и в многоядерной областях. В этом обзоре мы пошагово рассмотрим, что именно это значит, поскольку не все приложения получат преимущества от новой архитектуры. Поддержка оперативной памяти DDR4 была полностью удалена, а это значит, что все материнские платы LGA 1851 теперь используют оперативную память DDR5.

Кроме того, интегрированный графический блок был улучшен и теперь основан на архитектуре Intel Xe. Это может обеспечить заметный прирост производительности, особенно в небольших системах, в которых нет места для выделенной видеокарты.

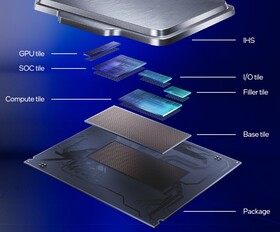
Intel Arrow-Lake-S: упаковка (Источник изображения: Intel)
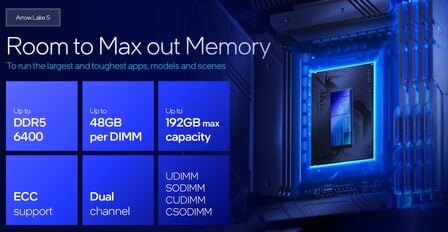
Поддержка оперативной памяти DDR5 (Источник изображения: Intel)
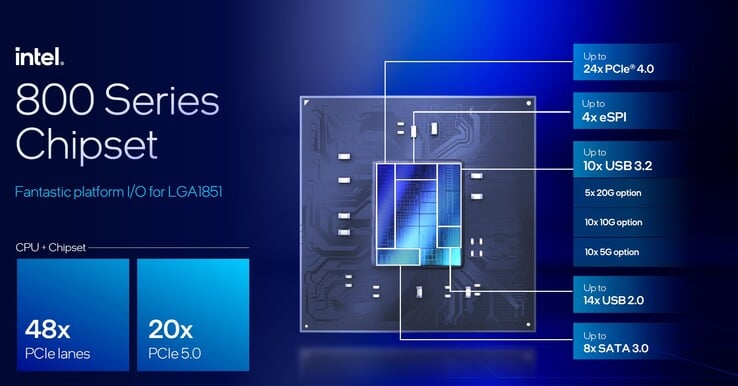
Чипсет Intel 800-й серии (Источник изображения: Intel)
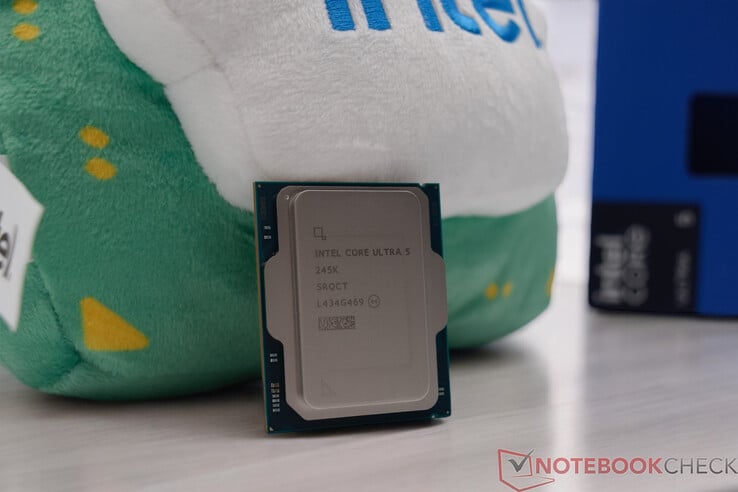
Intel Core Ultra 5 245K
Процессор
Intel Core Ultra 5 245K 14 x 3.6 - 5.2 GHz, 159 W PL2 / Short Burst, 159 W PL1 / Sustained, Arrow Lake-S
Графический адаптер
NVIDIA GeForce RTX 4090 - 24 Гбайт VRAM, Видеопр-р: 2610 МГц, Память: 1313 МГц, 450 W TDP, 565.9
ОЗУ
32 Гбайт 
, DDR5-6000 MT/s
Материнская плата
Intel Z890 (Arrow Lake-S PCH)
Хранение данных
Kingston KC3000 2048G SKC3000D2048G, 2048 Гбайт 
Операционная система
Microsoft Windows 11 Pro
Стоимость
309 USD
Amazon
Внимание: Разные образцы одной и той же модели часто используют неодинаковые компоненты! (Матрица AUO вместо BOE, память Hynix вместо Samsung, накопитель SATA вместо PCIe, ...)


Для бенчмарков и тестов мы использовали следующую систему:

  • Streacom BC1 V2 Open Benchtable
  • Intel Core Ultra 5 245K
  • Asus TUF Gaming Z890-PLUS Wi-Fi, BIOS: 0407
  • Пользовательский контур водяного охлаждения (помпа: Watercool WCP D5, радиатор: EK MO-RA3 420 Pro)
  • Palit GeForce RTX 4090 GameRock OC
  • EVGA SuperNOVA P+ 1600W
  • G.Skill Trident Z5 Neo DDR5-6000 2x 16 ГБ, EXPO (DDR5-6000 CL30-38-38-96)
  • Kingston KC3000 2 ТБ, M.2 2280 (ОС + синтетические бенчмарки)
  • Intel SSD DC P4618 - 6,4 ТБ (игры)
  • Microsoft Windows 11 Professional 64-bit (версия 24H2)

Процессоры Intel Arrow Lake S в сравнении

Модель Ядра /
Потоки
Тактовая частота P-Core / Turbo Тактовая частота E-Core / Turbo TBMT 3.0 Кэш L2 Intel Smart Cache iGPU (4 ядра Xe) NPU PBP MTP Цена (RRP)
Intel Core Ultra 9 285K 24 (8P + 16E) /24 3,7 ГГц / 5,5 ГГц 3,2 ГГц / 4,6 ГГц 5,6 ГГц 40 МБ 36 МБ 2,0 ГГц 13 TOPS 125 Вт 250 Вт 589 долл
Intel Core Ultra 7 265K 20 (8P + 12E) /20 3,9 ГГц / 5,4 ГГц 3,3 ГГц / 4,6 ГГц 5,6 ГГц 36 МБ 30 МБ ,.0 ГГц 13 TOPS 125 Вт 250 Вт 394 долл
Intel Core Ultra 7 265KF 20 (8P + 12E) /20 3,9 ГГц / 5,4 ГГц 3,3 ГГц / 4,6 ГГц 5,6 ГГц 36 МБ 30 МБ - 13 TOPS 125 Вт 250 Вт 379 долл
Intel Core Ultra 5 245K 14 (6P + 8E) /14 3,9 ГГц / 5,4 ГГц 4,2 ГГц / 5,2 ГГц 5,2 ГГц 26 МБ 24 МБ 1,9 ГГц 13 TOPS 125 ватт 159 ватт 309 долларов США
Intel Core Ultra 5 245KF 14 (6P + 8E) /14 3,9 ГГц / 5,4 ГГц 4,2 ГГц / 5,2 ГГц 5,2 ГГц 26 МБ 24 МБ - 13 TOPS 125 ватт 159 ватт 294 долл
Intel Core Ultra 5 245K
Комплект Intel Arrow Lake S
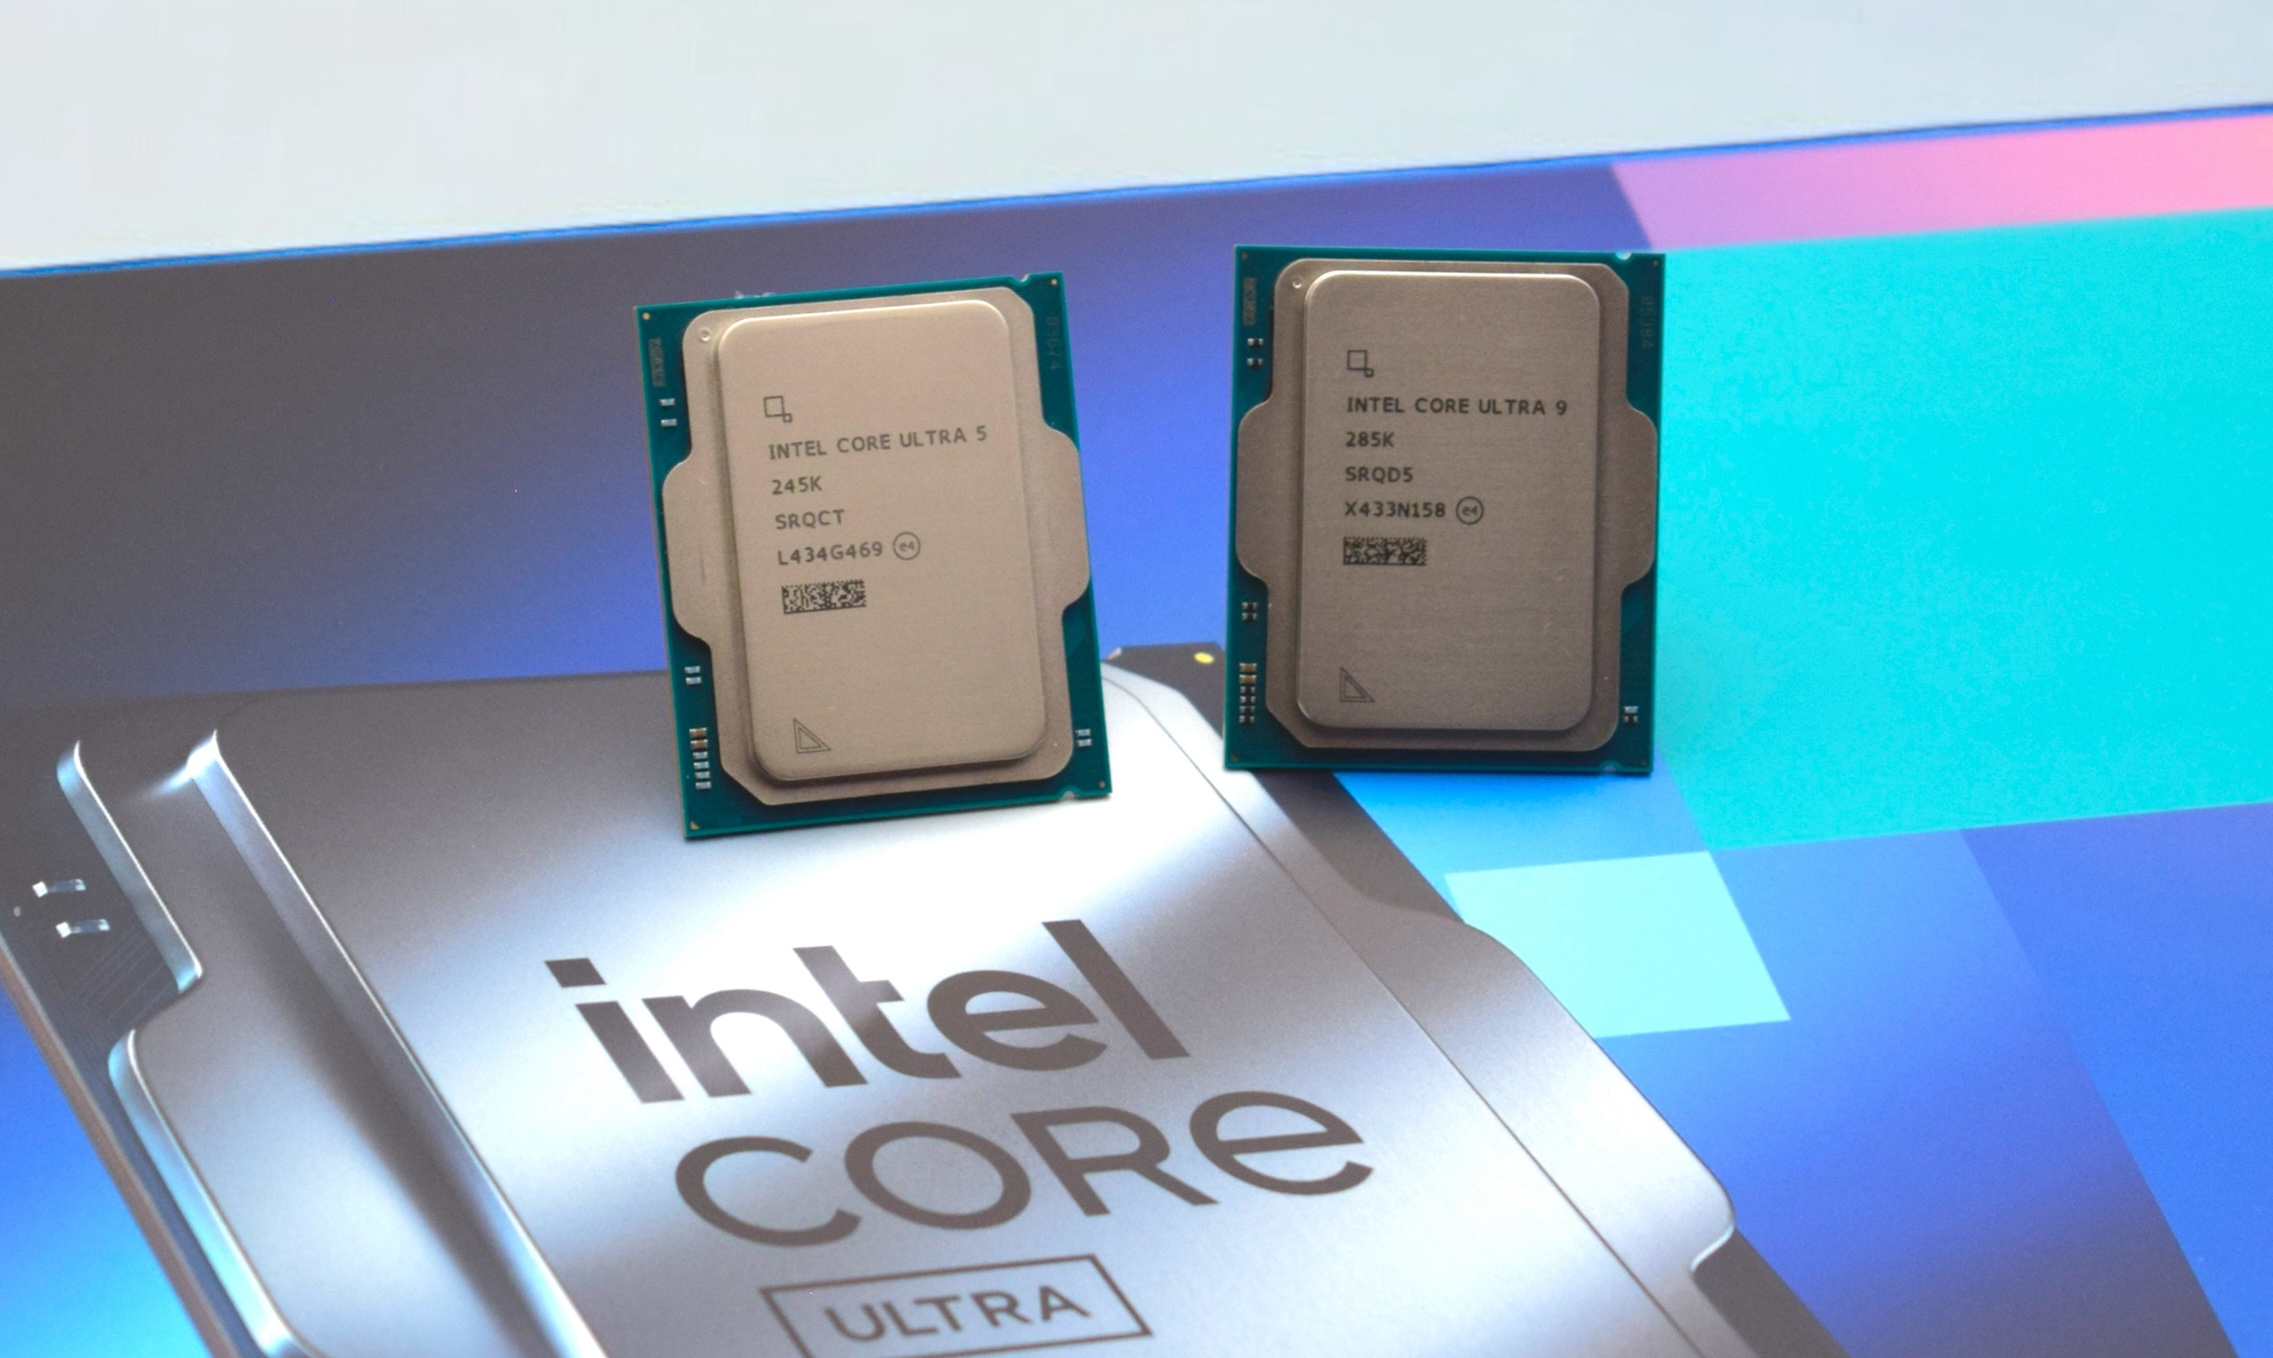
Intel Core Ultra 9 285K и Intel Core Ultra 5 245K
Intel Core Ultra 5 245K
Радиатор MO-RA3 420 Pro с насосом Watercool WCP-D5
Kingston KC3000 2 TB
Intel SSD DC P4618 - 6,4 ТБ

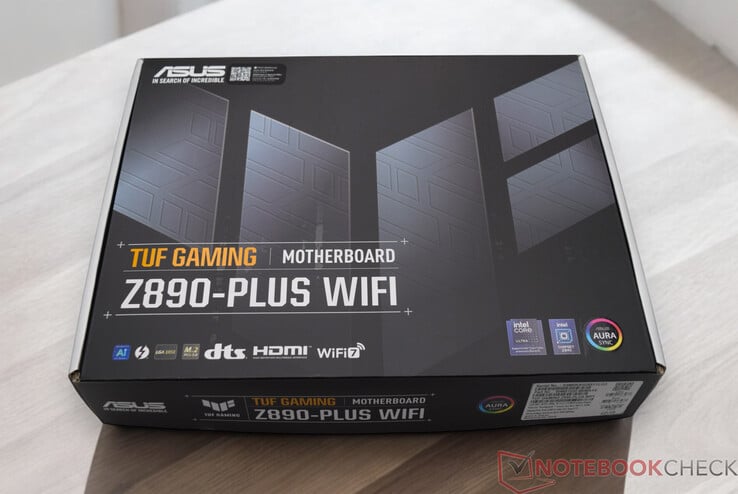
Asus TUF Gaming Z890-PLUS Wi-Fi

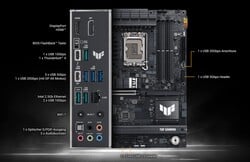
Asus TUF Gaming Z890-PLUS Wi-Fi: Подключения (Источник изображения: Asus)

Как уже упоминалось, все процессоры Arrow Lake-S используют новый сокет, а это значит, что появился и новый чипсет. Для этого теста компания Asus предоставила нам материнскую плату TUF Gaming Z890-PLUS Wi-Fi.

Чипсет Z890 впаян в материнскую плату, а это значит, что процессору доступно в общей сложности 48 линий PCIe.

Asus TUF Gaming Z890-PLUS Wi-Fi входит в серию TUF от Asus. Преимущественно черная материнская плата дополнена несколькими серебристыми акцентами, хотя на передней панели нет никаких подсвечивающихся элементов.

Однако RGB-подсветка отсутствует полностью: на задней панели расположено несколько светодиодов, которые также светятся, когда система не включена. Впрочем, это можно отключить в BIOS.

Asus TUF Gaming Z890-PLUS Wi-Fi поддерживает оперативную память DDR5 с высокой тактовой частотой до 8 600 МТ/с и выше. При полной загрузке всех четырех слотов ОЗУ можно установить до 192 ГБ. Однако следует обратить внимание на совместимость, поэтому стоит заранее проверить QVL (Qualified Vendor List) соответствующей материнской платы.

Материнская плата предлагает широкий спектр подключений, включая несколько портов USB 3 и один порт USB 4.0. Также имеется 2,5G LAN для подключения к проводной сети, хотя для беспроводной сети предлагается новейший стандарт Wi-Fi 7.

По всей плате расположены различные радиаторы, которые, с одной стороны, характеризуют внешний вид, но в основном предназначены для отвода тепла. Стоит отметить одну особенность: по крайней мере, радиатор SSD над слотом для видеокарты можно снять быстро и без инструментов.

Видеокарта также может быть разблокирована и извлечена из слота без каких-либо проблем с помощью Q-открытия. К сожалению, эта разборка без инструментов не является полной, поскольку радиатор в нижней части прикручен.

Asus TUF Gaming Z890-PLUS Wi-Fi продается на Amazon по цене €378 и на Amazon US по цене $320. Это означает, что в настоящее время производитель предлагает почти на 140 евро больше, чем Вы могли бы заплатить за Asus TUF Gaming Z790-Plus Wi-Fi.

Asus TUF Gaming Z890-PLUS Wi-Fi
WLAN-антенна Asus TUF Gaming Z890-PLUS Wi-Fi

Условия тестирования

Все тесты производительности мы проводили с энергетическим профилем Ultimate Performance. Мы также выбрали настройки Intel по умолчанию в BIOS.

Это означает, что Intel Core Ultra 5 245K работает в рамках спецификаций, заявленных производителем. В качестве охлаждающего устройства мы использовали пользовательскую контурную систему водяного охлаждения, которая уже использовалась в том же виде для предыдущих тестов производительности процессора.

Характеристики

Теперь давайте посмотрим на производительность Intel Core Ultra 5 245K в бенчмарках для необработанных процессоров. Сразу видно, что новый процессор Arrow Lake-S не может отличиться от своего предшественника.

При сравнении производительности Intel Core Ultra 5 245K находится на одном уровне с Intel Core i5-14600K. Оба процессора имеют 14 физических вычислительных блоков, которые разделены на 6 ядер P и 8 ядер E. Однако в своих последних процессорах Intel полностью отказалась от гиперпоточности.

Тем не менее, Intel удается достичь идентичной производительности при сравнении средней производительности процессора по сравнению с Intel Core i5-14600K может быть достигнута. Если мы вернемся еще дальше по временной шкале, то Intel Core Ultra 5 245K может даже конкурировать с бывшим флагманом 2021 года, процессором Intel Core i9-12900K.

В дуэли с AMD Intel Core Ultra 5 245K достигает производительности AMD Ryzen 7 9700Xкоторый является процессором 8C/16T.

В принципе, Intel Core Ultra 5 245K обеспечивает впечатляющую производительность, которая, при энергопотреблении 159 Вт, ниже, чем у моделей Core i5 предыдущих поколений. Это означает, что процессор не только работает гораздо эффективнее, но и легче охлаждается.

Вы можете найти больше бенчмарков для этих процессоров здесь.

CPU-Z
CPU-Z
CPU-Z
CPU-Z
CPU-Z
CPU-Z
Performance Rating - Percent
AMD Ryzen 9 9950X
Ryzen 9 9950X, 4300 МГц
82.1 pt
Intel Core i9-14900K
i9-14900K, 3200 МГц
81.9 pt
Intel Core i9-13900K
i9-13900K, 3000 МГц
79.6 pt
Intel Core Ultra 9 285K
Core Ultra 9 285K, 3200 МГц
79.4 pt
AMD Ryzen 9 7950X
R9 7950X, 4500 МГц
78.2 pt
AMD Ryzen 9 7950X3D
R9 7950X3D, 4200 МГц
78.1 pt
AMD Ryzen 9 7900X
R9 7900X, 4700 МГц
71.4 pt
Intel Core i5-14600K
i5-14600K, 3500 МГц
68.4 pt
AMD Ryzen 7 9700X
Ryzen 7 9700X, 3800 МГц
67.9 pt
Intel Core i9-12900K
i9-12900K, 3200 МГц
67.8 pt
Intel Core Ultra 5 245K
Core Ultra 5 245K, 3600 МГц
67.6 pt
AMD Ryzen 9 5950X
R9 5950X, 3400 МГц
66.7 pt
Intel Core i5-13600K
i5-13600K, 3500 МГц
66.4 pt
AMD Ryzen 5 9600X
Ryzen 5 9600X, 3900 МГц
64.1 pt
AMD Ryzen 7 7800X3D
R7 7800X3D, 4200 МГц
63.7 pt
AMD Ryzen 5 7600X
R5 7600X, 4700 МГц
61.5 pt
Intel Core i5-12600K
i5-12600K, 2800 МГц
59.4 pt
Intel Core i5-13400
i5-13400, 2500 МГц
56.8 pt
Intel Core i5-12400F
i5-12400F, 2500 МГц
52.1 pt
Cinebench R23
Single Core
Intel Core i9-14900K
i9-14900K, 3200 МГц
2351 Points +10%
Intel Core Ultra 9 285K
Core Ultra 9 285K, 3200 МГц
2342 Points +10%
Intel Core i9-13900K
i9-13900K, 3000 МГц
2267 Points +6%
AMD Ryzen 7 9700X
Ryzen 7 9700X, 3800 МГц
2211 Points +4%
AMD Ryzen 9 9950X
Ryzen 9 9950X, 4300 МГц
2202 Points +3%
AMD Ryzen 5 9600X
Ryzen 5 9600X, 3900 МГц
2180 Points +2%
Intel Core Ultra 5 245K
Core Ultra 5 245K, 3600 МГц
2132 Points
Intel Core i5-14600K
i5-14600K, 3500 МГц
2064 Points -3%
AMD Ryzen 9 7950X3D
R9 7950X3D, 4200 МГц
2053 Points -4%
AMD Ryzen 9 7950X
R9 7950X, 4500 МГц
2045 Points -4%
AMD Ryzen 9 7900X
R9 7900X, 4700 МГц
2039 Points -4%
Intel Core i5-13600K
i5-13600K, 3500 МГц
2010 Points -6%
Intel Core i9-12900K
i9-12900K, 3200 МГц
1998 Points -6%
AMD Ryzen 5 7600X
R5 7600X, 4700 МГц
1967 Points -8%
Intel Core i5-12600K
i5-12600K, 2800 МГц
1907 Points -11%
AMD Ryzen 7 7800X3D
R7 7800X3D, 4200 МГц
1820 Points -15%
Intel Core i5-13400
i5-13400, 2500 МГц
1786 Points -16%
Intel Core i5-12400F
i5-12400F, 2500 МГц
1680 Points -21%
AMD Ryzen 9 5950X
R9 5950X, 3400 МГц
1649 Points -23%
Multi Core
Intel Core Ultra 9 285K
Core Ultra 9 285K, 3200 МГц
42522 Points +70%
Intel Core i9-14900K
i9-14900K, 3200 МГц
41193 Points +64%
AMD Ryzen 9 9950X
Ryzen 9 9950X, 4300 МГц
40924 Points +63%
Intel Core i9-13900K
i9-13900K, 3000 МГц
40103 Points +60%
AMD Ryzen 9 7950X
R9 7950X, 4500 МГц
37792 Points +51%
AMD Ryzen 9 7950X3D
R9 7950X3D, 4200 МГц
36291 Points +45%
AMD Ryzen 9 7900X
R9 7900X, 4700 МГц
29480 Points +18%
AMD Ryzen 9 5950X
R9 5950X, 3400 МГц
27062 Points +8%
Intel Core i9-12900K
i9-12900K, 3200 МГц
27005 Points +8%
Intel Core Ultra 5 245K
Core Ultra 5 245K, 3600 МГц
25066 Points
Intel Core i5-14600K
i5-14600K, 3500 МГц
24491 Points -2%
Intel Core i5-13600K
i5-13600K, 3500 МГц
24268 Points -3%
AMD Ryzen 7 9700X
Ryzen 7 9700X, 3800 МГц
20485 Points -18%
AMD Ryzen 7 7800X3D
R7 7800X3D, 4200 МГц
18086 Points -28%
Intel Core i5-12600K
i5-12600K, 2800 МГц
17491 Points -30%
AMD Ryzen 5 9600X
Ryzen 5 9600X, 3900 МГц
17176 Points -31%
Intel Core i5-13400
i5-13400, 2500 МГц
15953 Points -36%
AMD Ryzen 5 7600X
R5 7600X, 4700 МГц
15322 Points -39%
Intel Core i5-12400F
i5-12400F, 2500 МГц
12380 Points -51%
Cinebench R20
CPU (Single Core)
Intel Core i9-14900K
i9-14900K, 3200 МГц
900 Points +10%
Intel Core Ultra 9 285K
Core Ultra 9 285K, 3200 МГц
899 Points +10%
AMD Ryzen 9 9950X
Ryzen 9 9950X, 4300 МГц
871 Points +6%
AMD Ryzen 7 9700X
Ryzen 7 9700X, 3800 МГц
870 Points +6%
AMD Ryzen 5 9600X
Ryzen 5 9600X, 3900 МГц
858 Points +5%
Intel Core i9-13900K
i9-13900K, 3000 МГц
828 Points +1%
Intel Core Ultra 5 245K
Core Ultra 5 245K, 3600 МГц
820 Points
AMD Ryzen 9 7950X
R9 7950X, 4500 МГц
795 Points -3%
AMD Ryzen 9 7950X3D
R9 7950X3D, 4200 МГц
795 Points -3%
Intel Core i5-14600K
i5-14600K, 3500 МГц
790 Points -4%
AMD Ryzen 9 7900X
R9 7900X, 4700 МГц
786 Points -4%
Intel Core i5-13600K
i5-13600K, 3500 МГц
775 Points -5%
Intel Core i9-12900K
i9-12900K, 3200 МГц
766 Points -7%
AMD Ryzen 5 7600X
R5 7600X, 4700 МГц
761 Points -7%
Intel Core i5-12600K
i5-12600K, 2800 МГц
734 Points -10%
AMD Ryzen 7 7800X3D
R7 7800X3D, 4200 МГц
709 Points -14%
Intel Core i5-13400
i5-13400, 2500 МГц
688 Points -16%
Intel Core i5-12400F
i5-12400F, 2500 МГц
653 Points -20%
AMD Ryzen 9 5950X
R9 5950X, 3400 МГц
641 Points -22%
CPU (Multi Core)
Intel Core Ultra 9 285K
Core Ultra 9 285K, 3200 МГц
16623 Points +70%
AMD Ryzen 9 9950X
Ryzen 9 9950X, 4300 МГц
15788 Points +62%
Intel Core i9-14900K
i9-14900K, 3200 МГц
15466 Points +59%
Intel Core i9-13900K
i9-13900K, 3000 МГц
15181 Points +56%
AMD Ryzen 9 7950X
R9 7950X, 4500 МГц
14786 Points +52%
AMD Ryzen 9 7950X3D
R9 7950X3D, 4200 МГц
14188 Points +45%
AMD Ryzen 9 7900X
R9 7900X, 4700 МГц
11563 Points +19%
AMD Ryzen 9 5950X
R9 5950X, 3400 МГц
10482 Points +7%
Intel Core i9-12900K
i9-12900K, 3200 МГц
10240 Points +5%
Intel Core Ultra 5 245K
Core Ultra 5 245K, 3600 МГц
9752 Points
Intel Core i5-14600K
i5-14600K, 3500 МГц
9371 Points -4%
Intel Core i5-13600K
i5-13600K, 3500 МГц
9265 Points -5%
AMD Ryzen 7 9700X
Ryzen 7 9700X, 3800 МГц
7956 Points -18%
AMD Ryzen 7 7800X3D
R7 7800X3D, 4200 МГц
7121 Points -27%
AMD Ryzen 5 9600X
Ryzen 5 9600X, 3900 МГц
6719 Points -31%
Intel Core i5-12600K
i5-12600K, 2800 МГц
6692 Points -31%
Intel Core i5-13400
i5-13400, 2500 МГц
6135 Points -37%
AMD Ryzen 5 7600X
R5 7600X, 4700 МГц
5985 Points -39%
Intel Core i5-12400F
i5-12400F, 2500 МГц
4740 Points -51%
Cinebench R15
CPU Single 64Bit
Intel Core Ultra 9 285K
Core Ultra 9 285K, 3200 МГц
355 Points +10%
AMD Ryzen 7 9700X
Ryzen 7 9700X, 3800 МГц
346 Points +7%
AMD Ryzen 9 9950X
Ryzen 9 9950X, 4300 МГц
344 Points +7%
AMD Ryzen 5 9600X
Ryzen 5 9600X, 3900 МГц
341 Points +6%
Intel Core i9-14900K
i9-14900K, 3200 МГц
332 Points +3%
AMD Ryzen 9 7950X
R9 7950X, 4500 МГц
328 Points +2%
Intel Core i9-13900K
i9-13900K, 3000 МГц
327 Points +2%
AMD Ryzen 9 7950X3D
R9 7950X3D, 4200 МГц
326 Points +1%
AMD Ryzen 9 7900X
R9 7900X, 4700 МГц
324 Points +1%
Intel Core Ultra 5 245K
Core Ultra 5 245K, 3600 МГц
322 Points
AMD Ryzen 5 7600X
R5 7600X, 4700 МГц
315 Points -2%
Intel Core i5-14600K
i5-14600K, 3500 МГц
297 Points -8%
AMD Ryzen 7 7800X3D
R7 7800X3D, 4200 МГц
291 Points -10%
Intel Core i5-13600K
i5-13600K, 3500 МГц
289 Points -10%
Intel Core i9-12900K
i9-12900K, 3200 МГц
286 Points -11%
Intel Core i5-12600K
i5-12600K, 2800 МГц
275 Points -15%
AMD Ryzen 9 5950X
R9 5950X, 3400 МГц
272 Points -16%
Intel Core i5-13400
i5-13400, 2500 МГц
257 Points -20%
Intel Core i5-12400F
i5-12400F, 2500 МГц
244 Points -24%
CPU Multi 64Bit
Intel Core Ultra 9 285K
Core Ultra 9 285K, 3200 МГц
6396 Points +66%
AMD Ryzen 9 9950X
Ryzen 9 9950X, 4300 МГц
6335 (6262.72min - 6335.13max) Points +65%
Intel Core i9-14900K
i9-14900K, 3200 МГц
6282 Points +63%
AMD Ryzen 9 7950X
R9 7950X, 4500 МГц
6209 Points +61%
Intel Core i9-13900K
i9-13900K, 3000 МГц
6191 Points +61%
AMD Ryzen 9 7950X3D
R9 7950X3D, 4200 МГц
5974 Points +55%
AMD Ryzen 9 7900X
R9 7900X, 4700 МГц
4856 Points +26%
AMD Ryzen 9 5950X
R9 5950X, 3400 МГц
4492 Points +17%
Intel Core i9-12900K
i9-12900K, 3200 МГц
4057 Points +5%
Intel Core Ultra 5 245K
Core Ultra 5 245K, 3600 МГц
3850 Points
Intel Core i5-13600K
i5-13600K, 3500 МГц
3643 Points -5%
Intel Core i5-14600K
i5-14600K, 3500 МГц
3640 Points -5%
AMD Ryzen 7 9700X
Ryzen 7 9700X, 3800 МГц
3178 (3067.25min - 3120.37max) Points -17%
AMD Ryzen 7 7800X3D
R7 7800X3D, 4200 МГц
2974 Points -23%
AMD Ryzen 5 9600X
Ryzen 5 9600X, 3900 МГц
2630 Points -32%
Intel Core i5-12600K
i5-12600K, 2800 МГц
2555 Points -34%
AMD Ryzen 5 7600X
R5 7600X, 4700 МГц
2507 Points -35%
Intel Core i5-13400
i5-13400, 2500 МГц
2358 Points -39%
Intel Core i5-12400F
i5-12400F, 2500 МГц
1759 Points -54%
Cinebench R11.5
CPU Single 64Bit
Intel Core Ultra 9 285K
Core Ultra 9 285K, 3200 МГц
4.17 Points +8%
AMD Ryzen 7 9700X
Ryzen 7 9700X, 3800 МГц
4.06 Points +5%
AMD Ryzen 9 9950X
Ryzen 9 9950X, 4300 МГц
4.03 Points +5%
Intel Core i9-14900K
i9-14900K, 3200 МГц
4.02 Points +4%
AMD Ryzen 5 9600X
Ryzen 5 9600X, 3900 МГц
4 Points +4%
Intel Core i9-13900K
i9-13900K, 3000 МГц
3.92 Points +2%
AMD Ryzen 9 7950X
R9 7950X, 4500 МГц
3.86 Points 0%
AMD Ryzen 9 7950X3D
R9 7950X3D, 4200 МГц
3.86 Points 0%
Intel Core Ultra 5 245K
Core Ultra 5 245K, 3600 МГц
3.85 Points
AMD Ryzen 9 7900X
R9 7900X, 4700 МГц
3.83 Points -1%
AMD Ryzen 5 7600X
R5 7600X, 4700 МГц
3.72 Points -3%
Intel Core i5-14600K
i5-14600K, 3500 МГц
3.58 Points -7%
Intel Core i9-12900K
i9-12900K, 3200 МГц
3.49 Points -9%
Intel Core i5-13600K
i5-13600K, 3500 МГц
3.48 Points -10%
AMD Ryzen 7 7800X3D
R7 7800X3D, 4200 МГц
3.43 Points -11%
Intel Core i5-12600K
i5-12600K, 2800 МГц
3.31 Points -14%
AMD Ryzen 9 5950X
R9 5950X, 3400 МГц
3.14 Points -18%
Intel Core i5-13400
i5-13400, 2500 МГц
3.1 Points -19%
Intel Core i5-12400F
i5-12400F, 2500 МГц
2.95 Points -23%
CPU Multi 64Bit
Intel Core Ultra 9 285K
Core Ultra 9 285K, 3200 МГц
77.29 Points +63%
AMD Ryzen 9 9950X
Ryzen 9 9950X, 4300 МГц
72.28 Points +52%
Intel Core i9-14900K
i9-14900K, 3200 МГц
72.24 Points +52%
Intel Core i9-13900K
i9-13900K, 3000 МГц
70.78 Points +49%
AMD Ryzen 9 7950X
R9 7950X, 4500 МГц
68.61 Points +44%
AMD Ryzen 9 7950X3D
R9 7950X3D, 4200 МГц
64.59 Points +36%
AMD Ryzen 9 7900X
R9 7900X, 4700 МГц
54.51 Points +15%
AMD Ryzen 9 5950X
R9 5950X, 3400 МГц
49.6 Points +4%
Intel Core Ultra 5 245K
Core Ultra 5 245K, 3600 МГц
47.55 Points
Intel Core i9-12900K
i9-12900K, 3200 МГц
47.06 Points -1%
Intel Core i5-13600K
i5-13600K, 3500 МГц
42.38 Points -11%
Intel Core i5-14600K
i5-14600K, 3500 МГц
40.96 Points -14%
AMD Ryzen 7 9700X
Ryzen 7 9700X, 3800 МГц
36.24 Points -24%
AMD Ryzen 7 7800X3D
R7 7800X3D, 4200 МГц
33.48 Points -30%
AMD Ryzen 5 9600X
Ryzen 5 9600X, 3900 МГц
30.86 Points -35%
Intel Core i5-12600K
i5-12600K, 2800 МГц
30.01 Points -37%
AMD Ryzen 5 7600X
R5 7600X, 4700 МГц
28.41 Points -40%
Intel Core i5-13400
i5-13400, 2500 МГц
27.36 Points -42%
Intel Core i5-12400F
i5-12400F, 2500 МГц
20.39 Points -57%
Blender - v2.79 BMW27 CPU
Intel Core i5-12400F
i5-12400F, 2500 МГц
269 Seconds * -98%
Intel Core i5-13400
i5-13400, 2500 МГц
206 Seconds * -51%
AMD Ryzen 5 7600X
R5 7600X, 4700 МГц
203 Seconds * -49%
Intel Core i5-12600K
i5-12600K, 2800 МГц
189.5 Seconds * -39%
AMD Ryzen 5 9600X
Ryzen 5 9600X, 3900 МГц
184 Seconds * -35%
AMD Ryzen 7 7800X3D
R7 7800X3D, 4200 МГц
169 Seconds * -24%
AMD Ryzen 7 9700X
Ryzen 7 9700X, 3800 МГц
154 Seconds * -13%
Intel Core Ultra 5 245K
Core Ultra 5 245K, 3600 МГц
136 Seconds *
Intel Core i5-13600K
i5-13600K, 3500 МГц
135 Seconds * +1%
Intel Core i5-14600K
i5-14600K, 3500 МГц
134 Seconds * +1%
Intel Core i9-12900K
i9-12900K, 3200 МГц
121.1 Seconds * +11%
AMD Ryzen 9 5950X
R9 5950X, 3400 МГц
112.8 Seconds * +17%
AMD Ryzen 9 7900X
R9 7900X, 4700 МГц
106 Seconds * +22%
AMD Ryzen 9 7950X3D
R9 7950X3D, 4200 МГц
86 Seconds * +37%
AMD Ryzen 9 7950X
R9 7950X, 4500 МГц
85 Seconds * +37%
Intel Core i9-13900K
i9-13900K, 3000 МГц
80 Seconds * +41%
Intel Core i9-14900K
i9-14900K, 3200 МГц
80 Seconds * +41%
Intel Core Ultra 9 285K
Core Ultra 9 285K, 3200 МГц
79 Seconds * +42%
AMD Ryzen 9 9950X
Ryzen 9 9950X, 4300 МГц
77 Seconds * +43%
wPrime 2.10
32m
Intel Core i9-12900K
i9-12900K, 3200 МГц
4.924 s * -65%
Intel Core i5-12600K
i5-12600K, 2800 МГц
4.725 s * -59%
Intel Core i5-12400F
i5-12400F, 2500 МГц
4.078 s * -37%
Intel Core i5-13400
i5-13400, 2500 МГц
3.474 s * -17%
Intel Core Ultra 5 245K
Core Ultra 5 245K, 3600 МГц
2.976 s *
AMD Ryzen 5 7600X
R5 7600X, 4700 МГц
2.78 s * +7%
AMD Ryzen 5 9600X
Ryzen 5 9600X, 3900 МГц
2.617 s * +12%
AMD Ryzen 9 5950X
R9 5950X, 3400 МГц
2.538 s * +15%
Intel Core i5-13600K
i5-13600K, 3500 МГц
2.527 s * +15%
AMD Ryzen 7 7800X3D
R7 7800X3D, 4200 МГц
2.435 s * +18%
Intel Core i5-14600K
i5-14600K, 3500 МГц
2.39 s * +20%
AMD Ryzen 7 9700X
Ryzen 7 9700X, 3800 МГц
2.36 s * +21%
Intel Core Ultra 9 285K
Core Ultra 9 285K, 3200 МГц
2.197 s * +26%
AMD Ryzen 9 9950X
Ryzen 9 9950X, 4300 МГц
2.077 s * +30%
Intel Core i9-14900K
i9-14900K, 3200 МГц
2.07 s * +30%
AMD Ryzen 9 7950X3D
R9 7950X3D, 4200 МГц
2.007 s * +33%
Intel Core i9-13900K
i9-13900K, 3000 МГц
1.818 s * +39%
AMD Ryzen 9 7900X
R9 7900X, 4700 МГц
1.781 s * +40%
AMD Ryzen 9 7950X
R9 7950X, 4500 МГц
1.669 s * +44%
1024m
Intel Core i5-13400
i5-13400, 2500 МГц
452.309 s * -482%
Intel Core i5-12600K
i5-12600K, 2800 МГц
202.7 s * -161%
Intel Core i9-12900K
i9-12900K, 3200 МГц
190.6 s * -145%
Intel Core i5-13600K
i5-13600K, 3500 МГц
177.592 s * -128%
Intel Core i5-14600K
i5-14600K, 3500 МГц
158.77 s * -104%
Intel Core i5-12400F
i5-12400F, 2500 МГц
112.849 s * -45%
Intel Core i9-13900K
i9-13900K, 3000 МГц
79.738 s * -3%
Intel Core Ultra 5 245K
Core Ultra 5 245K, 3600 МГц
77.721 s *
AMD Ryzen 5 7600X
R5 7600X, 4700 МГц
74.491 s * +4%
Intel Core i9-14900K
i9-14900K, 3200 МГц
74.47 s * +4%
AMD Ryzen 5 9600X
Ryzen 5 9600X, 3900 МГц
72.546 s * +7%
AMD Ryzen 9 5950X
R9 5950X, 3400 МГц
64.9 s * +16%
AMD Ryzen 7 7800X3D
R7 7800X3D, 4200 МГц
62.733 s * +19%
AMD Ryzen 7 9700X
Ryzen 7 9700X, 3800 МГц
59.56 s * +23%
Intel Core Ultra 9 285K
Core Ultra 9 285K, 3200 МГц
48.806 s * +37%
AMD Ryzen 9 7900X
R9 7900X, 4700 МГц
39.954 s * +49%
AMD Ryzen 9 7950X3D
R9 7950X3D, 4200 МГц
33.879 s * +56%
AMD Ryzen 9 7950X
R9 7950X, 4500 МГц
30.811 s * +60%
AMD Ryzen 9 9950X
Ryzen 9 9950X, 4300 МГц
29.318 s * +62%
X264 HD Benchmark 4.0
Pass 1
Intel Core i9-14900K
i9-14900K, 3200 МГц
433.5 (424min - 434max) fps +12%
Intel Core Ultra 9 285K
Core Ultra 9 285K, 3200 МГц
422 (421min - 423max) fps +9%
Intel Core i9-13900K
i9-13900K, 3000 МГц
412 (410min - 417max) fps +6%
Intel Core i5-14600K
i5-14600K, 3500 МГц
411 (410min - 412max) fps +6%
AMD Ryzen 9 7950X3D
R9 7950X3D, 4200 МГц
392.5 (391min - 397max) fps +1%
AMD Ryzen 9 9950X
Ryzen 9 9950X, 4300 МГц
392 (392min - 393max) fps +1%
Intel Core Ultra 5 245K
Core Ultra 5 245K, 3600 МГц
388.5 (387min - 390max) fps
Intel Core i5-13600K
i5-13600K, 3500 МГц
388 (386min - 388max) fps 0%
AMD Ryzen 9 7950X
R9 7950X, 4500 МГц
379.5 (378min - 385max) fps -2%
AMD Ryzen 9 7900X
R9 7900X, 4700 МГц
376 (369min - 378max) fps -3%
AMD Ryzen 7 9700X
Ryzen 7 9700X, 3800 МГц
376 (374min - 376max) fps -3%
Intel Core i9-12900K
i9-12900K, 3200 МГц
368.5 (366min - 369max) fps -5%
AMD Ryzen 5 7600X
R5 7600X, 4700 МГц
367 (363min - 371max) fps -6%
AMD Ryzen 5 9600X
Ryzen 5 9600X, 3900 МГц
364 (361min - 367max) fps -6%
AMD Ryzen 7 7800X3D
R7 7800X3D, 4200 МГц
344 (339min - 346max) fps -11%
AMD Ryzen 9 5950X
R9 5950X, 3400 МГц
338.5 (337min - 340max) fps -13%
Intel Core i5-12600K
i5-12600K, 2800 МГц
333.5 (332min - 336max) fps -14%
Intel Core i5-13400
i5-13400, 2500 МГц
311 (310min - 312max) fps -20%
Intel Core i5-12400F
i5-12400F, 2500 МГц
252.5 (249min - 256max) fps -35%
Pass 2
Intel Core Ultra 9 285K
Core Ultra 9 285K, 3200 МГц
296.5 (296min - 298max) fps +37%
Intel Core i9-14900K
i9-14900K, 3200 МГц
286.5 (285min - 287max) fps +32%
AMD Ryzen 9 9950X
Ryzen 9 9950X, 4300 МГц
271 (271min - 272max) fps +25%
Intel Core i9-13900K
i9-13900K, 3000 МГц
267 (266min - 271max) fps +23%
AMD Ryzen 9 7950X
R9 7950X, 4500 МГц
266.5 (263min - 267max) fps +23%
AMD Ryzen 9 7950X3D
R9 7950X3D, 4200 МГц
265.5 (263min - 266max) fps +23%
AMD Ryzen 9 7900X
R9 7900X, 4700 МГц
241 (240min - 242max) fps +11%
AMD Ryzen 9 5950X
R9 5950X, 3400 МГц
221 (220min - 221max) fps +2%
Intel Core Ultra 5 245K
Core Ultra 5 245K, 3600 МГц
216.5 (215min - 217max) fps
Intel Core i5-14600K
i5-14600K, 3500 МГц
209 (208min - 209max) fps -3%
Intel Core i9-12900K
i9-12900K, 3200 МГц
206 (206min - 206max) fps -5%
Intel Core i5-13600K
i5-13600K, 3500 МГц
199 (198.5min - 199.4max) fps -8%
AMD Ryzen 7 9700X
Ryzen 7 9700X, 3800 МГц
176.05 (175.9min - 176.1max) fps -19%
AMD Ryzen 7 7800X3D
R7 7800X3D, 4200 МГц
169.25 (169.1min - 170max) fps -22%
AMD Ryzen 5 9600X
Ryzen 5 9600X, 3900 МГц
154 (153.4min - 154.3max) fps -29%
Intel Core i5-12600K
i5-12600K, 2800 МГц
148 (147min - 148max) fps -32%
AMD Ryzen 5 7600X
R5 7600X, 4700 МГц
147.8 (147.7min - 147.9max) fps -32%
Intel Core i5-13400
i5-13400, 2500 МГц
135.8 (135.7min - 135.9max) fps -37%
Intel Core i5-12400F
i5-12400F, 2500 МГц
101.35 (101.1min - 101.5max) fps -53%
WinRAR - Result
AMD Ryzen 9 7900X
R9 7900X, 4700 МГц
17225 KB/s +64%
AMD Ryzen 7 7800X3D
R7 7800X3D, 4200 МГц
16585 KB/s +58%
AMD Ryzen 9 7950X
R9 7950X, 4500 МГц
16351 KB/s +55%
AMD Ryzen 5 7600X
R5 7600X, 4700 МГц
16178 KB/s +54%
Intel Core i9-14900K
i9-14900K, 3200 МГц
16108 KB/s +53%
AMD Ryzen 9 7950X3D
R9 7950X3D, 4200 МГц
15779 KB/s +50%
Intel Core i9-13900K
i9-13900K, 3000 МГц
14836 KB/s +41%
AMD Ryzen 5 9600X
Ryzen 5 9600X, 3900 МГц
14819 KB/s +41%
AMD Ryzen 9 9950X
Ryzen 9 9950X, 4300 МГц
13778 KB/s +31%
AMD Ryzen 7 9700X
Ryzen 7 9700X, 3800 МГц
13549 KB/s +29%
Intel Core Ultra 9 285K
Core Ultra 9 285K, 3200 МГц
12599 KB/s +20%
AMD Ryzen 9 5950X
R9 5950X, 3400 МГц
12503 KB/s +19%
Intel Core i5-14600K
i5-14600K, 3500 МГц
11491 KB/s +9%
Intel Core i5-13600K
i5-13600K, 3500 МГц
10937 KB/s +4%
Intel Core i9-12900K
i9-12900K, 3200 МГц
10792 KB/s +3%
Intel Core Ultra 5 245K
Core Ultra 5 245K, 3600 МГц
10521 KB/s
Intel Core i5-13400
i5-13400, 2500 МГц
7979 KB/s -24%
Intel Core i5-12400F
i5-12400F, 2500 МГц
7816 KB/s -26%
Intel Core i5-12600K
i5-12600K, 2800 МГц
6239 KB/s -41%
TrueCrypt
AES Mean 100MB
AMD Ryzen 9 9950X
Ryzen 9 9950X, 4300 МГц
32.4 GB/s +98%
AMD Ryzen 9 7950X
R9 7950X, 4500 МГц
30.7 GB/s +87%
Intel Core i9-13900K
i9-13900K, 3000 МГц
27 GB/s +65%
AMD Ryzen 9 5950X
R9 5950X, 3400 МГц
26.9 GB/s +64%
AMD Ryzen 9 7950X3D
R9 7950X3D, 4200 МГц
26.9 GB/s +64%
Intel Core i9-14900K
i9-14900K, 3200 МГц
26.7 GB/s +63%
Intel Core i5-14600K
i5-14600K, 3500 МГц
19.5 GB/s +19%
Intel Core i5-13600K
i5-13600K, 3500 МГц
18.8 GB/s +15%
Intel Core i9-12900K
i9-12900K, 3200 МГц
18.5 GB/s +13%
Intel Core Ultra 5 245K
Core Ultra 5 245K, 3600 МГц
16.4 GB/s
AMD Ryzen 7 9700X
Ryzen 7 9700X, 3800 МГц
16.1 GB/s -2%
Intel Core Ultra 9 285K
Core Ultra 9 285K, 3200 МГц
16 GB/s -2%
AMD Ryzen 7 7800X3D
R7 7800X3D, 4200 МГц
15.3 GB/s -7%
AMD Ryzen 9 7900X
R9 7900X, 4700 МГц
14.8 GB/s -10%
AMD Ryzen 5 9600X
Ryzen 5 9600X, 3900 МГц
13.4 GB/s -18%
AMD Ryzen 5 7600X
R5 7600X, 4700 МГц
13.2 GB/s -20%
Intel Core i5-12600K
i5-12600K, 2800 МГц
12.8 GB/s -22%
Intel Core i5-13400
i5-13400, 2500 МГц
11.8 GB/s -28%
Intel Core i5-12400F
i5-12400F, 2500 МГц
9.3 GB/s -43%
Twofish Mean 100MB
Intel Core i9-14900K
i9-14900K, 3200 МГц
5.8 GB/s +93%
AMD Ryzen 9 9950X
Ryzen 9 9950X, 4300 МГц
5.6 GB/s +87%
Intel Core i9-13900K
i9-13900K, 3000 МГц
5.4 GB/s +80%
Intel Core Ultra 9 285K
Core Ultra 9 285K, 3200 МГц
4.9 GB/s +63%
AMD Ryzen 9 7950X
R9 7950X, 4500 МГц
4.5 GB/s +50%
AMD Ryzen 9 7950X3D
R9 7950X3D, 4200 МГц
4.2 GB/s +40%
AMD Ryzen 9 5950X
R9 5950X, 3400 МГц
3.7 GB/s +23%
Intel Core i9-12900K
i9-12900K, 3200 МГц
3.7 GB/s +23%
Intel Core i5-14600K
i5-14600K, 3500 МГц
3.4 GB/s +13%
Intel Core i5-13600K
i5-13600K, 3500 МГц
3.1 GB/s +3%
Intel Core Ultra 5 245K
Core Ultra 5 245K, 3600 МГц
3 GB/s
AMD Ryzen 9 7900X
R9 7900X, 4700 МГц
2.8 GB/s -7%
AMD Ryzen 7 9700X
Ryzen 7 9700X, 3800 МГц
2.8 GB/s -7%
Intel Core i5-12600K
i5-12600K, 2800 МГц
2.2 GB/s -27%
AMD Ryzen 5 9600X
Ryzen 5 9600X, 3900 МГц
2.2 GB/s -27%
AMD Ryzen 7 7800X3D
R7 7800X3D, 4200 МГц
2.1 GB/s -30%
Intel Core i5-13400
i5-13400, 2500 МГц
2 GB/s -33%
AMD Ryzen 5 7600X
R5 7600X, 4700 МГц
1.8 GB/s -40%
Intel Core i5-12400F
i5-12400F, 2500 МГц
1.4 GB/s -53%
Serpent Mean 100MB
AMD Ryzen 9 9950X
Ryzen 9 9950X, 4300 МГц
3.4 GB/s +127%
Intel Core i9-13900K
i9-13900K, 3000 МГц
3 GB/s +100%
AMD Ryzen 9 7950X
R9 7950X, 4500 МГц
2.8 GB/s +87%
AMD Ryzen 9 7950X3D
R9 7950X3D, 4200 МГц
2.8 GB/s +87%
Intel Core i9-14900K
i9-14900K, 3200 МГц
2.8 GB/s +87%
AMD Ryzen 9 5950X
R9 5950X, 3400 МГц
2.4 GB/s +60%
Intel Core Ultra 9 285K
Core Ultra 9 285K, 3200 МГц
2.3 GB/s +53%
Intel Core i9-12900K
i9-12900K, 3200 МГц
1.9 GB/s +27%
Intel Core i5-14600K
i5-14600K, 3500 МГц
1.8 GB/s +20%
Intel Core i5-13600K
i5-13600K, 3500 МГц
1.7 GB/s +13%
AMD Ryzen 7 9700X
Ryzen 7 9700X, 3800 МГц
1.7 GB/s +13%
AMD Ryzen 9 7900X
R9 7900X, 4700 МГц
1.5 GB/s 0%
Intel Core Ultra 5 245K
Core Ultra 5 245K, 3600 МГц
1.5 GB/s
AMD Ryzen 5 9600X
Ryzen 5 9600X, 3900 МГц
1.4 GB/s -7%
Intel Core i5-12600K
i5-12600K, 2800 МГц
1.3 GB/s -13%
AMD Ryzen 7 7800X3D
R7 7800X3D, 4200 МГц
1.3 GB/s -13%
Intel Core i5-13400
i5-13400, 2500 МГц
1.2 GB/s -20%
AMD Ryzen 5 7600X
R5 7600X, 4700 МГц
1.1 GB/s -27%
Intel Core i5-12400F
i5-12400F, 2500 МГц
0.884 GB/s -41%
Geekbench 5.5
Multi-Core
Intel Core i9-14900K
i9-14900K, 3200 МГц
25867 Points +46%
Intel Core Ultra 9 285K
Core Ultra 9 285K, 3200 МГц
25740 Points +45%
AMD Ryzen 9 7950X
R9 7950X, 4500 МГц
24625 Points +39%
AMD Ryzen 9 7950X3D
R9 7950X3D, 4200 МГц
24343 Points +37%
Intel Core i9-13900K
i9-13900K, 3000 МГц
24157 Points +36%
AMD Ryzen 9 9950X
Ryzen 9 9950X, 4300 МГц
23982 Points +35%
AMD Ryzen 9 9950X
Ryzen 9 9950X, 4300 МГц
23154 Points +30%
AMD Ryzen 9 7900X
R9 7900X, 4700 МГц
19987 Points +13%
Intel Core i9-12900K
i9-12900K, 3200 МГц
17854 Points +1%
Intel Core Ultra 5 245K
Core Ultra 5 245K, 3600 МГц
17760 Points
Intel Core i5-14600K
i5-14600K, 3500 МГц
17516 Points -1%
AMD Ryzen 9 5950X
R9 5950X, 3400 МГц
16891 Points -5%
Intel Core i5-13600K
i5-13600K, 3500 МГц
16651 Points -6%
AMD Ryzen 7 9700X
Ryzen 7 9700X, 3800 МГц
14613 Points -18%
AMD Ryzen 7 7800X3D
R7 7800X3D, 4200 МГц
14252 Points -20%
Intel Core i5-12600K
i5-12600K, 2800 МГц
12797 Points -28%
AMD Ryzen 5 9600X
Ryzen 5 9600X, 3900 МГц
12751 Points -28%
Intel Core i5-13400
i5-13400, 2500 МГц
12107 Points -32%
AMD Ryzen 5 7600X
R5 7600X, 4700 МГц
11917 Points -33%
Intel Core i5-12400F
i5-12400F, 2500 МГц
9517 Points -46%
Single-Core
AMD Ryzen 9 9950X
Ryzen 9 9950X, 4300 МГц
2559 Points +15%
AMD Ryzen 9 9950X
Ryzen 9 9950X, 4300 МГц
2536 Points +14%
AMD Ryzen 5 9600X
Ryzen 5 9600X, 3900 МГц
2523 Points +13%
AMD Ryzen 7 9700X
Ryzen 7 9700X, 3800 МГц
2507 Points +13%
Intel Core Ultra 9 285K
Core Ultra 9 285K, 3200 МГц
2366 Points +6%
AMD Ryzen 9 7950X
R9 7950X, 4500 МГц
2311 Points +4%
AMD Ryzen 9 7950X3D
R9 7950X3D, 4200 МГц
2311 Points +4%
Intel Core i9-13900K
i9-13900K, 3000 МГц
2290 Points +3%
AMD Ryzen 9 7900X
R9 7900X, 4700 МГц
2274 Points +2%
Intel Core i9-14900K
i9-14900K, 3200 МГц
2243 Points +1%
Intel Core Ultra 5 245K
Core Ultra 5 245K, 3600 МГц
2224 Points
AMD Ryzen 5 7600X
R5 7600X, 4700 МГц
2205 Points -1%
Intel Core i9-12900K
i9-12900K, 3200 МГц
2042 Points -8%
AMD Ryzen 7 7800X3D
R7 7800X3D, 4200 МГц
2027 Points -9%
Intel Core i5-14600K
i5-14600K, 3500 МГц
2017 Points -9%
Intel Core i5-13600K
i5-13600K, 3500 МГц
1967 Points -12%
Intel Core i5-12600K
i5-12600K, 2800 МГц
1904 Points -14%
Intel Core i5-13400
i5-13400, 2500 МГц
1795 Points -19%
Intel Core i5-12400F
i5-12400F, 2500 МГц
1742 Points -22%
AMD Ryzen 9 5950X
R9 5950X, 3400 МГц
1682 Points -24%
Geekbench 5.0
5.0 Multi-Core
Intel Core Ultra 9 285K
Core Ultra 9 285K, 3200 МГц
25793 Points +44%
Intel Core i9-14900K
i9-14900K, 3200 МГц
25459 Points +42%
AMD Ryzen 9 7950X
R9 7950X, 4500 МГц
24479 Points +36%
Intel Core i9-13900K
i9-13900K, 3000 МГц
24021 Points +34%
AMD Ryzen 9 7950X3D
R9 7950X3D, 4200 МГц
23720 Points +32%
AMD Ryzen 9 9950X
Ryzen 9 9950X, 4300 МГц
23387 Points +30%
AMD Ryzen 9 7900X
R9 7900X, 4700 МГц
19975 Points +11%
Intel Core i9-12900K
i9-12900K, 3200 МГц
17959 Points 0%
Intel Core Ultra 5 245K
Core Ultra 5 245K, 3600 МГц
17938 Points
Intel Core i5-14600K
i5-14600K, 3500 МГц
17374 Points -3%
Intel Core i5-13600K
i5-13600K, 3500 МГц
16635 Points -7%
AMD Ryzen 9 5950X
R9 5950X, 3400 МГц
16570 Points -8%
AMD Ryzen 7 9700X
Ryzen 7 9700X, 3800 МГц
14698 Points -18%
AMD Ryzen 7 7800X3D
R7 7800X3D, 4200 МГц
13888 Points -23%
Intel Core i5-12600K
i5-12600K, 2800 МГц
12746 Points -29%
AMD Ryzen 5 9600X
Ryzen 5 9600X, 3900 МГц
12556 Points -30%
AMD Ryzen 5 7600X
R5 7600X, 4700 МГц
11880 Points -34%
Intel Core i5-13400
i5-13400, 2500 МГц
11801 Points -34%
Intel Core i5-12400F
i5-12400F, 2500 МГц
9368 Points -48%
5.0 Single-Core
AMD Ryzen 9 9950X
Ryzen 9 9950X, 4300 МГц
2445 Points +12%
AMD Ryzen 7 9700X
Ryzen 7 9700X, 3800 МГц
2402 Points +10%
AMD Ryzen 5 9600X
Ryzen 5 9600X, 3900 МГц
2397 Points +10%
Intel Core Ultra 9 285K
Core Ultra 9 285K, 3200 МГц
2332 Points +7%
Intel Core i9-14900K
i9-14900K, 3200 МГц
2272 Points +4%
AMD Ryzen 9 7950X
R9 7950X, 4500 МГц
2222 Points +2%
Intel Core i9-13900K
i9-13900K, 3000 МГц
2214 Points +2%
AMD Ryzen 9 7900X
R9 7900X, 4700 МГц
2194 Points +1%
AMD Ryzen 9 7950X3D
R9 7950X3D, 4200 МГц
2183 Points 0%
Intel Core Ultra 5 245K
Core Ultra 5 245K, 3600 МГц
2180 Points
AMD Ryzen 5 7600X
R5 7600X, 4700 МГц
2126 Points -2%
Intel Core i5-14600K
i5-14600K, 3500 МГц
2004 Points -8%
Intel Core i9-12900K
i9-12900K, 3200 МГц
1968 Points -10%
AMD Ryzen 7 7800X3D
R7 7800X3D, 4200 МГц
1938 Points -11%
Intel Core i5-13600K
i5-13600K, 3500 МГц
1931 Points -11%
Intel Core i5-12600K
i5-12600K, 2800 МГц
1821 Points -16%
Intel Core i5-13400
i5-13400, 2500 МГц
1706 Points -22%
AMD Ryzen 9 5950X
R9 5950X, 3400 МГц
1683 Points -23%
Intel Core i5-12400F
i5-12400F, 2500 МГц
1673 Points -23%
Geekbench 4.4
64 Bit Single-Core Score
AMD Ryzen 9 9950X
Ryzen 9 9950X, 4300 МГц
10016 Points +9%
Intel Core i9-14900K
i9-14900K, 3200 МГц
9890 Points +8%
AMD Ryzen 7 9700X
Ryzen 7 9700X, 3800 МГц
9801 Points +7%
Intel Core Ultra 9 285K
Core Ultra 9 285K, 3200 МГц
9791 Points +7%
AMD Ryzen 5 9600X
Ryzen 5 9600X, 3900 МГц
9757 Points +6%
Intel Core i9-13900K
i9-13900K, 3000 МГц
9598 Points +5%
AMD Ryzen 9 7950X
R9 7950X, 4500 МГц
9322 Points +2%
AMD Ryzen 9 7950X3D
R9 7950X3D, 4200 МГц
9240 Points +1%
AMD Ryzen 9 7900X
R9 7900X, 4700 МГц
9193 Points 0%
Intel Core Ultra 5 245K
Core Ultra 5 245K, 3600 МГц
9171 Points
AMD Ryzen 7 7800X3D
R7 7800X3D, 4200 МГц
9097 Points -1%
AMD Ryzen 5 7600X
R5 7600X, 4700 МГц
8926 Points -3%
Intel Core i5-14600K
i5-14600K, 3500 МГц
8904 Points -3%
Intel Core i9-12900K
i9-12900K, 3200 МГц
8665 Points -6%
Intel Core i5-13600K
i5-13600K, 3500 МГц
8618 Points -6%
Intel Core i5-12600K
i5-12600K, 2800 МГц
8223 Points -10%
Intel Core i5-13400
i5-13400, 2500 МГц
7683 Points -16%
Intel Core i5-12400F
i5-12400F, 2500 МГц
7548 Points -18%
AMD Ryzen 9 5950X
R9 5950X, 3400 МГц
7216 Points -21%
64 Bit Multi-Core Score
AMD Ryzen 9 9950X
Ryzen 9 9950X, 4300 МГц
100326 Points +52%
Intel Core Ultra 9 285K
Core Ultra 9 285K, 3200 МГц
92188 Points +40%
AMD Ryzen 9 7950X
R9 7950X, 4500 МГц
89678 Points +36%
Intel Core i9-14900K
i9-14900K, 3200 МГц
89177 Points +35%
AMD Ryzen 9 7950X3D
R9 7950X3D, 4200 МГц
87922 Points +33%
Intel Core i9-13900K
i9-13900K, 3000 МГц
86695 Points +31%
AMD Ryzen 9 7900X
R9 7900X, 4700 МГц
74731 Points +13%
Intel Core Ultra 5 245K
Core Ultra 5 245K, 3600 МГц
65981 Points
Intel Core i5-14600K
i5-14600K, 3500 МГц
64035 Points -3%
Intel Core i9-12900K
i9-12900K, 3200 МГц
63583 Points -4%
AMD Ryzen 9 5950X
R9 5950X, 3400 МГц
63233 Points -4%
Intel Core i5-13600K
i5-13600K, 3500 МГц
60407 Points -8%
AMD Ryzen 7 9700X
Ryzen 7 9700X, 3800 МГц
59594 Points -10%
AMD Ryzen 7 7800X3D
R7 7800X3D, 4200 МГц
54840 Points -17%
AMD Ryzen 5 9600X
Ryzen 5 9600X, 3900 МГц
51644 Points -22%
AMD Ryzen 5 7600X
R5 7600X, 4700 МГц
47407 Points -28%
Intel Core i5-12600K
i5-12600K, 2800 МГц
46557 Points -29%
Intel Core i5-13400
i5-13400, 2500 МГц
42509 Points -36%
Intel Core i5-12400F
i5-12400F, 2500 МГц
35098 Points -47%
3DMark 11 - 1280x720 Performance Physics
AMD Ryzen 9 9950X
Ryzen 9 9950X, 4300 МГц
38269 Points +42%
AMD Ryzen 9 7950X3D
R9 7950X3D, 4200 МГц
36991 Points +37%
AMD Ryzen 7 7800X3D
R7 7800X3D, 4200 МГц
35127 Points +30%
Intel Core i9-13900K
i9-13900K, 3000 МГц
32273 Points +19%
Intel Core i9-14900K
i9-14900K, 3200 МГц
32188 Points +19%
Intel Core i5-14600K
i5-14600K, 3500 МГц
31641 Points +17%
AMD Ryzen 7 9700X
Ryzen 7 9700X, 3800 МГц
30757 Points +14%
Intel Core i5-13600K
i5-13600K, 3500 МГц
30480 Points +13%
Intel Core Ultra 9 285K
Core Ultra 9 285K, 3200 МГц
28636 Points +6%
AMD Ryzen 9 7900X
R9 7900X, 4700 МГц
28618 Points +6%
AMD Ryzen 9 7950X
R9 7950X, 4500 МГц
28618 Points +6%
Intel Core i9-12900K
i9-12900K, 3200 МГц
28211 Points +4%
Intel Core Ultra 5 245K
Core Ultra 5 245K, 3600 МГц
27022 Points
AMD Ryzen 5 9600X
Ryzen 5 9600X, 3900 МГц
25717 Points -5%
AMD Ryzen 5 7600X
R5 7600X, 4700 МГц
25396 Points -6%
AMD Ryzen 9 5950X
R9 5950X, 3400 МГц
25367 Points -6%
Intel Core i5-12600K
i5-12600K, 2800 МГц
25017 Points -7%
Intel Core i5-13400
i5-13400, 2500 МГц
23120 Points -14%
Intel Core i5-12400F
i5-12400F, 2500 МГц
19436 Points -28%
7-Zip 18.03
7z b 4
AMD Ryzen 9 7950X
R9 7950X, 4500 МГц
161724 MIPS +108%
AMD Ryzen 9 9950X
Ryzen 9 9950X, 4300 МГц
160423 MIPS +106%
AMD Ryzen 9 7950X3D
R9 7950X3D, 4200 МГц
159341 MIPS +104%
Intel Core i9-14900K
i9-14900K, 3200 МГц
149570 MIPS +92%
Intel Core i9-13900K
i9-13900K, 3000 МГц
147068 MIPS +89%
Intel Core Ultra 9 285K
Core Ultra 9 285K, 3200 МГц
129542 MIPS +66%
AMD Ryzen 9 5950X
R9 5950X, 3400 МГц
127792 MIPS +64%
AMD Ryzen 9 7900X
R9 7900X, 4700 МГц
124975 MIPS +60%
Intel Core i9-12900K
i9-12900K, 3200 МГц
97671 MIPS +25%
Intel Core i5-14600K
i5-14600K, 3500 МГц
93235 MIPS +20%
Intel Core i5-13600K
i5-13600K, 3500 МГц
89647 MIPS +15%
AMD Ryzen 7 7800X3D
R7 7800X3D, 4200 МГц
85067 MIPS +9%
AMD Ryzen 7 9700X
Ryzen 7 9700X, 3800 МГц
82553 MIPS +6%
Intel Core Ultra 5 245K
Core Ultra 5 245K, 3600 МГц
77921 MIPS
AMD Ryzen 5 7600X
R5 7600X, 4700 МГц
69291 MIPS -11%
AMD Ryzen 5 9600X
Ryzen 5 9600X, 3900 МГц
68220 MIPS -12%
Intel Core i5-12600K
i5-12600K, 2800 МГц
64260 MIPS -18%
Intel Core i5-13400
i5-13400, 2500 МГц
59510 MIPS -24%
Intel Core i5-12400F
i5-12400F, 2500 МГц
45043 MIPS -42%
7z b 4 -mmt1
AMD Ryzen 9 7950X
R9 7950X, 4500 МГц
8365 MIPS +29%
AMD Ryzen 9 7950X3D
R9 7950X3D, 4200 МГц
8321 MIPS +28%
AMD Ryzen 9 7900X
R9 7900X, 4700 МГц
8282 MIPS +28%
AMD Ryzen 7 7800X3D
R7 7800X3D, 4200 МГц
8235 MIPS +27%
AMD Ryzen 5 7600X
R5 7600X, 4700 МГц
8063 MIPS +24%
AMD Ryzen 7 9700X
Ryzen 7 9700X, 3800 МГц
7894 MIPS +22%
AMD Ryzen 9 9950X
Ryzen 9 9950X, 4300 МГц
7852 MIPS +21%
AMD Ryzen 5 9600X
Ryzen 5 9600X, 3900 МГц
7796 MIPS +20%
Intel Core i9-14900K
i9-14900K, 3200 МГц
7772 MIPS +20%
Intel Core Ultra 9 285K
Core Ultra 9 285K, 3200 МГц
7288 MIPS +13%
Intel Core i9-13900K
i9-13900K, 3000 МГц
7272 MIPS +12%
AMD Ryzen 9 5950X
R9 5950X, 3400 МГц
6974 MIPS +8%
Intel Core i5-14600K
i5-14600K, 3500 МГц
6910 MIPS +7%
Intel Core i9-12900K
i9-12900K, 3200 МГц
6571 MIPS +1%
Intel Core i5-13600K
i5-13600K, 3500 МГц
6502 MIPS 0%
Intel Core Ultra 5 245K
Core Ultra 5 245K, 3600 МГц
6477 MIPS
Intel Core i5-12600K
i5-12600K, 2800 МГц
5944 MIPS -8%
Intel Core i5-13400
i5-13400, 2500 МГц
5829 MIPS -10%
Intel Core i5-12400F
i5-12400F, 2500 МГц
5476 MIPS -15%
HWBOT x265 Benchmark v2.2 - 4k Preset
AMD Ryzen 9 9950X
Ryzen 9 9950X, 4300 МГц
45.1 fps +52%
Intel Core Ultra 9 285K
Core Ultra 9 285K, 3200 МГц
45 fps +52%
AMD Ryzen 9 7950X
R9 7950X, 4500 МГц
44.4 fps +50%
Intel Core i9-14900K
i9-14900K, 3200 МГц
42.8 fps +45%
Intel Core i9-13900K
i9-13900K, 3000 МГц
42.6 fps +44%
AMD Ryzen 9 7950X3D
R9 7950X3D, 4200 МГц
42.4 fps +43%
AMD Ryzen 9 7900X
R9 7900X, 4700 МГц
36.2 fps +22%
AMD Ryzen 9 5950X
R9 5950X, 3400 МГц
31.8 fps +7%
Intel Core i5-12600K
i5-12600K, 2800 МГц
30.1 fps +2%
Intel Core i9-12900K
i9-12900K, 3200 МГц
30 fps +1%
Intel Core Ultra 5 245K
Core Ultra 5 245K, 3600 МГц
29.6 fps
Intel Core i5-14600K
i5-14600K, 3500 МГц
28.6 fps -3%
Intel Core i5-13600K
i5-13600K, 3500 МГц
27.6 fps -7%
AMD Ryzen 7 9700X
Ryzen 7 9700X, 3800 МГц
26.4 fps -11%
AMD Ryzen 7 7800X3D
R7 7800X3D, 4200 МГц
24.4 fps -18%
AMD Ryzen 5 9600X
Ryzen 5 9600X, 3900 МГц
23.2 fps -22%
AMD Ryzen 5 7600X
R5 7600X, 4700 МГц
21.1 fps -29%
Intel Core i5-13400
i5-13400, 2500 МГц
19.1 fps -35%
Intel Core i5-12400F
i5-12400F, 2500 МГц
15.2 fps -49%
R Benchmark 2.5 - Overall mean
Intel Core i5-12400F
i5-12400F, 2500 МГц
0.4837 sec * -18%
Intel Core i5-13400
i5-13400, 2500 МГц
0.4654 sec * -14%
AMD Ryzen 9 5950X
R9 5950X, 3400 МГц
0.4556 sec * -12%
Intel Core i5-12600K
i5-12600K, 2800 МГц
0.4456 sec * -9%
Intel Core i9-12900K
i9-12900K, 3200 МГц
0.4216 sec * -3%
AMD Ryzen 7 7800X3D
R7 7800X3D, 4200 МГц
0.4152 sec * -2%
Intel Core Ultra 5 245K
Core Ultra 5 245K, 3600 МГц
0.4086 sec *
Intel Core Ultra 5 245K
Core Ultra 5 245K, 3600 МГц
0.4058 sec * +1%
Intel Core i5-13600K
i5-13600K, 3500 МГц
0.405 sec * +1%
Intel Core i5-14600K
i5-14600K, 3500 МГц
0.3937 sec * +4%
Intel Core Ultra 9 285K
Core Ultra 9 285K, 3200 МГц
0.3833 sec * +6%
AMD Ryzen 5 7600X
R5 7600X, 4700 МГц
0.3749 sec * +8%
AMD Ryzen 9 7900X
R9 7900X, 4700 МГц
0.3736 sec * +9%
AMD Ryzen 9 7950X3D
R9 7950X3D, 4200 МГц
0.372 sec * +9%
AMD Ryzen 9 7950X
R9 7950X, 4500 МГц
0.3682 sec * +10%
Intel Core i9-13900K
i9-13900K, 3000 МГц
0.3539 sec * +13%
Intel Core i9-14900K
i9-14900K, 3200 МГц
0.345 sec * +16%
AMD Ryzen 7 9700X
Ryzen 7 9700X, 3800 МГц
0.3414 sec * +16%
AMD Ryzen 5 9600X
Ryzen 5 9600X, 3900 МГц
0.3389 sec * +17%
AMD Ryzen 9 9950X
Ryzen 9 9950X, 4300 МГц
0.3307 sec * +19%
LibreOffice - 20 Documents To PDF
Intel Core i5-12600K
i5-12600K, 2800 МГц
71.8 s * -67%
Intel Core i5-12400F
i5-12400F, 2500 МГц
46.5 s * -8%
AMD Ryzen 5 9600X
Ryzen 5 9600X, 3900 МГц
46.4 s * -8%
AMD Ryzen 9 5950X
R9 5950X, 3400 МГц
45.97 s * -7%
AMD Ryzen 9 9950X
Ryzen 9 9950X, 4300 МГц
45.1 s * -5%
AMD Ryzen 7 9700X
Ryzen 7 9700X, 3800 МГц
43.8 s * -2%
Intel Core Ultra 5 245K
Core Ultra 5 245K, 3600 МГц
43.1 s *
Intel Core Ultra 5 245K
Core Ultra 5 245K, 3600 МГц
39.3 s * +9%
AMD Ryzen 7 7800X3D
R7 7800X3D, 4200 МГц
40.7 s * +6%
Intel Core i9-12900K
i9-12900K, 3200 МГц
40.6 s * +6%
Intel Core i5-13400
i5-13400, 2500 МГц
38.7 s * +10%
AMD Ryzen 9 7950X3D
R9 7950X3D, 4200 МГц
38.6 s * +10%
AMD Ryzen 5 7600X
R5 7600X, 4700 МГц
36.8 s * +15%
Intel Core i9-13900K
i9-13900K, 3000 МГц
36.6 s * +15%
Intel Core Ultra 9 285K
Core Ultra 9 285K, 3200 МГц
36.2 s * +16%
AMD Ryzen 9 7950X
R9 7950X, 4500 МГц
35.5 s * +18%
Intel Core i5-13600K
i5-13600K, 3500 МГц
35 s * +19%
AMD Ryzen 9 7900X
R9 7900X, 4700 МГц
34.9 s * +19%
Intel Core i9-14900K
i9-14900K, 3200 МГц
32.5 s * +25%
Intel Core i5-14600K
i5-14600K, 3500 МГц
31.9 s * +26%
WebXPRT 3 - Overall
AMD Ryzen 9 9950X
Ryzen 9 9950X, 4300 МГц
409 Points +18%
AMD Ryzen 7 9700X
Ryzen 7 9700X, 3800 МГц
398 Points +15%
AMD Ryzen 9 7950X3D
R9 7950X3D, 4200 МГц
383 Points +11%
Intel Core i9-14900K
i9-14900K, 3200 МГц
382 Points +10%
Intel Core Ultra 9 285K
Core Ultra 9 285K, 3200 МГц
377 Points +9%
AMD Ryzen 9 7900X
R9 7900X, 4700 МГц
371 Points +7%
AMD Ryzen 9 7950X
R9 7950X, 4500 МГц
366 Points +6%
AMD Ryzen 5 9600X
Ryzen 5 9600X, 3900 МГц
364 Points +5%
AMD Ryzen 5 7600X
R5 7600X, 4700 МГц
362 Points +5%
Intel Core i9-13900K
i9-13900K, 3000 МГц
361 Points +4%
Intel Core i5-14600K
i5-14600K, 3500 МГц
354 Points +2%
AMD Ryzen 7 7800X3D
R7 7800X3D, 4200 МГц
353 Points +2%
Intel Core Ultra 5 245K
Core Ultra 5 245K, 3600 МГц
346 Points
Intel Core i5-13600K
i5-13600K, 3500 МГц
333 Points -4%
Intel Core i9-12900K
i9-12900K, 3200 МГц
320 Points -8%
Intel Core i5-13400
i5-13400, 2500 МГц
306 Points -12%
Intel Core i5-12600K
i5-12600K, 2800 МГц
293 Points -15%
AMD Ryzen 9 5950X
R9 5950X, 3400 МГц
291 Points -16%
Intel Core i5-12400F
i5-12400F, 2500 МГц
272 Points -21%
Mozilla Kraken 1.1 - Total
Intel Core i5-12400F
i5-12400F, 2500 МГц
573 ms * -35%
AMD Ryzen 9 5950X
R9 5950X, 3400 МГц
558 ms * -31%
Intel Core i5-13400
i5-13400, 2500 МГц
535 ms * -26%
Intel Core i5-12600K
i5-12600K, 2800 МГц
511 ms * -20%
AMD Ryzen 7 7800X3D
R7 7800X3D, 4200 МГц
487 ms * -15%
Intel Core i9-12900K
i9-12900K, 3200 МГц
481 ms * -13%
Intel Core i5-13600K
i5-13600K, 3500 МГц
469 ms * -10%
Intel Core i5-14600K
i5-14600K, 3500 МГц
450 ms * -6%
AMD Ryzen 5 7600X
R5 7600X, 4700 МГц
441 ms * -4%
AMD Ryzen 9 7950X3D
R9 7950X3D, 4200 МГц
437 ms * -3%
AMD Ryzen 9 7950X
R9 7950X, 4500 МГц
433 ms * -2%
Intel Core i9-13900K
i9-13900K, 3000 МГц
432 ms * -2%
AMD Ryzen 9 7900X
R9 7900X, 4700 МГц
431 ms * -1%
Intel Core Ultra 5 245K
Core Ultra 5 245K, 3600 МГц
425 ms *
Intel Core i9-14900K
i9-14900K, 3200 МГц
418 ms * +2%
Intel Core Ultra 9 285K
Core Ultra 9 285K, 3200 МГц
396 ms * +7%
AMD Ryzen 5 9600X
Ryzen 5 9600X, 3900 МГц
389 ms * +8%
AMD Ryzen 7 9700X
Ryzen 7 9700X, 3800 МГц
383 ms * +10%
AMD Ryzen 9 9950X
Ryzen 9 9950X, 4300 МГц
377 ms * +11%
3DMark
1920x1080 Fire Strike Physics
Intel Core i9-14900K
i9-14900K, 3200 МГц
56087 Points +47%
Intel Core i9-13900K
i9-13900K, 3000 МГц
53853 Points +41%
Intel Core Ultra 9 285K
Core Ultra 9 285K, 3200 МГц
53194 Points +39%
AMD Ryzen 9 9950X
Ryzen 9 9950X, 4300 МГц
49522 Points +30%
AMD Ryzen 9 7950X3D
R9 7950X3D, 4200 МГц
44787 Points +17%
AMD Ryzen 9 7900X
R9 7900X, 4700 МГц
42682 Points +12%
AMD Ryzen 9 7950X
R9 7950X, 4500 МГц
42682 Points +12%
Intel Core i5-14600K
i5-14600K, 3500 МГц
40164 Points +5%
AMD Ryzen 9 5950X
R9 5950X, 3400 МГц
39600 Points +4%
Intel Core i9-12900K
i9-12900K, 3200 МГц
39112 Points +2%
Intel Core Ultra 5 245K
Core Ultra 5 245K, 3600 МГц
38202 Points
AMD Ryzen 7 9700X
Ryzen 7 9700X, 3800 МГц
38088 Points 0%
Intel Core i5-13600K
i5-13600K, 3500 МГц
35386 Points -7%
AMD Ryzen 5 9600X
Ryzen 5 9600X, 3900 МГц
33462 Points -12%
AMD Ryzen 7 7800X3D
R7 7800X3D, 4200 МГц
33345 Points -13%
AMD Ryzen 5 7600X
R5 7600X, 4700 МГц
30691 Points -20%
Intel Core i5-12600K
i5-12600K, 2800 МГц
29671 Points -22%
Intel Core i5-13400
i5-13400, 2500 МГц
27135 Points -29%
Intel Core i5-12400F
i5-12400F, 2500 МГц
24023 Points -37%
2560x1440 Time Spy CPU
Intel Core i9-14900K
i9-14900K, 3200 МГц
23721 Points +58%
Intel Core i9-13900K
i9-13900K, 3000 МГц
19392 Points +29%
Intel Core i5-14600K
i5-14600K, 3500 МГц
18768 Points +25%
Intel Core i9-12900K
i9-12900K, 3200 МГц
18431 Points +23%
Intel Core Ultra 9 285K
Core Ultra 9 285K, 3200 МГц
17911 Points +19%
AMD Ryzen 9 7950X3D
R9 7950X3D, 4200 МГц
17206 Points +15%
Intel Core i5-13600K
i5-13600K, 3500 МГц
17124 Points +14%
AMD Ryzen 9 7900X
R9 7900X, 4700 МГц
16616 Points +11%
AMD Ryzen 9 7950X
R9 7950X, 4500 МГц
16616 Points +11%
AMD Ryzen 9 9950X
Ryzen 9 9950X, 4300 МГц
16112 Points +7%
Intel Core Ultra 5 245K
Core Ultra 5 245K, 3600 МГц
15010 Points
AMD Ryzen 7 9700X
Ryzen 7 9700X, 3800 МГц
14306 Points -5%
AMD Ryzen 7 7800X3D
R7 7800X3D, 4200 МГц
14098 Points -6%
Intel Core i5-12600K
i5-12600K, 2800 МГц
13869 Points -8%
AMD Ryzen 9 5950X
R9 5950X, 3400 МГц
13650 Points -9%
Intel Core i5-13400
i5-13400, 2500 МГц
12948 Points -14%
AMD Ryzen 5 9600X
Ryzen 5 9600X, 3900 МГц
10821 Points -28%
AMD Ryzen 5 7600X
R5 7600X, 4700 МГц
10458 Points -30%
Intel Core i5-12400F
i5-12400F, 2500 МГц
9745 Points -35%
Super Pi mod 1.5 XS 1M - 1M
Intel Core i5-12400F
i5-12400F, 2500 МГц
8.298 s * -14%
Intel Core i5-13400
i5-13400, 2500 МГц
8.033 s * -10%
AMD Ryzen 5 9600X
Ryzen 5 9600X, 3900 МГц
7.614 s * -4%
AMD Ryzen 7 9700X
Ryzen 7 9700X, 3800 МГц
7.54 s * -3%
AMD Ryzen 5 7600X
R5 7600X, 4700 МГц
7.423 s * -2%
Intel Core i5-12600K
i5-12600K, 2800 МГц
7.406 s * -1%
AMD Ryzen 9 9950X
Ryzen 9 9950X, 4300 МГц
7.31 s * -0%
Intel Core Ultra 5 245K
Core Ultra 5 245K, 3600 МГц
7.303 s *
AMD Ryzen 7 7800X3D
R7 7800X3D, 4200 МГц
7.089 s * +3%
AMD Ryzen 9 5950X
R9 5950X, 3400 МГц
7.065 s * +3%
Intel Core i9-12900K
i9-12900K, 3200 МГц
7.063 s * +3%
Intel Core Ultra 9 285K
Core Ultra 9 285K, 3200 МГц
6.713 s * +8%
Intel Core i5-13600K
i5-13600K, 3500 МГц
6.58 s * +10%
Intel Core i5-14600K
i5-14600K, 3500 МГц
6.234 s * +15%
AMD Ryzen 9 7900X
R9 7900X, 4700 МГц
6.141 s * +16%
AMD Ryzen 9 7950X3D
R9 7950X3D, 4200 МГц
6.109 s * +16%
AMD Ryzen 9 7950X
R9 7950X, 4500 МГц
6.088 s * +17%
Intel Core i9-13900K
i9-13900K, 3000 МГц
5.655 s * +23%
Intel Core i9-14900K
i9-14900K, 3200 МГц
5.476 s * +25%
Super Pi mod 1.5 XS 2M - 2M
Intel Core i5-12400F
i5-12400F, 2500 МГц
18.473 s * -15%
Intel Core i5-13400
i5-13400, 2500 МГц
17.963 s * -12%
Intel Core i5-12600K
i5-12600K, 2800 МГц
16.42 s * -2%
AMD Ryzen 5 9600X
Ryzen 5 9600X, 3900 МГц
16.363 s * -2%
AMD Ryzen 7 9700X
Ryzen 7 9700X, 3800 МГц
16.1 s * -0%
Intel Core Ultra 5 245K
Core Ultra 5 245K, 3600 МГц
16.026 s *
AMD Ryzen 5 7600X
R5 7600X, 4700 МГц
15.954 s * -0%
AMD Ryzen 9 9950X
Ryzen 9 9950X, 4300 МГц
15.61 s * +3%
Intel Core i9-12900K
i9-12900K, 3200 МГц
15.59 s * +3%
AMD Ryzen 7 7800X3D
R7 7800X3D, 4200 МГц
15.335 s * +4%
AMD Ryzen 9 5950X
R9 5950X, 3400 МГц
15.28 s * +5%
Intel Core i5-13600K
i5-13600K, 3500 МГц
14.876 s * +7%
Intel Core Ultra 9 285K
Core Ultra 9 285K, 3200 МГц
14.64 s * +9%
Intel Core i5-14600K
i5-14600K, 3500 МГц
13.657 s * +15%
AMD Ryzen 9 7950X
R9 7950X, 4500 МГц
13.291 s * +17%
AMD Ryzen 9 7900X
R9 7900X, 4700 МГц
13.251 s * +17%
Intel Core i9-13900K
i9-13900K, 3000 МГц
13.193 s * +18%
AMD Ryzen 9 7950X3D
R9 7950X3D, 4200 МГц
13.189 s * +18%
Intel Core i9-14900K
i9-14900K, 3200 МГц
11.996 s * +25%

* ... меньше = лучше

Cinebench R15
Cinebench R15
Cinebench R20
Cinebench R20
Cinebench R23
Cinebench R23
Cinebench 2024
Cinebench 2024

Intel Core Ultra 5 245K в многопоточном тесте Cinebench R15

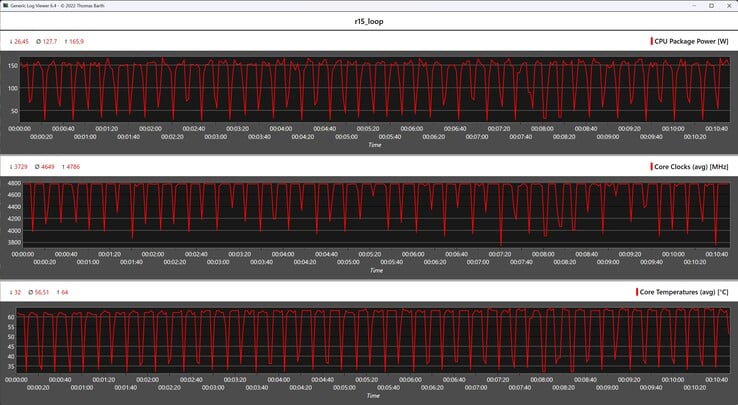
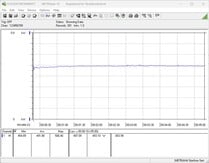
Intel Core Ultra 5 245K без ограничений справляется с непрерывным циклом Cinebench R15. Пиковая нагрузка чуть менее 166 Вт присутствует лишь в течение короткого времени, хотя среднее энергопотребление процессора составляет 128 Вт на протяжении 50 прогонов.

Благодаря нашему мощному охлаждающему устройству температура Intel Core Ultra 5 245K во время работы не превышала 64 °C.

Показатели процессора во время выполнения цикла Cinebench R15
1723.61923.62123.62323.62523.62723.62923.63123.63323.63523.63723.63923.64123.64323.64523.64723.64923.65123.65323.65523.65723.65923.66123.66323.6Tooltip
Intel Core Ultra 5 245K Core Ultra 5 245K: Ø3788 (3746.72-3821.53)
Intel Core i9-13900K i9-13900K: Ø6182 (6045.95-6213.11)
NVIDIA GeForce RTX 3090 Founders Edition R9 7950X: Ø6154 (6136.85-6189.08)
Intel Core i5-13600K i5-13600K: Ø3620 (3607.83-3632.07)
AMD Ryzen 5 7600X R5 7600X: Ø2468 (2440.21-2487.56)
Intel Core i9-12900K i9-12900K: Ø3987 (3920.42-4037.55)
Intel Core i5-12600K i5-12600K: Ø2545 (2497.35-2570.36)
AMD Ryzen 7 7800X3D R7 7800X3D: Ø2967 (2917.15-3006.39)
AMD Ryzen 9 7900X R9 7900X: Ø4785 (4739.9-4829.17)
Intel Core i5-13400 i5-13400: Ø2328 (2286.5-2356.27)
Intel Core i5-12400F i5-12400F: Ø1754 (1723.62-1775.1)
AMD Ryzen 9 5950X R9 5950X: Ø4467 (4442.47-4510.09)
AMD Ryzen 9 7950X3D R9 7950X3D: Ø5942 (5923.29-5966.59)
Palit GeForce RTX 4090 GameRock OC i9-14900K: Ø6068 (5924.17-6110.6)
Intel Core i5-14600K i5-14600K: Ø3640 (3622.86-3654.64)
AMD Ryzen 5 9600X Ryzen 5 9600X: Ø2623 (2586.99-2654.28)
AMD Ryzen 9 9950X Ryzen 9 9950X: Ø6291 (6262.72-6335.13)

Синтетические бенчмарки и производительность приложений

В повседневном использовании Intel Core Ultra 5 245K работает так же хорошо, как и все остальные процессоры в сравнительном обзоре. Заметных различий не обнаружено, хотя по результатам Core Ultra 5 245K занимает лишь место в середине таблицы.

Производительность Core i5-14600K не может сравниться с ним, что несколько разочаровывает при оценке.

PCMark 10 - Score
AMD Ryzen 9 9950X
10699 Points +14%
Intel Core i9-14900K
10101 Points +7%
AMD Ryzen 5 9600X
10060 Points +7%
AMD Ryzen 9 7900X
9911 Points +5%
AMD Ryzen 9 7950X
9911 Points +5%
Intel Core i9-13900K
9788 Points +4%
Intel Core i5-14600K
9587 Points +2%
AMD Ryzen 7 7800X3D
9500 Points +1%
AMD Ryzen 5 7600X
9470 Points +1%
Intel Core Ultra 5 245K
9409 Points
Intel Core i5-13600K
9362 Points 0%
AMD Ryzen 9 5950X
8778 Points -7%
Intel Core i5-13400
8614 Points -8%
Intel Core i9-12900K
8604 Points -9%
Intel Core i5-12600K
8259 Points -12%
Intel Core i5-12400F
7756 Points -18%
CrossMark - Overall
Intel Core i9-14900K
2611 Points +16%
Intel Core i9-13900K
2589 Points +15%
AMD Ryzen 9 7950X
2512 Points +12%
AMD Ryzen 9 9950X
2451 Points +9%
AMD Ryzen 9 7900X
2405 Points +7%
Intel Core i5-14600K
2310 Points +3%
Intel Core i5-13600K
2271 Points +1%
Intel Core Ultra 5 245K
2245 Points
AMD Ryzen 5 7600X
2236 Points 0%
AMD Ryzen 7 7800X3D
2216 Points -1%
AMD Ryzen 9 7950X3D
2193 Points -2%
AMD Ryzen 5 9600X
2103 Points -6%
Intel Core i5-13400
1877 Points -16%
Intel Core i5-12400F
1762 Points -22%
AMD Ryzen 9 5950X
1495 Points -33%
Blender
v2.79 BMW27 CPU
Intel Core i5-12400F
269 Seconds * -98%
Intel Core i5-13400
206 Seconds * -51%
AMD Ryzen 5 7600X
203 Seconds * -49%
Intel Core i5-12600K
189.5 Seconds * -39%
AMD Ryzen 5 9600X
184 Seconds * -35%
AMD Ryzen 7 7800X3D
169 Seconds * -24%
Intel Core Ultra 5 245K
136 Seconds *
Intel Core i5-13600K
135 Seconds * +1%
Intel Core i5-14600K
134 Seconds * +1%
Intel Core i9-12900K
121.1 Seconds * +11%
AMD Ryzen 9 5950X
112.8 Seconds * +17%
AMD Ryzen 9 7900X
106 Seconds * +22%
AMD Ryzen 9 7950X3D
86 Seconds * +37%
AMD Ryzen 9 7950X
85 Seconds * +37%
Intel Core i9-13900K
80 Seconds * +41%
Intel Core i9-14900K
80 Seconds * +41%
AMD Ryzen 9 9950X
77 Seconds * +43%
v3.3 Classroom CPU
Intel Core i5-12400F
430 Seconds * -99%
Intel Core i5-13400
336 Seconds * -56%
AMD Ryzen 5 9600X
289 Seconds * -34%
AMD Ryzen 7 7800X3D
266 Seconds * -23%
Intel Core i5-13600K
224 Seconds * -4%
Intel Core i5-14600K
223 Seconds * -3%
Intel Core Ultra 5 245K
216 Seconds *
Intel Core i9-13900K
138 Seconds * +36%
Intel Core i9-14900K
135 Seconds * +37%
AMD Ryzen 9 7950X3D
133 Seconds * +38%
AMD Ryzen 9 9950X
118 Seconds * +45%

* ... меньше = лучше

Performance Rating - Percent
AMD Ryzen 5 9600X
NVIDIA GeForce RTX 4090
97.9 pt
Intel Core i9-14900K
NVIDIA GeForce RTX 4090
97 pt
Intel Core i5-14600K
NVIDIA GeForce RTX 4090
96.2 pt
Intel Core i7-13700K
NVIDIA GeForce RTX 4090
95.6 pt
AMD Ryzen 7 7800X3D
NVIDIA GeForce RTX 4090
95.1 pt
AMD Ryzen 9 7950X3D
NVIDIA GeForce RTX 4090
95.1 pt
AMD Ryzen 9 7950X
NVIDIA GeForce RTX 4090
95.1 pt
Intel Core i7-13700
NVIDIA GeForce RTX 4090
94.7 pt
Intel Core Ultra 9 285K
NVIDIA GeForce RTX 4090
91.1 pt
Intel Core i7-12700
NVIDIA GeForce RTX 4090
91 pt
Intel Core Ultra 5 245K
NVIDIA GeForce RTX 4090
90.8 pt
Intel Core i5-13400
NVIDIA GeForce RTX 4090
88.7 pt
3DMark 11 - 1280x720 Performance GPU
AMD Ryzen 7 7800X3D
NVIDIA GeForce RTX 4090
114641 Points +9%
Intel Core i5-14600K
NVIDIA GeForce RTX 4090
110994 Points +6%
AMD Ryzen 9 7950X
NVIDIA GeForce RTX 4090
107723 Points +3%
Intel Core i7-13700K
NVIDIA GeForce RTX 4090
107060 Points +2%
AMD Ryzen 9 7950X3D
NVIDIA GeForce RTX 4090
105886 Points +1%
Intel Core i7-13700
NVIDIA GeForce RTX 4090
105473 Points +1%
Intel Core i9-14900K
NVIDIA GeForce RTX 4090
104998 Points 0%
Intel Core i7-12700
NVIDIA GeForce RTX 4090
104876 Points 0%
Intel Core Ultra 5 245K
NVIDIA GeForce RTX 4090
104781 Points
Intel Core i5-13400
NVIDIA GeForce RTX 4090
104598 Points 0%
AMD Ryzen 5 9600X
NVIDIA GeForce RTX 4090
104516 Points 0%
Intel Core Ultra 9 285K
NVIDIA GeForce RTX 4090
97005 Points -7%
3DMark
2560x1440 Time Spy Graphics
Intel Core i5-14600K
NVIDIA GeForce RTX 4090
37769 Points +3%
Intel Core i9-14900K
NVIDIA GeForce RTX 4090
37762 Points +3%
AMD Ryzen 7 7800X3D
NVIDIA GeForce RTX 4090
37664 Points +2%
AMD Ryzen 5 9600X
NVIDIA GeForce RTX 4090
37161 Points +1%
Intel Core i7-13700K
NVIDIA GeForce RTX 4090
37109 Points +1%
Intel Core i7-13700
NVIDIA GeForce RTX 4090
37106 Points +1%
AMD Ryzen 9 7950X
NVIDIA GeForce RTX 4090
36836 Points 0%
Intel Core Ultra 5 245K
NVIDIA GeForce RTX 4090
36813 Points
AMD Ryzen 9 7950X3D
NVIDIA GeForce RTX 4090
36665 Points 0%
Intel Core Ultra 9 285K
NVIDIA GeForce RTX 4090
36172 Points -2%
Intel Core i7-12700
NVIDIA GeForce RTX 4090
34580 Points -6%
Intel Core i5-13400
NVIDIA GeForce RTX 4090
33624 Points -9%
1920x1080 Fire Strike Graphics
Intel Core i5-14600K
NVIDIA GeForce RTX 4090
86031 Points +10%
Intel Core i7-12700
NVIDIA GeForce RTX 4090
79398 Points +2%
Intel Core i7-13700K
NVIDIA GeForce RTX 4090
79091 Points +1%
Intel Core i7-13700
NVIDIA GeForce RTX 4090
78878 Points +1%
AMD Ryzen 5 9600X
NVIDIA GeForce RTX 4090
78579 Points +1%
Intel Core Ultra 5 245K
NVIDIA GeForce RTX 4090
78079 Points
Intel Core i5-13400
NVIDIA GeForce RTX 4090
77224 Points -1%
AMD Ryzen 7 7800X3D
NVIDIA GeForce RTX 4090
73447 Points -6%
AMD Ryzen 9 7950X3D
NVIDIA GeForce RTX 4090
72901 Points -7%
AMD Ryzen 9 7950X
NVIDIA GeForce RTX 4090
72678 Points -7%
Intel Core i9-14900K
NVIDIA GeForce RTX 4090
70971 Points -9%
Intel Core Ultra 9 285K
NVIDIA GeForce RTX 4090
55924 Points -28%
3840x2160 Fire Strike Ultra Graphics
AMD Ryzen 7 7800X3D
NVIDIA GeForce RTX 4090
25571 Points +2%
Intel Core i5-14600K
NVIDIA GeForce RTX 4090
25342 Points +1%
Intel Core i7-13700
NVIDIA GeForce RTX 4090
25254 Points +1%
Intel Core i9-14900K
NVIDIA GeForce RTX 4090
25209 Points 0%
Intel Core i7-13700K
NVIDIA GeForce RTX 4090
25187 Points 0%
Intel Core Ultra 5 245K
NVIDIA GeForce RTX 4090
25088 Points
Intel Core i5-13400
NVIDIA GeForce RTX 4090
25052 Points 0%
AMD Ryzen 9 7950X
NVIDIA GeForce RTX 4090
25018 Points 0%
AMD Ryzen 9 7950X3D
NVIDIA GeForce RTX 4090
24969 Points 0%
AMD Ryzen 5 9600X
NVIDIA GeForce RTX 4090
24915 Points -1%
Intel Core i7-12700
NVIDIA GeForce RTX 4090
24669 Points -2%
Intel Core Ultra 9 285K
NVIDIA GeForce RTX 4090
24376 Points -3%
Unigine Superposition
1280x720 720p Low
AMD Ryzen 5 9600X
NVIDIA GeForce RTX 4090
63603 Points +59%
Intel Core i9-14900K
NVIDIA GeForce RTX 4090
57174 Points +43%
AMD Ryzen 7 7800X3D
NVIDIA GeForce RTX 4090
56805 Points +42%
AMD Ryzen 9 7950X
NVIDIA GeForce RTX 4090
51741 Points +29%
Intel Core i7-13700K
NVIDIA GeForce RTX 4090
51443 Points +28%
AMD Ryzen 9 7950X3D
NVIDIA GeForce RTX 4090
50990 Points +27%
Intel Core i7-13700
NVIDIA GeForce RTX 4090
50107 Points +25%
Intel Core i5-14600K
NVIDIA GeForce RTX 4090
49203 Points +23%
Intel Core Ultra 9 285K
NVIDIA GeForce RTX 4090
44723 Points +11%
Intel Core i7-12700
NVIDIA GeForce RTX 4090
40758 Points +2%
Intel Core Ultra 5 245K
NVIDIA GeForce RTX 4090
40122 Points
Intel Core i5-13400
NVIDIA GeForce RTX 4090
35207 Points -12%
1920x1080 1080p High
Intel Core i9-14900K
NVIDIA GeForce RTX 4090
50399 Points +37%
AMD Ryzen 5 9600X
NVIDIA GeForce RTX 4090
50230 Points +37%
AMD Ryzen 7 7800X3D
NVIDIA GeForce RTX 4090
49328 Points +34%
AMD Ryzen 9 7950X
NVIDIA GeForce RTX 4090
46814 Points +27%
Intel Core i7-13700K
NVIDIA GeForce RTX 4090
46385 Points +26%
AMD Ryzen 9 7950X3D
NVIDIA GeForce RTX 4090
46052 Points +25%
Intel Core i7-13700
NVIDIA GeForce RTX 4090
45368 Points +23%
Intel Core i5-14600K
NVIDIA GeForce RTX 4090
45162 Points +23%
Intel Core Ultra 9 285K
NVIDIA GeForce RTX 4090
41496 Points +13%
Intel Core i7-12700
NVIDIA GeForce RTX 4090
37819 Points +3%
Intel Core Ultra 5 245K
NVIDIA GeForce RTX 4090
36786 Points
Intel Core i5-13400
NVIDIA GeForce RTX 4090
32711 Points -11%
1920x1080 1080p Extreme
AMD Ryzen 7 7800X3D
NVIDIA GeForce RTX 4090
22618 Points +4%
Intel Core Ultra 9 285K
NVIDIA GeForce RTX 4090
22319 Points +3%
Intel Core i5-14600K
NVIDIA GeForce RTX 4090
21954 Points +1%
Intel Core i9-14900K
NVIDIA GeForce RTX 4090
21920 Points +1%
AMD Ryzen 9 7950X3D
NVIDIA GeForce RTX 4090
21913 Points +1%
AMD Ryzen 9 7950X
NVIDIA GeForce RTX 4090
21824 Points +1%
Intel Core i7-13700
NVIDIA GeForce RTX 4090
21808 Points 0%
Intel Core i7-13700K
NVIDIA GeForce RTX 4090
21744 Points 0%
Intel Core Ultra 5 245K
NVIDIA GeForce RTX 4090
21706 Points
Intel Core i5-13400
NVIDIA GeForce RTX 4090
21646 Points 0%
Intel Core i7-12700
NVIDIA GeForce RTX 4090
21615 Points 0%
AMD Ryzen 5 9600X
NVIDIA GeForce RTX 4090
21586 Points -1%
3840x2160 4k Optimized
AMD Ryzen 9 7950X
NVIDIA GeForce RTX 4090
33943 Points +6%
Intel Core i9-14900K
NVIDIA GeForce RTX 4090
33885 Points +5%
AMD Ryzen 9 7950X3D
NVIDIA GeForce RTX 4090
33883 Points +5%
Intel Core i7-13700
NVIDIA GeForce RTX 4090
33765 Points +5%
Intel Core i7-13700K
NVIDIA GeForce RTX 4090
33719 Points +5%
Intel Core i5-14600K
NVIDIA GeForce RTX 4090
33700 Points +5%
AMD Ryzen 7 7800X3D
NVIDIA GeForce RTX 4090
33601 Points +4%
AMD Ryzen 5 9600X
NVIDIA GeForce RTX 4090
33095 Points +3%
Intel Core Ultra 9 285K
NVIDIA GeForce RTX 4090
33051 Points +3%
Intel Core i7-12700
NVIDIA GeForce RTX 4090
32608 Points +1%
Intel Core Ultra 5 245K
NVIDIA GeForce RTX 4090
32169 Points
Intel Core i5-13400
NVIDIA GeForce RTX 4090
30877 Points -4%
7680x4320 8k Optimized
AMD Ryzen 9 7950X3D
NVIDIA GeForce RTX 4090
13105 Points +3%
AMD Ryzen 9 7950X
NVIDIA GeForce RTX 4090
13082 Points +3%
Intel Core i7-13700
NVIDIA GeForce RTX 4090
13081 Points +3%
Intel Core i7-13700K
NVIDIA GeForce RTX 4090
13078 Points +3%
Intel Core i7-12700
NVIDIA GeForce RTX 4090
13070 Points +3%
Intel Core i5-13400
NVIDIA GeForce RTX 4090
13011 Points +2%
Intel Core i9-14900K
NVIDIA GeForce RTX 4090
12845 Points +1%
Intel Core i5-14600K
NVIDIA GeForce RTX 4090
12791 Points +1%
AMD Ryzen 7 7800X3D
NVIDIA GeForce RTX 4090
12770 Points 0%
Intel Core Ultra 5 245K
NVIDIA GeForce RTX 4090
12714 Points
Intel Core Ultra 9 285K
NVIDIA GeForce RTX 4090
12705 Points 0%
AMD Ryzen 5 9600X
NVIDIA GeForce RTX 4090
12498 Points -2%
Unigine Valley 1.0
1920x1080 Extreme HD DirectX AA:x8
AMD Ryzen 5 9600X
NVIDIA GeForce RTX 4090
324 fps +31%
Intel Core i9-14900K
NVIDIA GeForce RTX 4090
305.2 fps +24%
Intel Core i5-14600K
NVIDIA GeForce RTX 4090
283.4 fps +15%
AMD Ryzen 9 7950X3D
NVIDIA GeForce RTX 4090
277.2 fps +12%
Intel Core i7-13700K
NVIDIA GeForce RTX 4090
273.9 fps +11%
AMD Ryzen 9 7950X
NVIDIA GeForce RTX 4090
270.7 fps +10%
Intel Core i7-13700
NVIDIA GeForce RTX 4090
266.6 fps +8%
Intel Core Ultra 9 285K
NVIDIA GeForce RTX 4090
264 fps +7%
AMD Ryzen 7 7800X3D
NVIDIA GeForce RTX 4090
246.7 fps 0%
Intel Core Ultra 5 245K
NVIDIA GeForce RTX 4090
246.6 fps
Intel Core i7-12700
NVIDIA GeForce RTX 4090
238.4 fps -3%
Intel Core i5-13400
NVIDIA GeForce RTX 4090
226.2 fps -8%
1920x1080 Extreme HD Preset OpenGL AA:x8
AMD Ryzen 5 9600X
NVIDIA GeForce RTX 4090
331.8 fps +28%
Intel Core i9-14900K
NVIDIA GeForce RTX 4090
322.2 fps +24%
Intel Core i7-13700K
NVIDIA GeForce RTX 4090
305.7 fps +18%
Intel Core i5-14600K
NVIDIA GeForce RTX 4090
303.2 fps +17%
AMD Ryzen 9 7950X3D
NVIDIA GeForce RTX 4090
295.4 fps +14%
Intel Core i7-13700
NVIDIA GeForce RTX 4090
293.1 fps +13%
AMD Ryzen 9 7950X
NVIDIA GeForce RTX 4090
288 fps +11%
Intel Core Ultra 9 285K
NVIDIA GeForce RTX 4090
278.9 fps +7%
AMD Ryzen 7 7800X3D
NVIDIA GeForce RTX 4090
260.9 fps 0%
Intel Core Ultra 5 245K
NVIDIA GeForce RTX 4090
259.8 fps
Intel Core i7-12700
NVIDIA GeForce RTX 4090
258.5 fps -1%
Intel Core i5-13400
NVIDIA GeForce RTX 4090
242.8 fps -7%
Unigine Heaven 4.0
Extreme Preset OpenGL
AMD Ryzen 5 9600X
NVIDIA GeForce RTX 4090
472.4 fps +9%
Intel Core i9-14900K
NVIDIA GeForce RTX 4090
465.1 fps +7%
AMD Ryzen 9 7950X3D
NVIDIA GeForce RTX 4090
458.2 fps +6%
Intel Core i7-13700K
NVIDIA GeForce RTX 4090
456.9 fps +5%
Intel Core i5-14600K
NVIDIA GeForce RTX 4090
456.3 fps +5%
AMD Ryzen 9 7950X
NVIDIA GeForce RTX 4090
450.4 fps +4%
Intel Core i7-13700
NVIDIA GeForce RTX 4090
450.4 fps +4%
Intel Core Ultra 9 285K
NVIDIA GeForce RTX 4090
447.7 fps +3%
AMD Ryzen 7 7800X3D
NVIDIA GeForce RTX 4090
442.4 fps +2%
Intel Core i7-12700
NVIDIA GeForce RTX 4090
433.8 fps 0%
Intel Core Ultra 5 245K
NVIDIA GeForce RTX 4090
433.8 fps
Intel Core i5-13400
NVIDIA GeForce RTX 4090
420 fps -3%
Extreme Preset DX11
AMD Ryzen 9 7950X3D
NVIDIA GeForce RTX 4090
492.5 fps +12%
AMD Ryzen 9 7950X
NVIDIA GeForce RTX 4090
491.5 fps +12%
Intel Core i9-14900K
NVIDIA GeForce RTX 4090
483.7 fps +10%
AMD Ryzen 5 9600X
NVIDIA GeForce RTX 4090
473.9 fps +8%
Intel Core i7-13700K
NVIDIA GeForce RTX 4090
473.8 fps +8%
Intel Core i5-14600K
NVIDIA GeForce RTX 4090
473 fps +7%
AMD Ryzen 7 7800X3D
NVIDIA GeForce RTX 4090
463.8 fps +5%
Intel Core i7-13700
NVIDIA GeForce RTX 4090
462.5 fps +5%
Intel Core Ultra 9 285K
NVIDIA GeForce RTX 4090
462.4 fps +5%
Intel Core Ultra 5 245K
NVIDIA GeForce RTX 4090
440.5 fps
Intel Core i7-12700
NVIDIA GeForce RTX 4090
435.2 fps -1%
Intel Core i5-13400
NVIDIA GeForce RTX 4090
416.6 fps -5%
ComputeMark v2.1
1024x600 Normal, Score
Intel Core i5-14600K
NVIDIA GeForce RTX 4090
92397 Points +2%
AMD Ryzen 5 9600X
NVIDIA GeForce RTX 4090
92222 Points +2%
AMD Ryzen 9 7950X
NVIDIA GeForce RTX 4090
92171 Points +2%
Intel Core i9-14900K
NVIDIA GeForce RTX 4090
92026 Points +2%
Intel Core i7-13700K
NVIDIA GeForce RTX 4090
92009 Points +2%
AMD Ryzen 9 7950X3D
NVIDIA GeForce RTX 4090
91838 Points +1%
Intel Core i7-12700
NVIDIA GeForce RTX 4090
91703 Points +1%
AMD Ryzen 7 7800X3D
NVIDIA GeForce RTX 4090
91665 Points +1%
Intel Core i5-13400
NVIDIA GeForce RTX 4090
91659 Points +1%
Intel Core i7-13700
NVIDIA GeForce RTX 4090
91616 Points +1%
Intel Core Ultra 9 285K
NVIDIA GeForce RTX 4090
90932 Points 0%
Intel Core Ultra 5 245K
NVIDIA GeForce RTX 4090
90595 Points
1024x600 Normal, Fluid 3DTex
AMD Ryzen 7 7800X3D
NVIDIA GeForce RTX 4090
10875 Points +5%
Intel Core i7-13700K
NVIDIA GeForce RTX 4090
10805 Points +4%
Intel Core i5-14600K
NVIDIA GeForce RTX 4090
10797 Points +4%
AMD Ryzen 9 7950X3D
NVIDIA GeForce RTX 4090
10778 Points +4%
Intel Core i7-13700
NVIDIA GeForce RTX 4090
10759 Points +3%
Intel Core i5-13400
NVIDIA GeForce RTX 4090
10756 Points +3%
AMD Ryzen 5 9600X
NVIDIA GeForce RTX 4090
10756 Points +3%
Intel Core i7-12700
NVIDIA GeForce RTX 4090
10749 Points +3%
AMD Ryzen 9 7950X
NVIDIA GeForce RTX 4090
10724 Points +3%
Intel Core i9-14900K
NVIDIA GeForce RTX 4090
10715 Points +3%
Intel Core Ultra 9 285K
NVIDIA GeForce RTX 4090
10584 Points +2%
Intel Core Ultra 5 245K
NVIDIA GeForce RTX 4090
10396 Points
1024x600 Normal, Fluid 2DTexArr
AMD Ryzen 5 9600X
NVIDIA GeForce RTX 4090
6948 Points +1%
Intel Core i9-14900K
NVIDIA GeForce RTX 4090
6940 Points +1%
Intel Core i5-14600K
NVIDIA GeForce RTX 4090
6920 Points 0%
Intel Core i7-13700K
NVIDIA GeForce RTX 4090
6914 Points 0%
Intel Core Ultra 9 285K
NVIDIA GeForce RTX 4090
6895 Points 0%
Intel Core Ultra 5 245K
NVIDIA GeForce RTX 4090
6892 Points
AMD Ryzen 9 7950X
NVIDIA GeForce RTX 4090
6891 Points 0%
Intel Core i7-12700
NVIDIA GeForce RTX 4090
6891 Points 0%
Intel Core i7-13700
NVIDIA GeForce RTX 4090
6891 Points 0%
AMD Ryzen 9 7950X3D
NVIDIA GeForce RTX 4090
6887 Points 0%
AMD Ryzen 7 7800X3D
NVIDIA GeForce RTX 4090
6887 Points 0%
Intel Core i5-13400
NVIDIA GeForce RTX 4090
6879 Points 0%
1024x600 Normal, Mandel Vector
Intel Core i5-14600K
NVIDIA GeForce RTX 4090
17355 Points +2%
AMD Ryzen 9 7950X
NVIDIA GeForce RTX 4090
17336 Points +2%
AMD Ryzen 5 9600X
NVIDIA GeForce RTX 4090
17307 Points +1%
Intel Core i9-14900K
NVIDIA GeForce RTX 4090
17302 Points +1%
AMD Ryzen 9 7950X3D
NVIDIA GeForce RTX 4090
17301 Points +1%
Intel Core i7-13700K
NVIDIA GeForce RTX 4090
17250 Points +1%
Intel Core Ultra 9 285K
NVIDIA GeForce RTX 4090
17212 Points +1%
Intel Core i7-13700
NVIDIA GeForce RTX 4090
17207 Points +1%
Intel Core i7-12700
NVIDIA GeForce RTX 4090
17196 Points +1%
AMD Ryzen 7 7800X3D
NVIDIA GeForce RTX 4090
17156 Points 0%
Intel Core i5-13400
NVIDIA GeForce RTX 4090
17154 Points 0%
Intel Core Ultra 5 245K
NVIDIA GeForce RTX 4090
17075 Points
1024x600 Normal, Mandel Scalar
Intel Core i5-14600K
NVIDIA GeForce RTX 4090
22992 Points +2%
Intel Core i9-14900K
NVIDIA GeForce RTX 4090
22976 Points +2%
AMD Ryzen 7 7800X3D
NVIDIA GeForce RTX 4090
22926 Points +2%
AMD Ryzen 9 7950X
NVIDIA GeForce RTX 4090
22889 Points +2%
Intel Core i7-13700K
NVIDIA GeForce RTX 4090
22862 Points +1%
AMD Ryzen 5 9600X
NVIDIA GeForce RTX 4090
22843 Points +1%
Intel Core i7-12700
NVIDIA GeForce RTX 4090
22834 Points +1%
AMD Ryzen 9 7950X3D
NVIDIA GeForce RTX 4090
22834 Points +1%
Intel Core i7-13700
NVIDIA GeForce RTX 4090
22825 Points +1%
Intel Core i5-13400
NVIDIA GeForce RTX 4090
22813 Points +1%
Intel Core Ultra 5 245K
NVIDIA GeForce RTX 4090
22542 Points
Intel Core Ultra 9 285K
NVIDIA GeForce RTX 4090
22528 Points 0%
1024x600 Normal, QJuliaRayTrace
AMD Ryzen 5 9600X
NVIDIA GeForce RTX 4090
34367 Points +2%
Intel Core i5-14600K
NVIDIA GeForce RTX 4090
34333 Points +2%
AMD Ryzen 9 7950X
NVIDIA GeForce RTX 4090
34332 Points +2%
Intel Core i7-13700K
NVIDIA GeForce RTX 4090
34178 Points +1%
Intel Core i9-14900K
NVIDIA GeForce RTX 4090
34092 Points +1%
Intel Core i5-13400
NVIDIA GeForce RTX 4090
34057 Points +1%
AMD Ryzen 9 7950X3D
NVIDIA GeForce RTX 4090
34038 Points +1%
Intel Core i7-12700
NVIDIA GeForce RTX 4090
34033 Points +1%
Intel Core i7-13700
NVIDIA GeForce RTX 4090
33935 Points +1%
AMD Ryzen 7 7800X3D
NVIDIA GeForce RTX 4090
33822 Points 0%
Intel Core Ultra 5 245K
NVIDIA GeForce RTX 4090
33724 Points
Intel Core Ultra 9 285K
NVIDIA GeForce RTX 4090
33713 Points 0%

Мощность NPU

Intel Core Ultra 5 245K оснащен блоком нейронной обработки (NPU), который может особенно эффективно вычислять приложения искусственного интеллекта, являясь отдельной частью процессора.

Это ядро - тот же самый NPU, который уже используется в процессорах Meteor Lake для ноутбуков и мини-ПК с указанной вычислительной мощностью 13 TOPS. Тем не менее, Core Ultra 5 245K может обеспечить большую производительность, чем мобильные ответвления той же компании.

Пока неясно, в какой степени интеграция NPU станет более важной в будущем. Однако при сравнении производительности с современными видеокартами у NPU процессоров нет никаких шансов.

UL Procyon for Windows / Overall Score Integer NPU
Intel Core Ultra 5 245K
Intel Core Ultra 5 245K, NVIDIA GeForce RTX 4090
672 Points
Intel Core Ultra 9 285K
Intel Core Ultra 9 285K, NVIDIA GeForce RTX 4090
672 Points 0%
Asus NUC 14 Pro
Intel Core Ultra 5 125H, Arc 7-Core
508 Points -24%
Khadas Mind 2
Intel Core Ultra 7 155H, Arc 8-Core
504 Points -25%
Minisforum UH125 Pro
Intel Core Ultra 5 125H, Arc 7-Core
501 Points -25%
Acemagic F2A
Intel Core Ultra 7 155H, Arc 8-Core
499 Points -26%

Игровые бенчмарки

К сожалению, прирост производительности, который мы увидели в бенчмарках процессора, не может быть воплощен в более высокую игровую производительность. Короче говоря: Intel Core Ultra 5 245K значительно медленнее, чем Intel Core i5-14600K.

Но сначала о главном: Мы разделили игровые бенчмарки на две части. В качестве видеокарты использовалась Palit GeForce RTX 4090 GameRock OC для обеих.

В первом сравнении мы смотрим на производительность в пределе процессора. Здесь наш тестовый образец занимает лишь третью строчку и дуэлирует с Intel Core i7-12700. Core Ultra 5 245K не хватает ровно 20 процентов по сравнению с Intel Core i5-14600K. Это отрезвляющий результат, которого мы не ожидали.

Текущая топовая модель AMD в игровом секторе обеспечивает почти на 50% большую производительность. Однако эти настройки не являются репрезентативными и не отражают повседневного использования.

Во-вторых, мы позволили всем процессорам соревноваться в разрешении 2160p с максимальной детализацией. Все представители оказались ближе друг к другу, чего и следовало ожидать, поскольку решающим фактором теперь является видеокарта, что приближает нас к пределу GPU.

Тем не менее, Intel Core Ultra 5 245K удается опередить своего штатного соперника, Intel Core i5-14600K. Дефицит производительности в среднем составляет семь процентов.

Производительность, ограничение по процессору

Performance Rating - Percent
AMD Ryzen 7 7800X3D
99 pt
AMD Ryzen 9 7950X3D
91.5 pt
Intel Core i9-14900K
90.7 pt
AMD Ryzen 5 9600X
87.2 pt
AMD Ryzen 9 7950X
85.4 pt
AMD Ryzen 5 7600X
83.9 pt
Intel Core i9-13900K
83.7 pt
Intel Core i5-14600K
79.6 pt
Intel Core i7-13700K
77.5 pt
Intel Core i7-13700
76.8 pt
Intel Core Ultra 9 285K
73.5 pt
Intel Core Ultra 5 245K
66.5 pt
Intel Core i7-12700
65.9 pt
Intel Core i5-13400
57.7 pt
Intel Core i5-12400F
56.5 pt
F1 22 - 1920x1080 Low Preset AA:T AF:16x
AMD Ryzen 7 7800X3D
533 (380min, 288P1 - 637max) fps +71%
AMD Ryzen 9 7950X3D
475 (338min, 264P1 - 542max) fps +53%
Intel Core i9-14900K
462 (309min, 256P1 - 558max) fps +49%
AMD Ryzen 9 7950X
443 (278min, 245P1 - 521max) fps +42%
AMD Ryzen 5 9600X
439 (256min, 238P1 - 510max) fps +41%
AMD Ryzen 5 7600X
417 (281min, 236P1 - 488max) fps +34%
Intel Core i9-13900K
401 (265min, 222P1 - 463max) fps +29%
Intel Core i7-13700K
380 (280min, 217P1 - 437max) fps +22%
Intel Core i5-14600K
379 (280min, 225P1 - 455max) fps +22%
Intel Core i7-13700
378 (244min, 212P1 - 430max) fps +22%
Intel Core Ultra 9 285K
354 (237min, 199P1 - 414max) fps +14%
Intel Core i7-12700
313 (235min, 185P1 - 364max) fps +1%
Intel Core Ultra 5 245K
311 (242min, 180P1 - 346max) fps
Intel Core i5-12400F
271 (200min, 165P1 - 305max) fps -13%
Intel Core i5-13400
249 (197min, 152P1 - 284max) fps -20%
Far Cry 5 - 1280x720 Low Preset AA:T
AMD Ryzen 7 7800X3D
344 (220min - 464max) fps +69%
AMD Ryzen 9 7950X3D
299 (201min - 390max) fps +47%
Intel Core i9-14900K
280 (214min - 355max) fps +37%
Intel Core i9-13900K
270 (203min - 349max) fps +32%
AMD Ryzen 5 9600X
263 (201min - 342max) fps +29%
Intel Core i5-14600K
255 (199min - 343max) fps +25%
Intel Core i7-13700K
242 (183min - 317max) fps +19%
AMD Ryzen 5 7600X
241 (180min - 334max) fps +18%
AMD Ryzen 9 7950X
238 (182min - 313max) fps +17%
Intel Core i7-13700
232 (161min - 306max) fps +14%
Intel Core Ultra 9 285K
213 (169min - 274max) fps +4%
Intel Core i7-12700
204 (156min - 270max) fps 0%
Intel Core Ultra 5 245K
204 (149min - 271max) fps
Intel Core i5-13400
185 (144min - 241max) fps -9%
Intel Core i5-12400F
173 (124min - 232max) fps -15%
X-Plane 11.11 - 1280x720 low (fps_test=1)
Intel Core i9-13900K
245 fps +90%
AMD Ryzen 5 9600X
245 fps +90%
Intel Core i9-14900K
244 fps +89%
Intel Core i5-14600K
228 fps +77%
AMD Ryzen 9 7950X3D
225 fps +74%
Intel Core i7-13700K
224 fps +74%
AMD Ryzen 9 7950X
223 fps +73%
AMD Ryzen 7 7800X3D
219 fps +70%
Intel Core i7-13700
218 fps +69%
AMD Ryzen 5 7600X
217 fps +68%
Intel Core i7-12700
181.4 fps +41%
Intel Core i5-13400
155.7 fps +21%
Intel Core Ultra 9 285K
143.4 fps +11%
Intel Core Ultra 5 245K
129.1 fps
Intel Core i5-12400F
113 fps -12%
Final Fantasy XV Benchmark - 1280x720 Lite Quality
AMD Ryzen 5 9600X
237 fps +1%
Intel Core i9-13900K
236 fps 0%
AMD Ryzen 9 7950X
236 fps 0%
AMD Ryzen 5 7600X
236 fps 0%
Intel Core i7-13700
236 fps 0%
Intel Core i7-13700K
236 fps 0%
AMD Ryzen 7 7800X3D
236 fps 0%
Intel Core i5-14600K
236 fps 0%
Intel Core Ultra 9 285K
236 fps 0%
Intel Core i9-14900K
235 fps 0%
Intel Core Ultra 5 245K
235 fps
AMD Ryzen 9 7950X3D
234 fps 0%
Intel Core i7-12700
232 fps -1%
Intel Core i5-12400F
217 fps -8%
Intel Core i5-13400
217 fps -8%
Dota 2 Reborn - 1280x720 min (0/3) fastest
AMD Ryzen 7 7800X3D
322.9 (268min) fps +51%
AMD Ryzen 9 7950X3D
314.1 (261.7min) fps +47%
AMD Ryzen 9 7950X
310.6 (261.3min) fps +45%
Intel Core i9-14900K
299.9 (248.4min) fps +40%
Intel Core i9-13900K
294 (254.9min) fps +38%
AMD Ryzen 5 9600X
291 (244.2min) fps +36%
AMD Ryzen 5 7600X
278.1 (211.4min) fps +30%
Intel Core i5-14600K
261.5 (226.3min) fps +22%
Intel Core Ultra 9 285K
252.4 (219.5min) fps +18%
Intel Core i7-13700K
251.2 (215.9min) fps +18%
Intel Core i7-13700
245 (213.8min) fps +15%
Intel Core Ultra 5 245K
213.7 (189.8min) fps
Intel Core i7-12700
202.4 (178min) fps -5%
Intel Core i5-12400F
182.1 (159.5min) fps -15%
Intel Core i5-13400
182.1 (160.5min) fps -15%
The Witcher 3 - 1024x768 Low Graphics & Postprocessing
AMD Ryzen 9 7950X3D
864.7 fps +61%
AMD Ryzen 7 7800X3D
858.4 fps +60%
Intel Core i9-14900K
829 (31.9min, 380P0.1, 595P1 - 1296max) fps +55%
AMD Ryzen 9 7950X
826 (23.6min, 360P0.1, 574P1 - 1357max) fps +54%
Intel Core i9-13900K
794 (25.1min, 361P0.1, 581P1 - 1267max) fps +48%
AMD Ryzen 5 9600X
762 (66min, 266P0.1, 520P1 - 1355max) fps +42%
AMD Ryzen 5 7600X
738 fps +38%
Intel Core i7-13700K
687.5 fps +28%
Intel Core i7-13700
670.4 fps +25%
Intel Core Ultra 9 285K
663 (87.9min, 319P0.1, 454P1 - 1115max) fps +24%
Intel Core i5-14600K
632 (29.4min, 209P0.1, 471P1 - 1028max) fps +18%
Intel Core Ultra 5 245K
536 (23.7min, 212P0.1, 371P1 - 944max) fps
Intel Core i7-12700
522 fps -3%
Intel Core i5-13400
451.7 fps -16%
Intel Core i5-12400F
414 fps -23%
GTA V - 1024x768 Lowest Settings possible
AMD Ryzen 7 7800X3D
188.5 fps 0%
AMD Ryzen 9 7950X
188.2 (5.44min, 200P1 - 724max) fps 0%
AMD Ryzen 5 9600X
188.1 (3min, 200P1 - 713max) fps 0%
AMD Ryzen 9 7950X3D
188 (3.25min, 200P1 - 705max) fps 0%
AMD Ryzen 5 7600X
187.9 (7.22min, 200P1 - 815max) fps 0%
Intel Core i9-14900K
187.9 (3.8min, 200P1 - 705max) fps 0%
Intel Core i9-13900K
187.8 (2.26min, 200P1 - 688max) fps 0%
Intel Core i7-13700
187.7 (5.01min, 200P1 - 613max) fps 0%
Intel Core i5-14600K
187.7 (4.67min, 200P1 - 640max) fps 0%
Intel Core Ultra 5 245K
187.7 (4.11min, 200P1 - 547max) fps
Intel Core Ultra 9 285K
187.7 (4.29min, 200P1 - 567max) fps 0%
Intel Core i7-13700K
187.6 (3.74min, 200P1 - 607max) fps 0%
Intel Core i7-12700
187.1 (2.4min, 200P1 - 499max) fps 0%
Intel Core i5-13400
186.8 (1.87min, 166.7P1 - 445max) fps 0%
Intel Core i5-12400F
186.4 (2.09min, 166.7P1 - 413max) fps -1%
Borderlands 3 - 1280x720 Very Low Overall Quality (DX11)
AMD Ryzen 7 7800X3D
310 fps +80%
AMD Ryzen 9 7950X3D
308 fps +79%
Intel Core i9-14900K
263 fps +53%
Intel Core i9-13900K
243 fps +41%
AMD Ryzen 9 7950X
242 fps +41%
Intel Core i5-14600K
237 fps +38%
AMD Ryzen 5 7600X
228 fps +32%
AMD Ryzen 5 9600X
228 fps +32%
Intel Core i7-13700
222 fps +29%
Intel Core i7-13700K
222 fps +29%
Intel Core Ultra 9 285K
196.6 fps +14%
Intel Core i7-12700
185.6 fps +8%
Intel Core Ultra 5 245K
172.1 fps
Intel Core i5-13400
169 fps -2%
Intel Core i5-12400F
155 fps -10%
Far Cry New Dawn - 1280x720 Low Preset
AMD Ryzen 7 7800X3D
291 (218min - 442max) fps +79%
AMD Ryzen 9 7950X3D
255 (145min - 381max) fps +56%
Intel Core i9-14900K
235 (156min - 353max) fps +44%
AMD Ryzen 5 9600X
226 (163min - 362max) fps +39%
Intel Core i9-13900K
222 (150min - 335max) fps +36%
Intel Core i5-14600K
216 (168min - 312max) fps +33%
Intel Core i7-13700
203 (144min - 297max) fps +25%
Intel Core i7-13700K
203 (157min - 304max) fps +25%
AMD Ryzen 9 7950X
200 (140min - 302max) fps +23%
AMD Ryzen 5 7600X
199 (140min - 316max) fps +22%
Intel Core Ultra 9 285K
184 (140min - 275max) fps +13%
Intel Core i7-12700
174 (103min - 253max) fps +7%
Intel Core Ultra 5 245K
163 (122min - 246max) fps
Intel Core i5-13400
159 (110min - 233max) fps -2%
Intel Core i5-12400F
147 (102min - 216max) fps -10%
Shadow of the Tomb Raider - 1280x720 Lowest Preset
AMD Ryzen 7 7800X3D
407 fps +65%
AMD Ryzen 9 7950X3D
383 fps +56%
AMD Ryzen 9 7950X
332 fps +35%
Intel Core i9-14900K
332 fps +35%
AMD Ryzen 5 7600X
321 fps +30%
Intel Core i9-13900K
320 fps +30%
AMD Ryzen 5 9600X
319 fps +30%
Intel Core i5-14600K
281 fps +14%
Intel Core i7-13700
272 fps +11%
Intel Core i7-13700K
272 fps +11%
Intel Core Ultra 9 285K
263 fps +7%
Intel Core Ultra 5 245K
246 fps
Intel Core i7-12700
231 fps -6%
Intel Core i5-13400
204 fps -17%
Intel Core i5-12400F
196.4 fps -20%
Tiny Tina's Wonderlands - 1920x1080 Low Preset (DX12)
AMD Ryzen 7 7800X3D
506 fps +39%
Intel Core i9-14900K
502 fps +38%
AMD Ryzen 9 7950X3D
477 fps +31%
Intel Core i5-14600K
429 fps +18%
AMD Ryzen 9 7950X
428 fps +18%
AMD Ryzen 5 7600X
415 fps +14%
AMD Ryzen 5 9600X
411 fps +13%
Intel Core Ultra 9 285K
403 fps +11%
Intel Core i9-13900K
398 fps +10%
Intel Core i7-13700
378 fps +4%
Intel Core i7-13700K
371 fps +2%
Intel Core Ultra 5 245K
363 fps
Intel Core i7-12700
303 fps -17%
Intel Core i5-13400
275 fps -24%
Intel Core i5-12400F
258 fps -29%
Strange Brigade - 1280x720 lowest AF:1
AMD Ryzen 5 7600X
780 (275min, 597P1 - 1128max) fps +18%
Intel Core i9-14900K
762 (261min, 605P1 - 1027max) fps +15%
AMD Ryzen 7 7800X3D
760 (257min, 602P1 - 1084max) fps +15%
AMD Ryzen 5 9600X
735 (154.9min, 595P1 - 998max) fps +11%
Intel Core i5-14600K
717 (186min, 554P1 - 1036max) fps +8%
AMD Ryzen 9 7950X
698 (182.7min, 569P1 - 937max) fps +6%
Intel Core i9-13900K
691 (60.2min, 543P1 - 929max) fps +5%
Intel Core Ultra 9 285K
681 (43.7min, 531P1 - 898max) fps +3%
AMD Ryzen 9 7950X3D
672 (259min, 529P1 - 894max) fps +2%
Intel Core Ultra 5 245K
661 (248min, 487P1 - 949max) fps
Intel Core i7-13700K
646 (277min, 510P1 - 858max) fps -2%
Intel Core i7-13700
626 (284min, 497P1 - 830max) fps -5%
Intel Core i7-12700
523 (243min, 410P1 - 698max) fps -21%
Intel Core i5-12400F
444 (33.1min, 345P1 - 648max) fps -33%
Intel Core i5-13400
408 (153.5min, 319P1 - 565max) fps -38%
Metro Exodus - 1280x720 Low Quality AF:4x
AMD Ryzen 7 7800X3D
374 (214.41min - 571.76max) fps +46%
AMD Ryzen 5 9600X
349 (182.25min - 551.57max) fps +36%
Intel Core i9-14900K
319 (166.53min - 527.7max) fps +25%
AMD Ryzen 5 7600X
309 (157.23min - 500.25max) fps +21%
AMD Ryzen 9 7950X
300 (162.95min - 476.42max) fps +17%
Intel Core i5-14600K
296 (170.68min - 455.17max) fps +16%
AMD Ryzen 9 7950X3D
293 (157.18min - 462.11max) fps +14%
Intel Core Ultra 9 285K
276 (133.01min - 479.85max) fps +8%
Intel Core i7-13700
268 (127.73min - 445.04max) fps +5%
Intel Core i9-13900K
261 (116.81min - 454.13max) fps +2%
Intel Core i7-13700K
261 (117.16min - 442.09max) fps +2%
Intel Core Ultra 5 245K
256 (135.37min - 427.35max) fps
Intel Core i7-12700
233 (124.52min - 364.56max) fps -9%
Intel Core i5-12400F
203 (112.65min - 299.76max) fps -21%
Intel Core i5-13400
196.9 (110.05min - 286.04max) fps -23%
F1 2020 - 1280x720 Ultra Low Preset
AMD Ryzen 7 7800X3D
681 (531min - 769max) fps +77%
AMD Ryzen 5 9600X
630 (468min - 710max) fps +64%
Intel Core i9-14900K
598 (473min - 679max) fps +56%
AMD Ryzen 9 7950X3D
594 (461min - 653max) fps +55%
AMD Ryzen 9 7950X
563 (437min - 628max) fps +47%
AMD Ryzen 5 7600X
559 (420min - 634max) fps +46%
Intel Core i9-13900K
526 (418min - 596max) fps +37%
Intel Core i7-13700K
465 (325min - 539max) fps +21%
Intel Core i7-13700
461 (323min - 528max) fps +20%
Intel Core Ultra 9 285K
454 (355min - 499max) fps +18%
Intel Core i5-14600K
403 (333min - 436max) fps +5%
Intel Core i7-12700
388 (314min - 434max) fps +1%
Intel Core Ultra 5 245K
384 (313min - 422max) fps
Intel Core i5-12400F
322 (266min - 345max) fps -16%
Intel Core i5-13400
292 (253min - 317max) fps -24%
F1 2021 - 1280x720 Ultra Low Preset
AMD Ryzen 7 7800X3D
830 (632min, 515P1 - 919max) fps +115%
Intel Core i9-14900K
733 (560min, 450P1 - 806max) fps +90%
AMD Ryzen 5 7600X
690 (453min, 397P1 - 783max) fps +79%
AMD Ryzen 9 7950X3D
682 (522min, 418P1 - 767max) fps +77%
AMD Ryzen 9 7950X
677 (504min, 418P1 - 754max) fps +75%
AMD Ryzen 5 9600X
669 (451min, 412P1 - 741max) fps +73%
Intel Core i9-13900K
599 (469min, 379P1 - 653max) fps +55%
Intel Core i7-13700K
588 (466min, 371P1 - 639max) fps +52%
Intel Core i7-13700
572 (447min, 359P1 - 620max) fps +48%
Intel Core i5-14600K
562 (468min, 364P1 - 618max) fps +46%
Intel Core Ultra 9 285K
527 (401min, 329P1 - 583max) fps +37%
Intel Core i7-12700
448 (363min, 297P1 - 477max) fps +16%
Intel Core i5-12400F
393 (309min, 274P1 - 416max) fps +2%
Intel Core Ultra 5 245K
386 (318min, 250P1 - 422max) fps
Intel Core i5-13400
337 (277min, 237P1 - 358max) fps -13%

Производительность, ограничение по видеокарте

Performance Rating - Percent
AMD Ryzen 7 7800X3D
98.7 pt
AMD Ryzen 9 7950X3D
97 pt
Intel Core i9-14900K
96.6 pt
Intel Core i5-14600K
94.6 pt
AMD Ryzen 9 7950X
94 pt
AMD Ryzen 5 9600X
93.8 pt
AMD Ryzen 5 7600X
93.6 pt
Intel Core i9-13900K
93.4 pt
Intel Core i7-13700K
92.6 pt
Intel Core i7-13700
91.9 pt
Intel Core Ultra 9 285K
90.5 pt
Intel Core Ultra 5 245K
88 pt
Intel Core i7-12700
87.6 pt
Intel Core i5-13400
83.3 pt
Intel Core i5-12400F
80.7 pt
F1 22 - 3840x2160 Ultra High Preset AA:T AF:16x
Intel Core Ultra 9 285K
86.2 (74min, 70P1 - 101max) fps +1%
Intel Core Ultra 5 245K
85.5 (74min, 69P1 - 98max) fps
AMD Ryzen 5 9600X
85 (73min, 72P1 - 99max) fps -1%
AMD Ryzen 7 7800X3D
84.5 (72min, 71P1 - 97max) fps -1%
Intel Core i5-14600K
83.5 (72min, 71P1 - 96max) fps -2%
Intel Core i9-14900K
83.4 (72min, 71P1 - 96max) fps -2%
AMD Ryzen 5 7600X
83 (72min, 71P1 - 95max) fps -3%
AMD Ryzen 9 7950X
82.5 (72min, 71P1 - 96max) fps -4%
Intel Core i7-13700K
82.4 (72min, 71P1 - 95max) fps -4%
AMD Ryzen 9 7950X3D
82.3 (71min, 70P1 - 94max) fps -4%
Intel Core i5-12400F
81.7 (71min, 70P1 - 95max) fps -4%
Intel Core i7-13700
81.6 (71min, 70P1 - 93max) fps -5%
Intel Core i7-12700
81.3 (71min, 68P1 - 93max) fps -5%
Intel Core i5-13400
81.2 (72min, 67P1 - 93max) fps -5%
Intel Core i9-13900K
81.1 (71min, 70P1 - 93max) fps -5%
Far Cry 5 - 3840x2160 Ultra Preset AA:T
AMD Ryzen 7 7800X3D
187 (166min - 215max) fps +22%
Intel Core i9-14900K
187 (168min - 216max) fps +22%
Intel Core i9-13900K
182 (148min - 212max) fps +19%
AMD Ryzen 9 7950X3D
182 (157min - 212max) fps +19%
Intel Core i5-14600K
181 (151min - 215max) fps +18%
AMD Ryzen 9 7950X
175 (140min - 212max) fps +14%
AMD Ryzen 5 7600X
173 (142min - 209max) fps +13%
Intel Core i7-13700K
172 (137min - 206max) fps +12%
Intel Core i7-13700
171 (140min - 207max) fps +12%
AMD Ryzen 5 9600X
170 (136min - 198max) fps +11%
Intel Core Ultra 9 285K
158 (125min - 209max) fps +3%
Intel Core i7-12700
153 (117min - 203max) fps 0%
Intel Core Ultra 5 245K
153 (117min - 210max) fps
Intel Core i5-13400
142 (108min - 190max) fps -7%
Intel Core i5-12400F
131 (97min - 177max) fps -14%
X-Plane 11.11 - 3840x2160 high (fps_test=3)
AMD Ryzen 7 7800X3D
160.5 fps +72%
AMD Ryzen 9 7950X3D
158.4 fps +70%
AMD Ryzen 5 9600X
136.6 fps +46%
Intel Core i9-14900K
136.3 fps +46%
Intel Core i9-13900K
132.3 fps +42%
AMD Ryzen 5 7600X
125.8 fps +35%
Intel Core i5-14600K
124.6 fps +33%
AMD Ryzen 9 7950X
124.5 fps +33%
Intel Core i7-13700K
121.8 fps +30%
Intel Core i7-13700
119.3 fps +28%
Intel Core Ultra 9 285K
105.8 fps +13%
Intel Core i7-12700
105.4 fps +13%
Intel Core i5-13400
95 fps +2%
Intel Core Ultra 5 245K
93.4 fps
Intel Core i5-12400F
77 fps -18%
Final Fantasy XV Benchmark - 3840x2160 High Quality
Intel Core Ultra 5 245K
162.3 fps
Intel Core i9-14900K
161.9 fps 0%
Intel Core Ultra 9 285K
161.7 fps 0%
Intel Core i5-14600K
161.5 fps 0%
Intel Core i9-13900K
161.3 fps -1%
AMD Ryzen 9 7950X
161.1 fps -1%
AMD Ryzen 5 7600X
159.2 fps -2%
AMD Ryzen 7 7800X3D
158.2 fps -3%
Intel Core i7-13700
157.9 fps -3%
AMD Ryzen 9 7950X3D
157.6 fps -3%
Intel Core i7-13700K
155.9 fps -4%
Intel Core i7-12700
153.4 fps -5%
Intel Core i5-12400F
151.9 fps -6%
AMD Ryzen 5 9600X
150.9 fps -7%
Intel Core i5-13400
149.8 fps -8%
Dota 2 Reborn - 3840x2160 ultra (3/3) best looking
AMD Ryzen 7 7800X3D
258.2 (201.3min) fps +54%
AMD Ryzen 9 7950X3D
245.4 (195.9min) fps +46%
AMD Ryzen 9 7950X
234.4 (192.2min) fps +40%
Intel Core i9-13900K
230 (185.3min) fps +37%
Intel Core i9-14900K
227.8 (188.3min) fps +36%
AMD Ryzen 5 9600X
225 (189.1min) fps +34%
AMD Ryzen 5 7600X
223.4 (185.4min) fps +33%
Intel Core i5-14600K
211.5 (179.5min) fps +26%
Intel Core i7-13700K
200.2 (165.5min) fps +19%
Intel Core i7-13700
196.8 (166.7min) fps +17%
Intel Core Ultra 9 285K
193.6 (162.4min) fps +15%
Intel Core Ultra 5 245K
168 (143.3min) fps
Intel Core i7-12700
163.7 (141.2min) fps -3%
Intel Core i5-12400F
150.3 (129.4min) fps -11%
Intel Core i5-13400
149.8 (129.3min) fps -11%
The Witcher 3 - 3840x2160 High Graphics & Postprocessing (Nvidia HairWorks Off)
AMD Ryzen 5 7600X
294 fps +4%
Intel Core i9-14900K
293 (121.6min, 193.2P0.1, 243P1 - 865max) fps +3%
Intel Core i5-14600K
288 (85.6min, 166.1P0.1, 233P1 - 721max) fps +1%
Intel Core Ultra 9 285K
286 (152.2min, 226P0.1, 257P1 - 596max) fps +1%
AMD Ryzen 9 7950X
284 (88.3min, 166.6P0.1, 240P1 - 831max) fps 0%
Intel Core Ultra 5 245K
284 (132.6min, 215P0.1, 256P1 - 516max) fps
Intel Core i5-13400
282.2 fps -1%
Intel Core i7-13700
282.1 fps -1%
Intel Core i7-12700
282 fps -1%
AMD Ryzen 7 7800X3D
281 fps -1%
Intel Core i7-13700K
278.9 fps -2%
AMD Ryzen 5 9600X
277 (20.2min, 154.7P0.1, 219P1 - 925max) fps -2%
AMD Ryzen 9 7950X3D
275.2 fps -3%
Intel Core i5-12400F
254 fps -11%
Intel Core i9-13900K
239 (103.3min, 154P0.1, 203P1 - 639max) fps -16%
GTA V - 3840x2160 High/On (Advanced Graphics Off) AA:FX AF:8x
AMD Ryzen 7 7800X3D
188 (2.69min, 200P1 - 698max) fps +2%
AMD Ryzen 5 9600X
187.7 (4.85min, 200P1 - 597max) fps +2%
Intel Core i9-14900K
187.6 (4.19min, 200P1 - 613max) fps +2%
Intel Core i9-13900K
187.5 (3.71min, 200P1 - 553max) fps +2%
AMD Ryzen 9 7950X
187.5 (2.97min, 200P1 - 593max) fps +2%
Intel Core i7-13700K
187.5 (6.22min, 200P1 - 502max) fps +2%
Intel Core i5-14600K
187.4 (5.2min, 200P1 - 502max) fps +2%
Intel Core i7-13700
187.2 (1.451min, 200P1 - 464max) fps +2%
AMD Ryzen 5 7600X
186.5 (2.19min, 166.7P1 - 524max) fps +2%
AMD Ryzen 9 7950X3D
186.5 (2.67min, 166.7P1 - 575max) fps +2%
Intel Core Ultra 9 285K
186 (2.01min, 166.7P1 - 464max) fps +1%
Intel Core Ultra 5 245K
183.7 (2.01min, 125P1 - 443max) fps
Intel Core i7-12700
182 (2.29min, 142.9P1 - 460max) fps -1%
Intel Core i5-13400
178.2 (2.26min, 125P1 - 359max) fps -3%
Intel Core i5-12400F
175.6 (3.48min, 125P1 - 323max) fps -4%
Borderlands 3 - 3840x2160 Badass Overall Quality (DX11)
Intel Core i7-13700K
143.4 fps +16%
Intel Core i9-14900K
137.9 fps +11%
AMD Ryzen 7 7800X3D
137.4 fps +11%
AMD Ryzen 9 7950X3D
136.4 fps +10%
Intel Core i5-14600K
136.1 fps +10%
Intel Core i9-13900K
135.5 fps +9%
AMD Ryzen 9 7950X
135 fps +9%
AMD Ryzen 5 7600X
133.4 fps +8%
Intel Core i7-13700
132.4 fps +7%
AMD Ryzen 5 9600X
131.8 fps +6%
Intel Core Ultra 9 285K
128.6 fps +4%
Intel Core i7-12700
125.5 fps +1%
Intel Core Ultra 5 245K
124 fps
Intel Core i5-13400
120.5 fps -3%
Intel Core i5-12400F
114.4 fps -8%
Far Cry New Dawn - 3840x2160 Ultra Preset
AMD Ryzen 7 7800X3D
180 (147min - 219max) fps +50%
AMD Ryzen 9 7950X3D
171 (130min - 219max) fps +43%
Intel Core i9-14900K
161 (122min - 221max) fps +34%
Intel Core i9-13900K
154 (113min - 219max) fps +28%
Intel Core i5-14600K
153 (115min - 219max) fps +28%
AMD Ryzen 5 9600X
148 (110min - 200max) fps +23%
AMD Ryzen 9 7950X
145 (104min - 215max) fps +21%
Intel Core i7-13700
145 (106min - 212max) fps +21%
Intel Core i7-13700K
145 (109min - 213max) fps +21%
AMD Ryzen 5 7600X
142 (99min - 212max) fps +18%
Intel Core Ultra 9 285K
130 (90min - 200max) fps +8%
Intel Core i7-12700
127 (92min - 198max) fps +6%
Intel Core Ultra 5 245K
120 (85min - 198max) fps
Intel Core i5-13400
119 (88min - 182max) fps -1%
Intel Core i5-12400F
110 (79min - 170max) fps -8%
Tiny Tina's Wonderlands - 3840x2160 Badass Preset (DX12)
Intel Core Ultra 5 245K
132.6 fps
Intel Core Ultra 9 285K
132.6 fps 0%
Intel Core i9-14900K
131.7 fps -1%
AMD Ryzen 9 7950X3D
131.3 fps -1%
AMD Ryzen 5 7600X
130.6 fps -2%
Intel Core i5-14600K
130.4 fps -2%
AMD Ryzen 9 7950X
130.3 fps -2%
Intel Core i7-13700
130.2 fps -2%
AMD Ryzen 5 9600X
130 fps -2%
Intel Core i9-13900K
129.8 fps -2%
AMD Ryzen 7 7800X3D
129.8 fps -2%
Intel Core i7-12700
129.7 fps -2%
Intel Core i5-13400
129.7 fps -2%
Intel Core i7-13700K
129.6 fps -2%
Intel Core i5-12400F
114.2 fps -14%
Strange Brigade - 3840x2160 ultra AA:ultra AF:16
Intel Core i9-14900K
291 (120min, 249P1 - 467max) fps +2%
AMD Ryzen 7 7800X3D
289 (119.3min, 246P1 - 463max) fps +1%
Intel Core i5-14600K
289 (243min, 249P1 - 426max) fps +1%
Intel Core Ultra 9 285K
288 (214min, 245P1 - 410max) fps +1%
AMD Ryzen 5 9600X
286 (37.1min, 244P1 - 520max) fps 0%
Intel Core i7-13700K
285 (59.9min, 241P1 - 552max) fps 0%
AMD Ryzen 9 7950X3D
285 (53.2min, 243P1 - 469max) fps 0%
Intel Core Ultra 5 245K
285 (195.3min, 242P1 - 410max) fps
Intel Core i7-12700
284 (44.1min, 236P1 - 407max) fps 0%
AMD Ryzen 5 7600X
283 (39.7min, 242P1 - 668max) fps -1%
Intel Core i7-13700
282 (28.1min, 238P1 - 533max) fps -1%
AMD Ryzen 9 7950X
281 (31.7min, 239P1 - 482max) fps -1%
Intel Core i5-12400F
281 (59.7min, 240P1 - 421max) fps -1%
Intel Core i9-13900K
279 (59.9min, 239P1 - 532max) fps -2%
Intel Core i5-13400
278 (59.8min, 227P1 - 408max) fps -2%
Metro Exodus - 3840x2160 Ultra Quality AF:16x
Intel Core i9-14900K
143.4 (84.04min - 227.17max) fps +6%
Intel Core i5-14600K
142.1 (81.45min - 230.73max) fps +5%
AMD Ryzen 7 7800X3D
141.6 (85.41min - 213.31max) fps +5%
AMD Ryzen 9 7950X
139.7 (76.95min - 229.15max) fps +4%
AMD Ryzen 9 7950X3D
139.4 (76.47min - 227.32max) fps +3%
Intel Core i9-13900K
138.6 (76.78min - 237.3max) fps +3%
AMD Ryzen 5 9600X
138 (71.03min - 235.4max) fps +2%
AMD Ryzen 5 7600X
137 (71.99min - 228.62max) fps +2%
Intel Core i7-13700
136.9 (71.43min - 234.36max) fps +2%
Intel Core i7-13700K
136.9 (72.87min - 233.59max) fps +2%
Intel Core Ultra 5 245K
134.7 (69.85min - 225.07max) fps
Intel Core Ultra 9 285K
134 (68.14min - 237.76max) fps -1%
Intel Core i7-12700
132.4 (68.05min - 211.86max) fps -2%
Intel Core i5-13400
126.7 (68.66min - 196.97max) fps -6%
Intel Core i5-12400F
124.1 (74min - 188.01max) fps -8%
F1 2020 - 3840x2160 Ultra High Preset AA:T AF:16x
Intel Core i9-14900K
289 (237min - 340max) fps +7%
AMD Ryzen 9 7950X3D
288 (242min - 339max) fps +7%
AMD Ryzen 7 7800X3D
288 (242min - 333max) fps +7%
Intel Core i5-14600K
288 (242min - 338max) fps +7%
AMD Ryzen 5 9600X
287 (243min - 337max) fps +6%
AMD Ryzen 9 7950X
286 (245min - 335max) fps +6%
Intel Core i9-13900K
285 (240min - 333max) fps +6%
AMD Ryzen 5 7600X
285 (241min - 333max) fps +6%
Intel Core i7-13700K
284 (242min - 329max) fps +5%
Intel Core i7-13700
283 (240min - 332max) fps +5%
Intel Core i7-12700
275 (197min - 319max) fps +2%
Intel Core Ultra 9 285K
273 (236min - 319max) fps +1%
Intel Core Ultra 5 245K
270 (233min - 318max) fps
Intel Core i5-12400F
247 (202min - 285max) fps -9%
Intel Core i5-13400
229 (184min - 265max) fps -15%
F1 2021 - 3840x2160 Ultra High Preset + Raytracing AA:T AF:16x
AMD Ryzen 7 7800X3D
207 (179min, 176P1 - 230max) fps +5%
AMD Ryzen 5 9600X
205 (176min, 168P1 - 232max) fps +4%
AMD Ryzen 5 7600X
203 (173min, 170P1 - 228max) fps +3%
AMD Ryzen 9 7950X3D
203 (169min, 169P1 - 225max) fps +3%
Intel Core i9-14900K
203 (173min, 165P1 - 226max) fps +3%
Intel Core i5-14600K
201 (173min, 153P1 - 227max) fps +2%
Intel Core Ultra 9 285K
200 (168min, 137P1 - 218max) fps +2%
AMD Ryzen 9 7950X
199.1 (168min, 166P1 - 223max) fps +1%
Intel Core i7-13700K
197.5 (169min, 158P1 - 222max) fps 0%
Intel Core Ultra 5 245K
196.9 (171min, 139P1 - 211max) fps
Intel Core i7-13700
196.8 (166min, 156P1 - 217max) fps 0%
Intel Core i9-13900K
196.5 (166min, 152P1 - 220max) fps 0%
Intel Core i7-12700
193.1 (162min, 137P1 - 211max) fps -2%
Intel Core i5-12400F
185 (153min, 132P1 - 197max) fps -6%
Intel Core i5-13400
176.2 (144min, 127P1 - 189max) fps -11%

Intel Core Ultra 5 245K with Nvidia GeForce RTX 4090

мин.сред.выс.макс.QHD4K
GTA V (2015) 187.7 187.4 186 149.8 151.7 183.7
The Witcher 3 (2015) 536 485 461 308 273 284
Dota 2 Reborn (2015) 213.7 192.2 185.3 172.9 168
Final Fantasy XV Benchmark (2018) 235 235 219 214 162.3
X-Plane 11.11 (2018) 129.1 114.5 98.2 93.4
Far Cry 5 (2018) 204 177 169 156 155 153
Strange Brigade (2018) 661 503 498 491 479 285
Shadow of the Tomb Raider (2018) 246 235 232 233 229 186.6
Far Cry New Dawn (2019) 163 141 136 123 122 120
Metro Exodus (2019) 256 233 203 175.4 169 134.7
Total War: Three Kingdoms (2019) 471.8 317.1 263.6 232.3 199 104.7
Borderlands 3 (2019) 172.1 157.5 146.1 138.8 140.9 124
F1 2020 (2020) 384 333 333 314 311 270
F1 2021 (2021) 386 362 316 203 201 196.9
Far Cry 6 (2021) 181.7 156.3 139.9 143.5 137.3 126.5
God of War (2022) 227 227 223 206 181.6 127.2
Tiny Tina's Wonderlands (2022) 363 308 273 260 226 132.6
F1 22 (2022) 311 302 282 161 152.1 85.5
The Witcher 3 v4.00 (2023) 273 233 219 204 205 171.9
Dead Space Remake (2023) 215 213 207 203 176.4 97.2
Returnal (2023) 202 202 192 187 173 114
F1 23 (2023) 288 290 276 160.7 148 80
Baldur's Gate 3 (2023) 254 238 218 223 206 135.3
Cyberpunk 2077 2.1 Phantom Liberty (2023) 190.4 190.9 175.6 164.1 151 74.7
Assassin's Creed Mirage (2023) 267 259 253 183 179 128
Total War Pharaoh (2023) 399.7 235.8 197.1 159.4 157.2 147.4
Avatar Frontiers of Pandora (2023) 238 225 201 166 121 69
F1 24 (2024) 302 321 301 173.4 144.2 79.1

Энергопотребление

Компания Intel сделала большой шаг вперед в плане энергопотребления. Intel Core Ultra 5 245K смог произвести впечатление в среднем диапазоне благодаря лучшей производительности процессора, и, кроме того, мы видим, что ему требуется значительно меньше энергии.

Однако AMD показывает, что может добиться еще большего. В Core Ultra 5 245K мы не видим чрезмерного энергопотребления, характерного для предыдущих поколений процессоров. Предельная мощность составляет 159 Вт и установлена как PL1 и PL2, что означает, что процессор может вызывать максимальную производительность даже при длительной нагрузке.

Как видно из графика, лимит периодически превышается. В ходе тестирования мы наблюдали периодические пики до 173 Вт. Умеренное энергопотребление при полной нагрузке означает, что Core Ultra 5 245K хорошо охлаждается и не требует экстремальных решений для охлаждения. Кулера со спецификацией TDP 200 Вт в большинстве случаев должно быть достаточно, чтобы держать Intel Core Ultra 5 245K под контролем.

Температуры всегда находятся в пределах зеленого диапазона. Если отключить все ограничения в BIOS, энергопотребление процессора заметно не увеличится.

Температуры также находятся на уровне активированных настроек Intel по умолчанию, на которых основаны наши тесты производительности. Благодаря значительно более низкому энергопотреблению, Intel Core Ultra 5 245K может значительно превзойти Intel Core i5-14600K в сравнении эффективности.

Система тестирования энергопотребления: Холостой ход
Система тестирования энергопотребления: Cinebench-R15-nT
Система тестирования энергопотребления: Cinebench-R23-nT
Система тестирования энергопотребления: Cinebench-R23-1T
Система тестирования энергопотребления: Воспроизведение Witcher 3, Ultra-Preset
Система тестирования энергопотребления: Нагрузочный тест Prime95
Стресс-тест: Prime95
 

Эффективность

Power Consumption / Cinebench R23 Single Power Efficiency - external Monitor
Core Ultra 9 285K
19.5 Points per Watt +5%
Core Ultra 5 245K
18.6 Points per Watt
Ryzen 5 9600X
15.2 Points per Watt -18%
i5-14600K
13.8 Points per Watt -26%
R7 7800X3D
9.54 Points per Watt -49%
Power Consumption / Cinebench R23 Multi Power Efficiency - external Monitor
Core Ultra 9 285K
119.8 Points per Watt +9%
Core Ultra 5 245K
109.9 Points per Watt
R7 7800X3D
89.1 Points per Watt -19%
Ryzen 5 9600X
82.2 Points per Watt -25%
i5-14600K
73.8 Points per Watt -33%
Power Consumption / Cinebench R15 Multi Efficiency (external Monitor)
Core Ultra 9 285K
17.1 Points per Watt +8%
Core Ultra 5 245K
15.8 Points per Watt
R7 7800X3D
14.4 Points per Watt -9%
Ryzen 5 9600X
12.5 Points per Watt -21%
R5 7600X
11.7 Points per Watt -26%
i5-14600K
11.1 Points per Watt -30%
Performance Rating - Percent
AMD Ryzen 5 9600X
61 pt
AMD Ryzen 7 7800X3D
60.8 pt
Intel Core i5-13400
60.7 pt
Intel Core i5-12400F
60 pt
AMD Ryzen 5 7600X
59.2 pt
Intel Core Ultra 5 245K
53.2 pt
AMD Ryzen 9 7950X3D
49.4 pt
Intel Core i7-12700
43.6 pt
Intel Core i5-14600K
35.5 pt
Intel Core i7-13700K
34.2 pt
Intel Core i7-13700
30.8 pt
Intel Core Ultra 9 285K
30.4 pt
Intel Core i9-14900K
0 pt
Power Consumption
Cinebench R15 Multi (external Monitor)
Intel Core i9-14900K
548 (545min, 545P1 - 551max) Watt * -125%
Intel Core Ultra 9 285K
373 (360min, 360P1 - 402max) Watt * -53%
Intel Core i7-13700
365 (363min, 363P1 - 367max) Watt * -50%
Intel Core i7-13700K
357 (356min, 356P1 - 362max) Watt * -46%
Intel Core i5-14600K
329 (323min, 324P1 - 331max) Watt * -35%
Intel Core i7-12700
284 (282min, 282P1 - 287max) Watt * -16%
AMD Ryzen 9 7950X3D
273 (264min, 264P1 - 304max) Watt * -12%
Intel Core Ultra 5 245K
244 (242min, 242P1 - 246max) Watt *
AMD Ryzen 5 7600X
215 (134.8min, 135.6P1 - 259max) Watt * +12%
AMD Ryzen 5 9600X
210 (209min, 209P1 - 210max) Watt * +14%
AMD Ryzen 7 7800X3D
207 (203min, 203P1 - 216max) Watt * +15%
Intel Core i5-13400
196.6 (194.6min, 194.6P1 - 207max) Watt * +19%
Intel Core i5-12400F
194.4 (192.3min, 192.3P1 - 200max) Watt * +20%
Prime95 V2810 Stress (external Monitor)
Intel Core i9-14900K
537 (508min, 510P1 - 606max) Watt * -104%
Intel Core i7-13700
386 (363min, 364P1 - 487max) Watt * -47%
Intel Core Ultra 9 285K
382 (374min, 376P1 - 392max) Watt * -45%
Intel Core i5-14600K
370 (349min, 349P1 - 422max) Watt * -41%
Intel Core i7-13700K
357 (341min, 342P1 - 458max) Watt * -36%
Intel Core i7-12700
327 (304min, 305P1 - 394max) Watt * -24%
AMD Ryzen 9 7950X3D
276 (267min, 267P1 - 329max) Watt * -5%
Intel Core Ultra 5 245K
263 (256min, 256P1 - 271max) Watt *
Intel Core i5-12400F
239 (225min, 226P1 - 252max) Watt * +9%
Intel Core i5-13400
229 (224min, 224P1 - 247max) Watt * +13%
AMD Ryzen 5 7600X
227 (218min, 219P1 - 245max) Watt * +14%
AMD Ryzen 7 7800X3D
218 (214min, 215P1 - 223max) Watt * +17%
AMD Ryzen 5 9600X
213 (207min, 208P1 - 220max) Watt * +19%

* ... меньше = лучше

Энергопотребление

0306090120150180210240270300330360390420450480510540570Tooltip
Intel Core Ultra 5 245K Core Ultra 5 245K, NVIDIA GeForce RTX 4090; Prime95 V2810 Stress (external Monitor): Ø263 (256-271)
Intel Core Ultra 9 285K Core Ultra 9 285K, NVIDIA GeForce RTX 4090; Prime95 V2810 Stress (external Monitor): Ø382 (374-392)
Intel Core Ultra 5 245K Core Ultra 5 245K, NVIDIA GeForce RTX 4090; Cinebench R15 Multi (external Monitor): Ø244 (242-246)
Intel Core Ultra 9 285K Core Ultra 9 285K, NVIDIA GeForce RTX 4090; Cinebench R15 Multi (external Monitor): Ø373 (360-402)
Intel Core Ultra 5 245K Core Ultra 5 245K, NVIDIA GeForce RTX 4090; Cinebench R23 Single (external Monitor): Ø114.4 (109.6-170.5)
Intel Core Ultra 9 285K Core Ultra 9 285K, NVIDIA GeForce RTX 4090; Cinebench R23 Single (external Monitor): Ø120 (114.3-180.3)
Intel Core Ultra 5 245K Core Ultra 5 245K, NVIDIA GeForce RTX 4090; Cinebench R23 Multi (external Monitor): Ø228 (225-232)
Intel Core Ultra 9 285K Core Ultra 9 285K, NVIDIA GeForce RTX 4090; Cinebench R23 Multi (external Monitor): Ø355 (352-359)
Intel Core Ultra 5 245K Core Ultra 5 245K, NVIDIA GeForce RTX 4090; 1280x720 FurMark 1.19 GPU Stress Test (external Monitor): Ø552 (534-578)
Intel Core Ultra 9 285K Core Ultra 9 285K, NVIDIA GeForce RTX 4090; 1280x720 FurMark 1.19 GPU Stress Test (external Monitor): Ø557 (538-585)

Энергопотребление

0306090120150180210240270300330360390420450480510Tooltip
Intel Core Ultra 5 245K Core Ultra 5 245K, NVIDIA GeForce RTX 4090; Idle 1min (external Monitor): Ø93.8 (91.9-96.8)
Intel Core Ultra 9 285K Core Ultra 9 285K, NVIDIA GeForce RTX 4090; Idle 1min (external Monitor): Ø95.7 (91.8-102.2)
Intel Core Ultra 5 245K Core Ultra 5 245K, NVIDIA GeForce RTX 4090; Cyberpunk 2077 FHD ultra no FSR - external Monitor: Ø425 (411-433)
Intel Core Ultra 9 285K Core Ultra 9 285K, NVIDIA GeForce RTX 4090; Cyberpunk 2077 FHD ultra no FSR - external Monitor: Ø439 (432-447)
Intel Core Ultra 5 245K Core Ultra 5 245K, NVIDIA GeForce RTX 4090; 1920x1080 The Witcher 3 ultra (external Monitor): Ø492 (455-506)
Intel Core Ultra 9 285K Core Ultra 9 285K, NVIDIA GeForce RTX 4090; 1920x1080 The Witcher 3 ultra (external Monitor): Ø515 (499-537)

Общее впечатление Notebookcheck о Core Ultra 5 245K

Intel Core Ultra 5 245K предлагает отличный баланс производительности и эффективности, что делает его идеальным для игр и многозадачности. Благодаря современной архитектуре он производит впечатление универсального решения.

Декларация о непредвзятости

Протестированный экземпляр был выдан автору этого материала на короткое время для целей тестирования. Производитель товара или магазин, выдавший нам этот товар на время, не имели никакого влияния на результаты тестирования и не видели текст обзора до его публикации; статья написана не в качестве исполнения любых обязательств перед кем-либо.

This is how Notebookcheck is testing

Every year, Notebookcheck independently reviews hundreds of laptops and smartphones using standardized procedures to ensure that all results are comparable. We have continuously developed our test methods for around 20 years and set industry standards in the process. In our test labs, high-quality measuring equipment is utilized by experienced technicians and editors. These tests involve a multi-stage validation process. Our complex rating system is based on hundreds of well-founded measurements and benchmarks, which maintains objectivity. Further information on our test methods can be found here.

Этот важный материал точно понравится твоим друзьям в социальных сетях!
Mail Logo
'
> Обзоры Ноутбуков, Смартфонов, Планшетов. Тесты и Новости > Обзоры > Обзор Intel Core Ultra 5 245K: Идеальный баланс между мощностью и эффективностью?
Sebastian Bade, 2024-10-30 (Update: 2024-10-30)