

Обзор и тест Nvidia GeForce RTX 5080 Founders Edition: Видеокарта за $999 фактически делает RX 7900 XTX ненужной
Благодаря ней $1000 кажется выгодной ценой.
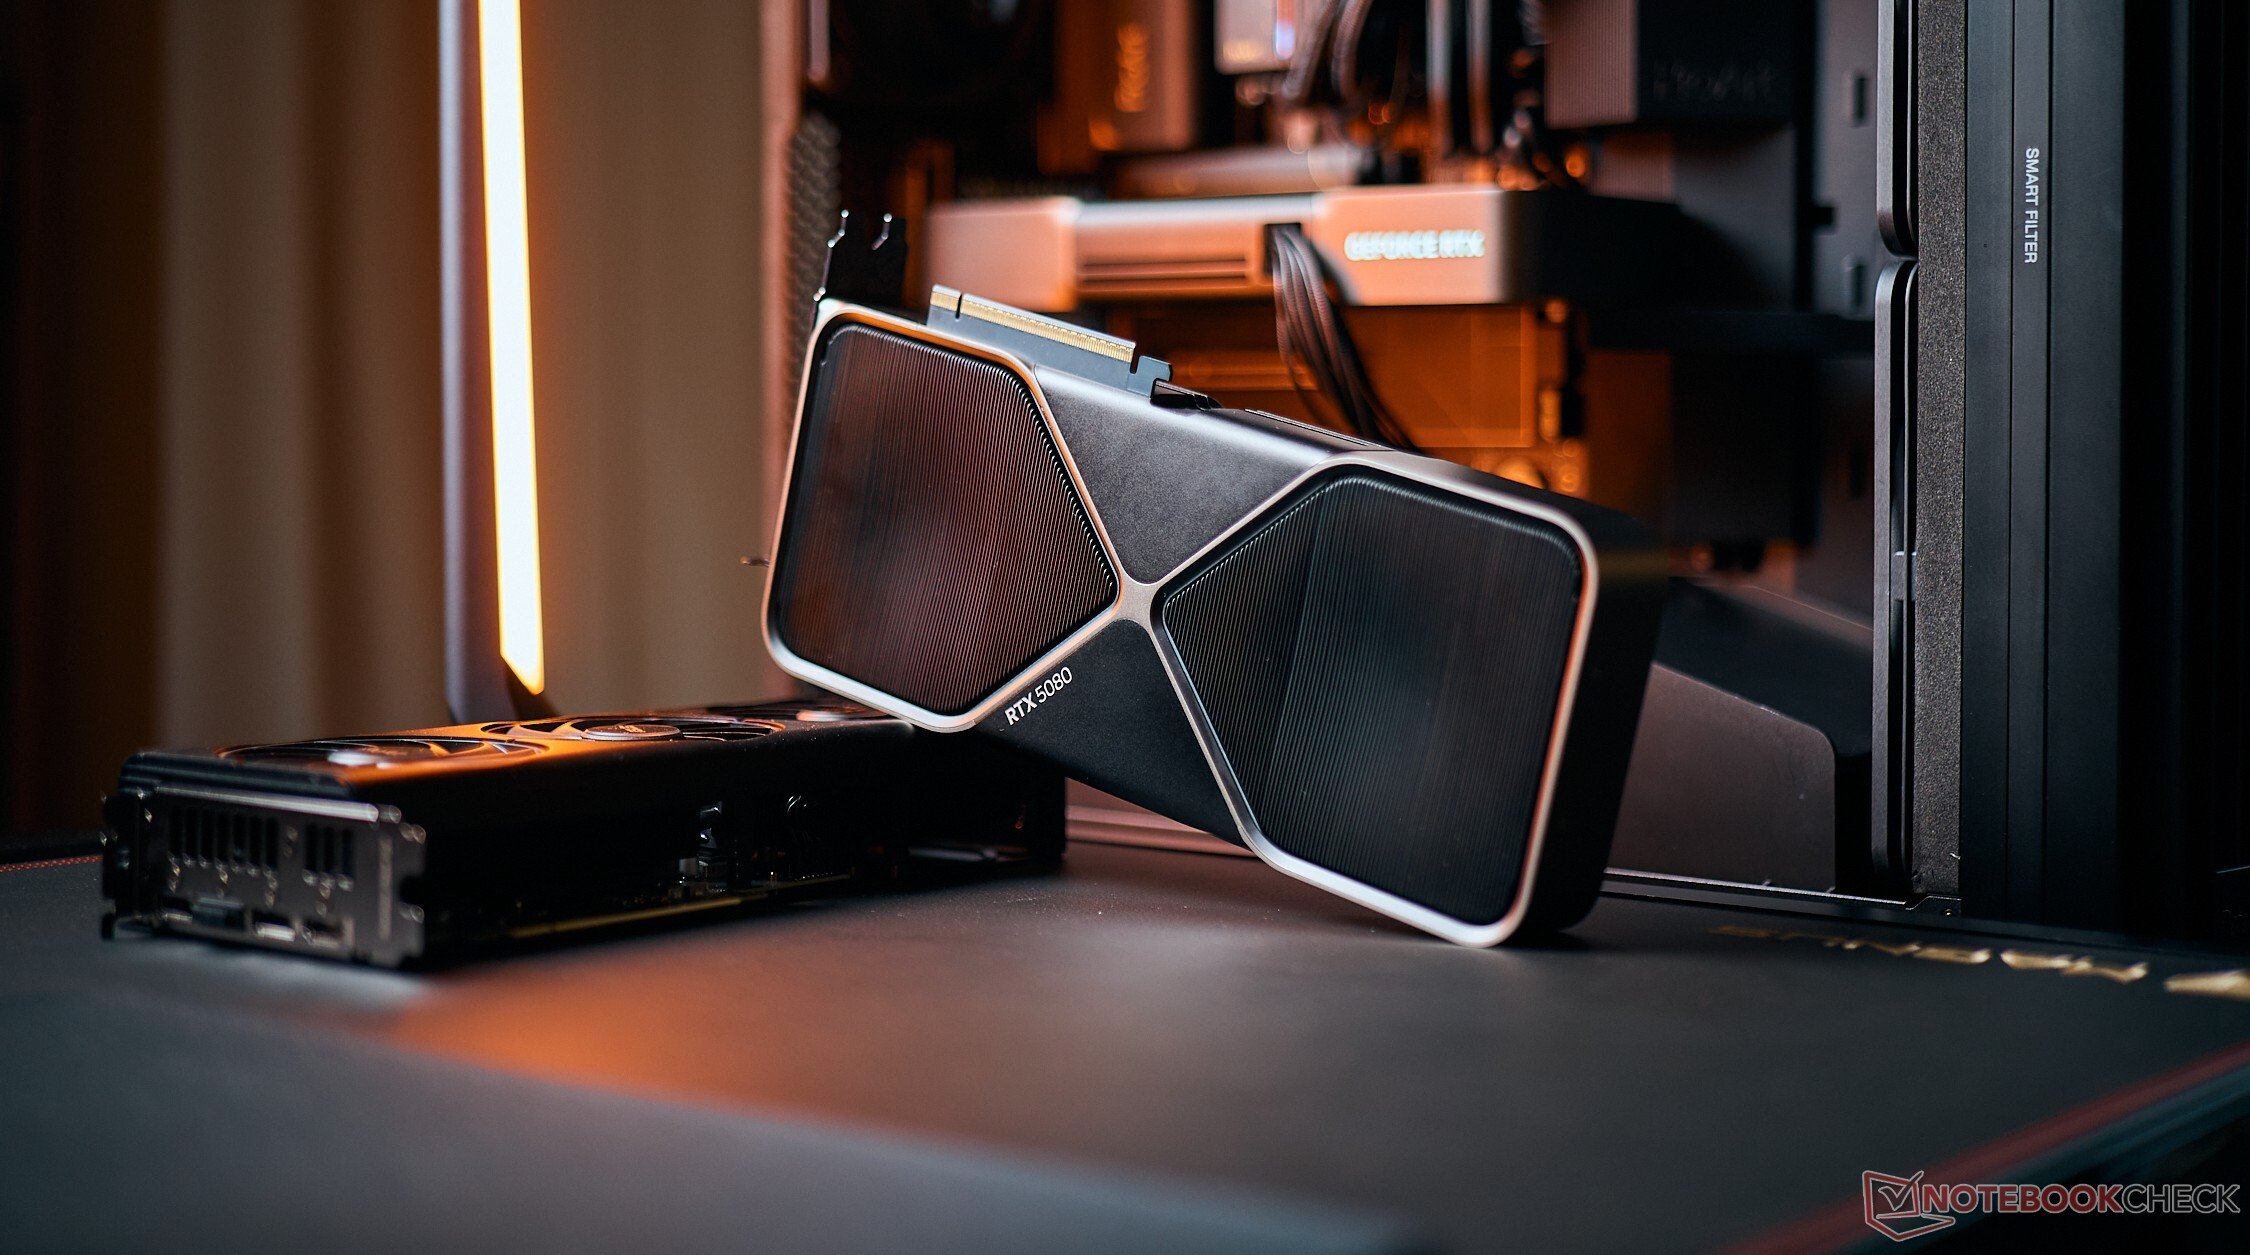
Обладая новым элегантным дизайном, который идеально смотрится в корпусе SFF, Nvidia GeForce RTX 5080 Founders Edition наконец-то готова обрушить мощь архитектуры Blackwell на геймеров массового сегмента. RTX 5080 FE обеспечивает ощутимые улучшения в вычислениях, рендеринге и трассировке лучей, а также доступ к новой технологии DLSS Frame Gen, за все те же $1000, что дает ей значительное преимущество перед Radeon RX 7900 XTX... если, конечно, Вы сможете ее приобрести.Vaidyanathan Subramaniam, 👁 Vaidyanathan Subramaniam (перевод DeepL) Опубликовано 🇺🇸 🇫🇷 ...
Оглавление
- Тестовый стенд: RTX 5080 FE отлично сочетается с Core i9-14900K
- Бенчмарки: RX 7900 XTX наступает на пятки RTX 5080
- Производительность искусственного интеллекта и вычислений: Значительный прирост по сравнению с RTX 4080 FE и RDNA 3
- Игровая производительность: Чистая растровая производительность превосходит RX 7900 XTX
Примечание: Это текущий обзор. В настоящее время проводятся дополнительные тесты, которые будут добавлены в ближайшее время. Мы не будем выносить окончательный вердикт до завершения всех тестов.
Новейшие графические процессоры Nvidia RTX 50 Blackwell разделили мнения. На сайте GeForce RTX 5090 Founders Edition по-прежнему остается графическим процессором, к которому стоит стремиться, а удивительная двухслотовая конструкция была в целом высоко оценена рецензентами, включая нас.
RTX 5090 - это "большой кахуна" Blackwell, ориентированный на профессионалов, которые также играют, и его цена составляет $1 999. Но как же быть с геймерами массового сегмента?
Представьте RTX 5080. RTX 5080 поставляется с обычными архитектурными улучшениями и во многом полагается на свое мастерство в области искусственного интеллекта в надежде перенять эстафету у RTX 4080 / RTX 4080 Super.
В этом обзоре мы рассмотрим Nvidia GeForce RTX 5080 Founders Edition (FE) и узнаем, какой подъем по сравнению с поколением Ada может дать цена в 999 долларов.
Сравнение RTX 5080 FE с другими видеокартами Nvidia
| Характеристики | RTX 5090 FE | RTX 5080 FE | RTX 4090 FE | RTX 4080 Super FE | RTX 4080 FE | Asus TUF RTX 4070 Ti Super | RTX 4070 Super FE | KFA2RTX 4060 Ti EX | RTX 3090 Ti FE | RTX 3090 FE | RTX 3080 Ti FE |
|---|---|---|---|---|---|---|---|---|---|---|---|
| Чип | GB202 | GB203 | AD102 | AD103 | AD103 | AD103 | AD104 | AD106 | GA102 | GA102 | GA102 |
| Техпроцесс FinFET | 4N | 4N | 4N | 4N | 4N | 4N | 4N | 4N | 8 нм | 8 нм | 8 нм |
| Ядра CUDA | 21760 | 10752 | 16384 | 10240 | 9728 | 8448 | 7168 | 4352 | 10752 | 10496 | 10240 |
| Блоки текстур | 680 | 336 | 512 | 320 | 304 | 264 | 224 | 136 | 336 | 328 | 320 |
| Тензорные ядра | 680 5-го поколения | 336 5-го поколения | 512 4-го поколения | 320 4-го поколения | 304 4-го поколения | 264 4-го поколения | 224 4-го поколения | 136 4-го поколения | 336 3-го поколения | 328 3-го поколения | 320 3-го поколения. |
| RT-ядра | 170 4-го поколения | 84 4-го поколения | 128 3-го поколения | 80 3-го поколения | 76 3-го поколения | 66 3-го поколения | 56 3-го поколения | 34 3-го поколения | 84 2-го поколения | 82 2-го поколения | 80 2-го поколения. |
| Базовая частота ГП | 2017 МГц | 2295 МГц | 2235 МГц | 2295 МГц | 2205 МГц | 2340 МГц | 1980 МГц | 2310 МГц | 1560 МГц | 1395 МГц | 1365 МГц |
| Максимальная частота ГП | 2407 МГц | 2617 МГц | 2520 МГц | 2550 МГц | 2505 МГц | 2610 МГц | 2475 МГц | 2535 МГц | 1860 МГц | 1695 МГц | 1665 МГц |
| Шина памяти | 512 бит | 256 бит | 384 бит | 256 бит | 256 бит | 256 бит | 192 бит | 128 бит | 384 бит | 384 бит | 384 бит |
| Пропускная способность памяти | 1.79 ТБ/с | 960ГБ/с | 1008 ГБ/с | 736.3 ГБ/с | 716.8 ГБ/с | 672 ГБ/с | 504 ГБ/с | 288 ГБ/с | 1008 ГБ/с | 936 ГБ/с | 912 ГБ/с |
| Видеопамять | 32 ГБ GDDR7 | 16 ГБ GDDR7 | 24 ГБ GDDR6X | 16 ГБ GDDR6X | 16 ГБ GDDR6X | 16 ГБ GDDR6X | 12 ГБ GDDR6X | 8 ГБ GDDR6 | 24 ГБ GDDR6X | 24 ГБ GDDR6X | 12 ГБ GDDR6X |
| Потребляемая мощность | 575 Вт | 360 Вт | 450 Вт | 320 Вт | 320 Вт | 285 Вт | 220 Вт | 160 Вт | 450 Вт | 350 Вт | 350 Вт |
GeForce RTX 5080 FE основана на графическом процессоре GB203, чьи спецификации очень напоминают RTX 3090 Ti. По сравнению с RTX 4080 FE, новый графический процессор Blackwell предлагает на 10,5% больше ядер CUDA, новые ядра 5-го поколения Tensor и 4-го поколения трассировки лучей (RT), а также 16 ГБ быстрой 256-битной VRAM GDDR7 с пропускной способностью 960 ГБ/с.
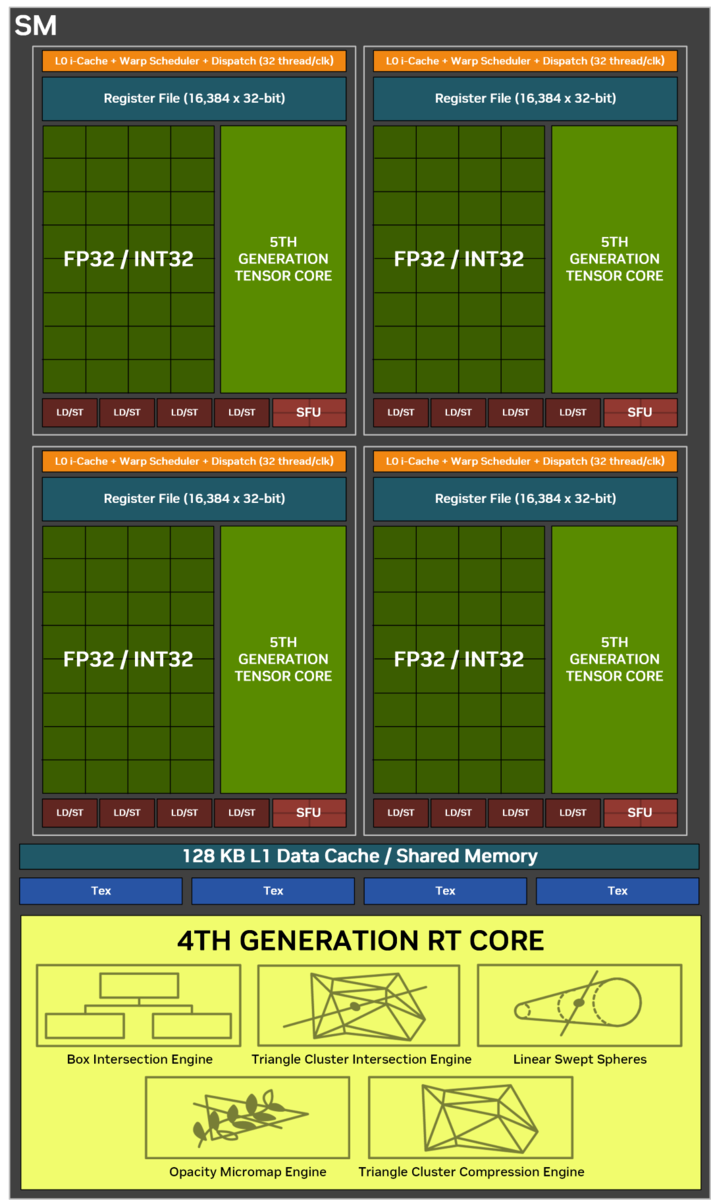
Графический процессор RTX 5080 FE имеет 45,6 миллиарда транзисторов и 84 потоковых мультипроцессора (SM), каждый из которых содержит 128 ядер CUDA, что в общей сложности составляет 10 752 ядра CUDA. Кроме того, имеется 336 ядер Tensor, 84 ядра RT, 336 блоков текстурирования (TMU) и 112 конвейеров растровых операций (ROP).
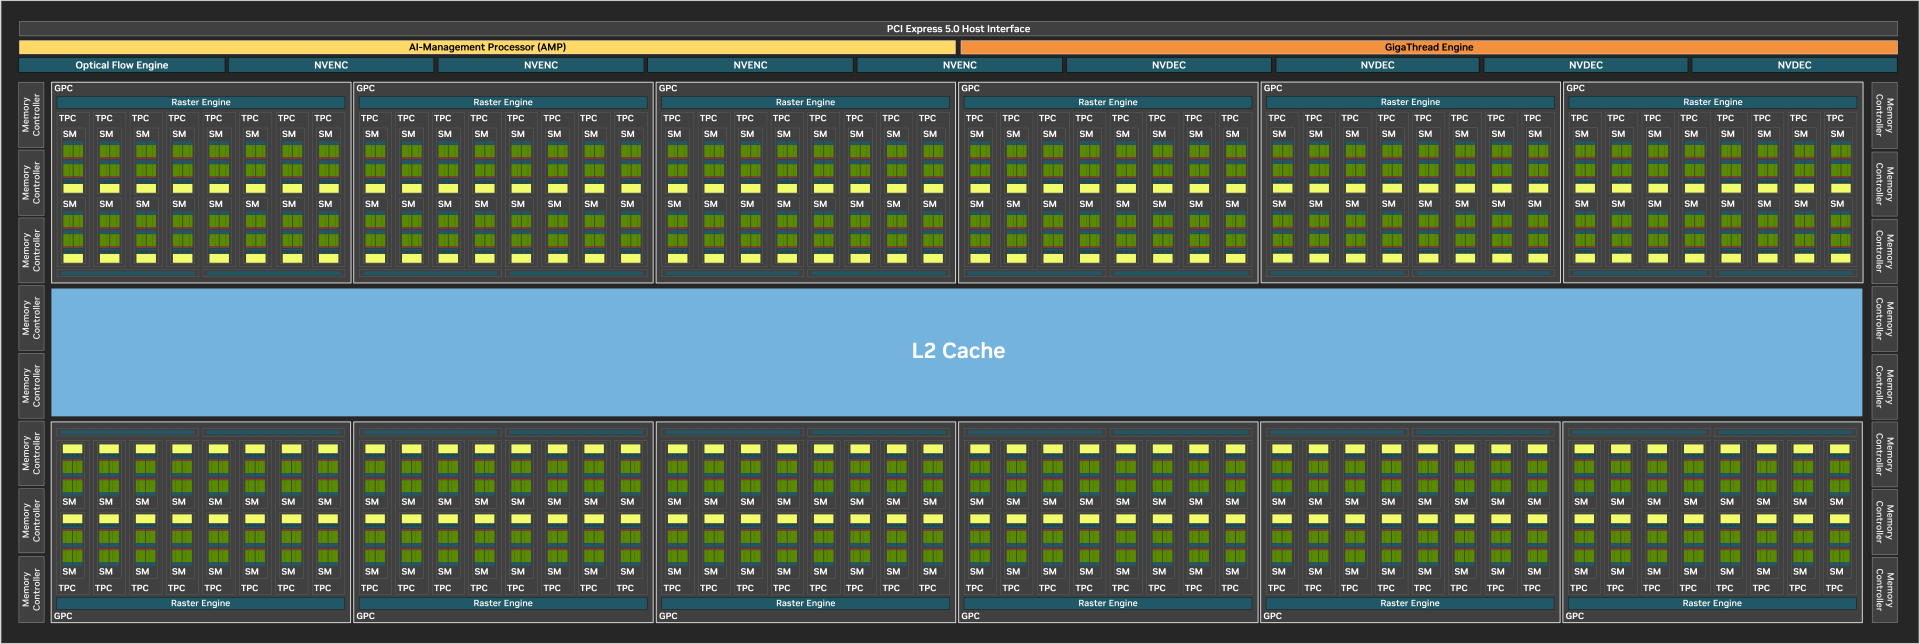
Однако по сравнению с RTX 4080 Super FE различия менее заметны. Мы получаем лишь 5%-ное увеличение количества ядер CUDA и номинально большее количество ядер Tensor и RT.
Хотя это и указывает на то, что следует сдерживать ожидания в отношении прироста от поколения к поколению, увеличение пропускной способности памяти и тактовых частот ускорения по сравнению с RTX 4080 FE и RTX 4080 Super FE потенциально может принести ощутимую пользу.
В этом RTX 5080 также помогает технологический стек Nvidia DLSS, который включает в себя Super Resolution, Ray Reconstruction и DLAA. В этом поколении появился DLSS 4, в котором используется новая модель трансформатора.
По словам представителей Nvidia, новая модель трансформатора обеспечивает достаточный резерв для усовершенствования нескольких поколений, в то время как текущая свернутая нейронная сеть (CNN) достигла предела оптимизации.
Также новым в поколении RTX 50 Blackwell является поддержка аппаратного флип-метринга. Flip metering переносит логику кадровой развёртки в дисплейный движок и обеспечивает новые возможности генерации кадров до 4x. В этом процессе помогает сопроцессор RISC-V в GPU, который разгружает CPU от планирования задач для снижения задержек.
Все это, конечно, сопровождается дополнительным энергопотреблением в 40 Вт, при этом RTX 5080 FE имеет мощность 360 Вт.
Тестовый стенд: RTX 5080 FE отлично сочетается с Core i9-14900K
Многие из наших обзоров настольных GPU в недавнем прошлом были выполнены на Intel Core i9-13900K тестовом стенде. Начиная с этого поколения, мы переходим на более новые варианты процессоров, включая Core i9-14900K и AMD Ryzen 7 9800X3D.
На данный момент мы располагаем ограниченным количеством графических процессоров, но мы стараемся сделать все возможное, чтобы в ближайшие недели и месяцы в нашу базу данных попало как можно больше GPU.
Следующие компоненты составляют наш текущий тестовый стенд:
- Открытый тестовый стенд Cooler Master MasterFrame 700
- Intel Core i9-14900K с профилем Intel Extreme, установленным в BIOS
- Материнская плата Gigabyte Z790 Aorus Master
- Твердотельный накопитель Sabrent Rocket 4 Plus Gen4 2 ТБ NVMe и 2x твердотельных накопителя Crucial MX500 1 ТБ SATA для ОС, бенчмарков и игр
- 2x 16 ГБ оперативной памяти Kingston Fury Renegade DDR5-6400 с таймингами 32-39-39-80 при напряжении 1,40 В
- Монитор Alienware AW3225QF 4K 240 Гц QD-OLED
- Кулер Thermaltake TH420 V2 Ultra EX ARGB Кулер AiO
- Полностью модульный БП Cooler Master MVE Gold V2 1250 ATX 3.0
Использовалась операционная система Windows 11 24H2 с последними исправлениями, а также драйвер Nvidia Game Ready Driver версии 572.12, выпущенный для прессы.
Мы хотели бы поблагодарить Cooler Master за предоставленный тестовый стенд и БП, Gigabyte за материнскую плату, Sabrent за SSD, Dell за монитор Alienware, Thermaltake за кулер AiO, и Kingston за память.
Бенчмарки: RX 7900 XTX наступает на пятки RTX 5080
В совокупных синтетических бенчмарках, состоящих из тестов 3DMark и Unigine, RTX 5080 Founders Edition удается лишь немного превзойти XFX Radeon RX 7900 XTX.
Если в тестах с трассировкой лучей, таких как 3DMark Port Royal и Speed Way, карта Blackwell демонстрирует очевидный выигрыш по сравнению с Radeon, то в растровых тестах RX 7900 XTX находится на одном уровне с RTX 5080.
| Performance Rating - Percent | |
| NVIDIA GeForce RTX 5090 Founders Edition | |
| NVIDIA GeForce RTX 4090 | |
| NVIDIA GeForce RTX 5080 Founders Edition | |
| XFX Radeon RX 7900 XTX Merc 310 Black Edition | |
| Zotac RTX 4080 Super Trinity Black Edition -1! | |
| KFA2 GeForce RTX 4080 Super SG -1! | |
| NVIDIA GeForce RTX 4080 Founders Edition | |
| ASUS TUF Gaming Radeon RX 7800 XT | |
| 3DMark | |
| 1920x1080 Fire Strike Graphics | |
| NVIDIA GeForce RTX 5090 Founders Edition | |
| NVIDIA GeForce RTX 4090 | |
| XFX Radeon RX 7900 XTX Merc 310 Black Edition | |
| NVIDIA GeForce RTX 5080 Founders Edition | |
| Zotac RTX 4080 Super Trinity Black Edition | |
| NVIDIA GeForce RTX 4080 Founders Edition | |
| KFA2 GeForce RTX 4080 Super SG | |
| ASUS TUF Gaming Radeon RX 7800 XT | |
| Fire Strike Extreme Graphics | |
| NVIDIA GeForce RTX 5090 Founders Edition | |
| NVIDIA GeForce RTX 4090 | |
| XFX Radeon RX 7900 XTX Merc 310 Black Edition | |
| NVIDIA GeForce RTX 5080 Founders Edition | |
| Zotac RTX 4080 Super Trinity Black Edition | |
| KFA2 GeForce RTX 4080 Super SG | |
| NVIDIA GeForce RTX 4080 Founders Edition | |
| ASUS TUF Gaming Radeon RX 7800 XT | |
| 3840x2160 Fire Strike Ultra Graphics | |
| NVIDIA GeForce RTX 5090 Founders Edition | |
| NVIDIA GeForce RTX 4090 | |
| XFX Radeon RX 7900 XTX Merc 310 Black Edition | |
| NVIDIA GeForce RTX 5080 Founders Edition | |
| Zotac RTX 4080 Super Trinity Black Edition | |
| KFA2 GeForce RTX 4080 Super SG | |
| NVIDIA GeForce RTX 4080 Founders Edition | |
| ASUS TUF Gaming Radeon RX 7800 XT | |
| 2560x1440 Port Royal Graphics | |
| NVIDIA GeForce RTX 5090 Founders Edition | |
| NVIDIA GeForce RTX 4090 | |
| NVIDIA GeForce RTX 5080 Founders Edition | |
| Zotac RTX 4080 Super Trinity Black Edition | |
| KFA2 GeForce RTX 4080 Super SG | |
| XFX Radeon RX 7900 XTX Merc 310 Black Edition | |
| NVIDIA GeForce RTX 4080 Founders Edition | |
| ASUS TUF Gaming Radeon RX 7800 XT | |
| 2560x1440 Speed Way Score | |
| NVIDIA GeForce RTX 5090 Founders Edition | |
| NVIDIA GeForce RTX 4090 | |
| NVIDIA GeForce RTX 5080 Founders Edition | |
| Zotac RTX 4080 Super Trinity Black Edition | |
| KFA2 GeForce RTX 4080 Super SG | |
| NVIDIA GeForce RTX 4080 Founders Edition | |
| XFX Radeon RX 7900 XTX Merc 310 Black Edition | |
| ASUS TUF Gaming Radeon RX 7800 XT | |
| Steel Nomad Score | |
| NVIDIA GeForce RTX 5090 Founders Edition | |
| NVIDIA GeForce RTX 4090 | |
| NVIDIA GeForce RTX 5080 Founders Edition | |
| XFX Radeon RX 7900 XTX Merc 310 Black Edition | |
| NVIDIA GeForce RTX 4080 Founders Edition | |
| ASUS TUF Gaming Radeon RX 7800 XT | |
| 2560x1440 Time Spy Graphics | |
| NVIDIA GeForce RTX 5090 Founders Edition | |
| NVIDIA GeForce RTX 4090 | |
| XFX Radeon RX 7900 XTX Merc 310 Black Edition | |
| NVIDIA GeForce RTX 5080 Founders Edition | |
| Zotac RTX 4080 Super Trinity Black Edition | |
| KFA2 GeForce RTX 4080 Super SG | |
| NVIDIA GeForce RTX 4080 Founders Edition | |
| ASUS TUF Gaming Radeon RX 7800 XT | |
| Unigine Heaven 4.0 - Extreme Preset DX11 | |
| NVIDIA GeForce RTX 5090 Founders Edition | |
| NVIDIA GeForce RTX 4090 | |
| NVIDIA GeForce RTX 5080 Founders Edition | |
| Zotac RTX 4080 Super Trinity Black Edition | |
| XFX Radeon RX 7900 XTX Merc 310 Black Edition | |
| KFA2 GeForce RTX 4080 Super SG | |
| NVIDIA GeForce RTX 4080 Founders Edition | |
| ASUS TUF Gaming Radeon RX 7800 XT | |
| Unigine Valley 1.0 - 1920x1080 Extreme HD DirectX AA:x8 | |
| XFX Radeon RX 7900 XTX Merc 310 Black Edition | |
| Zotac RTX 4080 Super Trinity Black Edition | |
| KFA2 GeForce RTX 4080 Super SG | |
| NVIDIA GeForce RTX 4090 | |
| NVIDIA GeForce RTX 5090 Founders Edition | |
| NVIDIA GeForce RTX 4080 Founders Edition | |
| NVIDIA GeForce RTX 5080 Founders Edition | |
| ASUS TUF Gaming Radeon RX 7800 XT | |
| Unigine Superposition | |
| 3840x2160 4k Optimized | |
| NVIDIA GeForce RTX 5090 Founders Edition | |
| NVIDIA GeForce RTX 4090 | |
| NVIDIA GeForce RTX 5080 Founders Edition | |
| XFX Radeon RX 7900 XTX Merc 310 Black Edition | |
| Zotac RTX 4080 Super Trinity Black Edition | |
| KFA2 GeForce RTX 4080 Super SG | |
| NVIDIA GeForce RTX 4080 Founders Edition | |
| ASUS TUF Gaming Radeon RX 7800 XT | |
| 7680x4320 8k Optimized | |
| NVIDIA GeForce RTX 5090 Founders Edition | |
| NVIDIA GeForce RTX 4090 | |
| NVIDIA GeForce RTX 5080 Founders Edition | |
| XFX Radeon RX 7900 XTX Merc 310 Black Edition | |
| Zotac RTX 4080 Super Trinity Black Edition | |
| KFA2 GeForce RTX 4080 Super SG | |
| NVIDIA GeForce RTX 4080 Founders Edition | |
| ASUS TUF Gaming Radeon RX 7800 XT | |
| 3DMark Fire Strike Score | 45908 баллов | |
| 3DMark Fire Strike Extreme Score | 35517 баллов | |
| 3DMark Time Spy Score | 29987 баллов | |
| 3DMark Steel Nomad Score | 8159 баллов | |
? | ||
Производительность искусственного интеллекта и вычислений: Значительный прирост по сравнению с RTX 4080 FE и RDNA 3
В MLPerf RTX 5080 FE демонстрирует на 19% более высокую скорость генерации токенов по сравнению с RTX 4080 FE, хотя и отстает от RTX 4090 на 10%. Нет необходимости говорить о том, что RTX 5090 FE почти на 60% быстрее RTX 5080 FE в генерации токенов благодаря 102% большему количеству ядер.
RTX 4090 также оказывается на 29% быстрее RTX 5080 FE в Blender 3.3 CUDA. Хотя графические процессоры AMD по понятным причинам находятся в невыгодном положении в тестах CUDA, RX 7900 XTX отстает от RTX 5080 FE всего на 9% в суммарных результатах ComputeMark.
| MLPerf Client 0.5 - overall generation rate | |
| NVIDIA GeForce RTX 5090 Founders Edition | |
| NVIDIA GeForce RTX 4090 | |
| NVIDIA GeForce RTX 5080 Founders Edition | |
| NVIDIA GeForce RTX 4080 Founders Edition | |
| Blender | |
| v3.3 Classroom CUDA | |
| NVIDIA GeForce RTX 4080 Founders Edition | |
| NVIDIA GeForce RTX 5080 Founders Edition | |
| NVIDIA GeForce RTX 4090 | |
| NVIDIA GeForce RTX 5090 Founders Edition | |
| v3.3 Classroom OPTIX/RTX | |
| NVIDIA GeForce RTX 4080 Founders Edition | |
| NVIDIA GeForce RTX 5080 Founders Edition | |
| NVIDIA GeForce RTX 4090 | |
| NVIDIA GeForce RTX 5090 Founders Edition | |
| V-Ray Benchmark Next 4.10 - GPU | |
| NVIDIA GeForce RTX 5090 Founders Edition | |
| NVIDIA GeForce RTX 4090 | |
| NVIDIA GeForce RTX 5080 Founders Edition | |
| NVIDIA GeForce RTX 4080 Founders Edition | |
| ASUS TUF Gaming Radeon RX 7800 XT | |
| XFX Radeon RX 7900 XTX Merc 310 Black Edition | |
| V-Ray 5 Benchmark | |
| GPU CUDA | |
| NVIDIA GeForce RTX 5090 Founders Edition | |
| NVIDIA GeForce RTX 4090 | |
| NVIDIA GeForce RTX 5080 Founders Edition | |
| NVIDIA GeForce RTX 4080 Founders Edition | |
| ASUS TUF Gaming Radeon RX 7800 XT | |
| XFX Radeon RX 7900 XTX Merc 310 Black Edition | |
| GPU RTX | |
| NVIDIA GeForce RTX 5090 Founders Edition | |
| NVIDIA GeForce RTX 4090 | |
| NVIDIA GeForce RTX 5080 Founders Edition | |
| XFX Radeon RX 7900 XTX Merc 310 Black Edition | |
| NVIDIA GeForce RTX 4080 Founders Edition | |
| ComputeMark v2.1 | |
| 1024x600 Normal, Score | |
| NVIDIA GeForce RTX 5090 Founders Edition | |
| NVIDIA GeForce RTX 4090 | |
| NVIDIA GeForce RTX 5080 Founders Edition | |
| XFX Radeon RX 7900 XTX Merc 310 Black Edition | |
| NVIDIA GeForce RTX 4080 Founders Edition | |
| ASUS TUF Gaming Radeon RX 7800 XT | |
| 1024x600 Normal, Fluid 3DTex | |
| NVIDIA GeForce RTX 5090 Founders Edition | |
| NVIDIA GeForce RTX 5080 Founders Edition | |
| NVIDIA GeForce RTX 4090 | |
| XFX Radeon RX 7900 XTX Merc 310 Black Edition | |
| NVIDIA GeForce RTX 4080 Founders Edition | |
| ASUS TUF Gaming Radeon RX 7800 XT | |
| 1024x600 Normal, Fluid 2DTexArr | |
| NVIDIA GeForce RTX 5090 Founders Edition | |
| XFX Radeon RX 7900 XTX Merc 310 Black Edition | |
| NVIDIA GeForce RTX 5080 Founders Edition | |
| NVIDIA GeForce RTX 4090 | |
| NVIDIA GeForce RTX 4080 Founders Edition | |
| ASUS TUF Gaming Radeon RX 7800 XT | |
| 1024x600 Normal, Mandel Vector | |
| NVIDIA GeForce RTX 5090 Founders Edition | |
| NVIDIA GeForce RTX 4090 | |
| NVIDIA GeForce RTX 5080 Founders Edition | |
| XFX Radeon RX 7900 XTX Merc 310 Black Edition | |
| NVIDIA GeForce RTX 4080 Founders Edition | |
| ASUS TUF Gaming Radeon RX 7800 XT | |
| 1024x600 Normal, Mandel Scalar | |
| NVIDIA GeForce RTX 5090 Founders Edition | |
| NVIDIA GeForce RTX 4090 | |
| XFX Radeon RX 7900 XTX Merc 310 Black Edition | |
| NVIDIA GeForce RTX 5080 Founders Edition | |
| NVIDIA GeForce RTX 4080 Founders Edition | |
| ASUS TUF Gaming Radeon RX 7800 XT | |
| 1024x600 Normal, QJuliaRayTrace | |
| NVIDIA GeForce RTX 5090 Founders Edition | |
| NVIDIA GeForce RTX 4090 | |
| NVIDIA GeForce RTX 5080 Founders Edition | |
| NVIDIA GeForce RTX 4080 Founders Edition | |
| XFX Radeon RX 7900 XTX Merc 310 Black Edition | |
| ASUS TUF Gaming Radeon RX 7800 XT | |
| LuxMark v2.0 64Bit | |
| Room GPUs-only | |
| NVIDIA GeForce RTX 5090 Founders Edition | |
| NVIDIA GeForce RTX 4090 | |
| NVIDIA GeForce RTX 5080 Founders Edition | |
| NVIDIA GeForce RTX 4080 Founders Edition | |
| XFX Radeon RX 7900 XTX Merc 310 Black Edition | |
| ASUS TUF Gaming Radeon RX 7800 XT | |
| Sala GPUs-only | |
| NVIDIA GeForce RTX 5090 Founders Edition | |
| NVIDIA GeForce RTX 4090 | |
| NVIDIA GeForce RTX 5080 Founders Edition | |
| NVIDIA GeForce RTX 4080 Founders Edition | |
| XFX Radeon RX 7900 XTX Merc 310 Black Edition | |
| ASUS TUF Gaming Radeon RX 7800 XT | |
* ... меньше = лучше
Игровая производительность: Чистая растровая производительность превосходит RX 7900 XTX
RTX 5080 FE имеет ощутимое преимущество в 9% над RX 7900 XTX в совокупных чисто растровых игровых тестах на настройках Ultra в разрешениях 1080p, 2K и 4K, но при этом отстает от RTX 4090 на аналогичную величину. При переходе с RTX 4080 FE ожидайте в среднем 33% прироста в зависимости от игры и разрешения.
Хотя RTX 5080 FE с трудом приближается к заветной отметке 60 fps в играх с большим количеством текстур, таких как Avatar: Frontiers of Pandora и Black Myth: Wukong, многие современные ААА-игры должны воспроизводиться в родном разрешении 4K без помощи апскейлинга, если в них не используется трассировка лучей.
Как и в случае с серией RTX 40, Вам понадобится быстрый процессор, чтобы RTX 5080 FE работал без сбоев. Core i9-14900K - неплохой вариант, если Вы в основном играете в разрешении 2K и выше, но для настроек 1080p и ниже Вам очень пригодится Ryzen 7 9800X3D.
| Performance Rating - Percent | |
| NVIDIA GeForce RTX 5090 Founders Edition | |
| NVIDIA GeForce RTX 4090 | |
| NVIDIA GeForce RTX 5080 Founders Edition | |
| XFX Radeon RX 7900 XTX Merc 310 Black Edition | |
| NVIDIA GeForce RTX 4080 Founders Edition | |
| Indiana Jones and the Great Circle | |
| 3840x2160 Very Ultra Preset | |
| NVIDIA GeForce RTX 5090 Founders Edition | |
| NVIDIA GeForce RTX 4090 | |
| NVIDIA GeForce RTX 5080 Founders Edition | |
| XFX Radeon RX 7900 XTX Merc 310 Black Edition | |
| NVIDIA GeForce RTX 4080 Founders Edition | |
| 2560x1440 Very Ultra Preset | |
| NVIDIA GeForce RTX 5090 Founders Edition | |
| NVIDIA GeForce RTX 4090 | |
| NVIDIA GeForce RTX 5080 Founders Edition | |
| XFX Radeon RX 7900 XTX Merc 310 Black Edition | |
| NVIDIA GeForce RTX 4080 Founders Edition | |
| 1920x1080 Very Ultra Preset | |
| NVIDIA GeForce RTX 5090 Founders Edition | |
| NVIDIA GeForce RTX 4090 | |
| NVIDIA GeForce RTX 5080 Founders Edition | |
| XFX Radeon RX 7900 XTX Merc 310 Black Edition | |
| NVIDIA GeForce RTX 4080 Founders Edition | |
| Black Myth: Wukong | |
| 3840x2160 cinematic TSR 100 | |
| NVIDIA GeForce RTX 5090 Founders Edition | |
| NVIDIA GeForce RTX 4090 | |
| NVIDIA GeForce RTX 5080 Founders Edition | |
| XFX Radeon RX 7900 XTX Merc 310 Black Edition | |
| NVIDIA GeForce RTX 4080 Founders Edition | |
| 2560x1440 cinematic TSR 100 | |
| NVIDIA GeForce RTX 5090 Founders Edition | |
| NVIDIA GeForce RTX 4090 | |
| NVIDIA GeForce RTX 5080 Founders Edition | |
| XFX Radeon RX 7900 XTX Merc 310 Black Edition | |
| NVIDIA GeForce RTX 4080 Founders Edition | |
| 1920x1080 cinematic TSR 100 | |
| NVIDIA GeForce RTX 5090 Founders Edition | |
| NVIDIA GeForce RTX 4090 | |
| NVIDIA GeForce RTX 5080 Founders Edition | |
| XFX Radeon RX 7900 XTX Merc 310 Black Edition | |
| NVIDIA GeForce RTX 4080 Founders Edition | |
| Alan Wake 2 | |
| 3840x2160 High Preset | |
| NVIDIA GeForce RTX 5090 Founders Edition | |
| NVIDIA GeForce RTX 4090 | |
| XFX Radeon RX 7900 XTX Merc 310 Black Edition | |
| NVIDIA GeForce RTX 5080 Founders Edition | |
| NVIDIA GeForce RTX 4080 Founders Edition | |
| 2560x1440 High Preset | |
| NVIDIA GeForce RTX 5090 Founders Edition | |
| XFX Radeon RX 7900 XTX Merc 310 Black Edition | |
| NVIDIA GeForce RTX 4090 | |
| NVIDIA GeForce RTX 5080 Founders Edition | |
| NVIDIA GeForce RTX 4080 Founders Edition | |
| 1920x1080 High Preset | |
| NVIDIA GeForce RTX 5090 Founders Edition | |
| NVIDIA GeForce RTX 4090 | |
| XFX Radeon RX 7900 XTX Merc 310 Black Edition | |
| NVIDIA GeForce RTX 5080 Founders Edition | |
| NVIDIA GeForce RTX 4080 Founders Edition | |
| F1 24 | |
| 3840x2160 Ultra High Preset AA:T AF:16x | |
| NVIDIA GeForce RTX 5090 Founders Edition | |
| NVIDIA GeForce RTX 4090 | |
| NVIDIA GeForce RTX 5080 Founders Edition | |
| NVIDIA GeForce RTX 4080 Founders Edition | |
| XFX Radeon RX 7900 XTX Merc 310 Black Edition | |
| 2560x1440 Ultra High Preset AA:T AF:16x | |
| NVIDIA GeForce RTX 5090 Founders Edition | |
| NVIDIA GeForce RTX 4090 | |
| NVIDIA GeForce RTX 5080 Founders Edition | |
| NVIDIA GeForce RTX 4080 Founders Edition | |
| XFX Radeon RX 7900 XTX Merc 310 Black Edition | |
| 1920x1080 Ultra High Preset AA:T AF:16x | |
| NVIDIA GeForce RTX 5090 Founders Edition | |
| NVIDIA GeForce RTX 4090 | |
| NVIDIA GeForce RTX 5080 Founders Edition | |
| NVIDIA GeForce RTX 4080 Founders Edition | |
| XFX Radeon RX 7900 XTX Merc 310 Black Edition | |
| Assassin's Creed Mirage | |
| 3840x2160 Ultra High Preset (Adaptive Quality Off) | |
| NVIDIA GeForce RTX 5090 Founders Edition | |
| NVIDIA GeForce RTX 4090 | |
| NVIDIA GeForce RTX 5080 Founders Edition | |
| XFX Radeon RX 7900 XTX Merc 310 Black Edition | |
| NVIDIA GeForce RTX 4080 Founders Edition | |
| 2560x1440 Ultra High Preset (Adaptive Quality Off) | |
| NVIDIA GeForce RTX 5090 Founders Edition | |
| XFX Radeon RX 7900 XTX Merc 310 Black Edition | |
| NVIDIA GeForce RTX 5080 Founders Edition | |
| NVIDIA GeForce RTX 4080 Founders Edition | |
| NVIDIA GeForce RTX 4090 | |
| 1920x1080 Ultra High Preset (Adaptive Quality Off) | |
| NVIDIA GeForce RTX 4090 | |
| NVIDIA GeForce RTX 5090 Founders Edition | |
| NVIDIA GeForce RTX 5080 Founders Edition | |
| XFX Radeon RX 7900 XTX Merc 310 Black Edition | |
| NVIDIA GeForce RTX 4080 Founders Edition | |
| Avatar Frontiers of Pandora | |
| 3840x2160 Ultra Preset AA:T | |
| NVIDIA GeForce RTX 5090 Founders Edition | |
| NVIDIA GeForce RTX 4090 | |
| NVIDIA GeForce RTX 5080 Founders Edition | |
| XFX Radeon RX 7900 XTX Merc 310 Black Edition | |
| NVIDIA GeForce RTX 4080 Founders Edition | |
| 2560x1440 Ultra Preset AA:T | |
| NVIDIA GeForce RTX 5090 Founders Edition | |
| NVIDIA GeForce RTX 4090 | |
| NVIDIA GeForce RTX 5080 Founders Edition | |
| XFX Radeon RX 7900 XTX Merc 310 Black Edition | |
| NVIDIA GeForce RTX 4080 Founders Edition | |
| 1920x1080 Ultra Preset AA:T | |
| NVIDIA GeForce RTX 5090 Founders Edition | |
| NVIDIA GeForce RTX 4090 | |
| NVIDIA GeForce RTX 5080 Founders Edition | |
| XFX Radeon RX 7900 XTX Merc 310 Black Edition | |
| NVIDIA GeForce RTX 4080 Founders Edition | |
| Cyberpunk 2077 2.2 Phantom Liberty | |
| 3840x2160 Ultra Preset (FSR off) | |
| NVIDIA GeForce RTX 5090 Founders Edition | |
| NVIDIA GeForce RTX 4090 | |
| NVIDIA GeForce RTX 5080 Founders Edition | |
| XFX Radeon RX 7900 XTX Merc 310 Black Edition | |
| NVIDIA GeForce RTX 4080 Founders Edition | |
| 2560x1440 Ultra Preset (FSR off) | |
| NVIDIA GeForce RTX 5090 Founders Edition | |
| NVIDIA GeForce RTX 5080 Founders Edition | |
| NVIDIA GeForce RTX 4090 | |
| XFX Radeon RX 7900 XTX Merc 310 Black Edition | |
| NVIDIA GeForce RTX 4080 Founders Edition | |
| 1920x1080 Ultra Preset (FSR off) | |
| XFX Radeon RX 7900 XTX Merc 310 Black Edition | |
| NVIDIA GeForce RTX 5090 Founders Edition | |
| NVIDIA GeForce RTX 4090 | |
| NVIDIA GeForce RTX 5080 Founders Edition | |
| NVIDIA GeForce RTX 4080 Founders Edition | |
| X-Plane 11.11 | |
| 3840x2160 high (fps_test=3) | |
| NVIDIA GeForce RTX 5090 Founders Edition | |
| NVIDIA GeForce RTX 4090 | |
| NVIDIA GeForce RTX 5080 Founders Edition | |
| NVIDIA GeForce RTX 4080 Founders Edition | |
| XFX Radeon RX 7900 XTX Merc 310 Black Edition | |
| 1920x1080 high (fps_test=3) | |
| NVIDIA GeForce RTX 5090 Founders Edition | |
| NVIDIA GeForce RTX 5080 Founders Edition | |
| NVIDIA GeForce RTX 4090 | |
| NVIDIA GeForce RTX 4080 Founders Edition | |
| XFX Radeon RX 7900 XTX Merc 310 Black Edition | |
Трассировка лучей
Благодаря помощи DLSS Super Resolution и Frame Generation, RTX 5080 FE показывает достойные результаты и в трассировке лучей. RTX 5080 FE может похвастаться 33%-ным приростом производительности в трассировке лучей по сравнению с RTX 4080 FE, но отстает от RTX 5090 FE на столько же.
RX 7900 XTX просто не может сравниться с RTX 5080 FE по возможностям трассировки лучей: последняя демонстрирует превосходство до 71% в предварительной настройке Alan Wake 2 4K High Ray Tracing.
Тем не менее, RTX 5080 FE не может справиться с этим бременем самостоятельно, без помощи апскейлеров. Поскольку современные игры все чаще выбирают путь трассировки, Вам неизбежно придется включить функцию Frame Generation, чтобы получить приемлемую частоту кадров.
| Indiana Jones and the Great Circle - 2560x1440 Very Ultra Preset + Full Path Tracing + Quality DLSS + Frame Generation | |
| NVIDIA GeForce RTX 5090 Founders Edition | |
| NVIDIA GeForce RTX 4090 | |
| NVIDIA GeForce RTX 5080 Founders Edition | |
| NVIDIA GeForce RTX 4080 Founders Edition | |
| Black Myth: Wukong | |
| 3840x2160 cinematic RT: Very High DLSS 68 FG | |
| NVIDIA GeForce RTX 4090 | |
| NVIDIA GeForce RTX 5090 Founders Edition | |
| NVIDIA GeForce RTX 5080 Founders Edition | |
| NVIDIA GeForce RTX 4080 Founders Edition | |
| 2560x1440 cinematic RT: Very High DLSS 68 FG | |
| NVIDIA GeForce RTX 5090 Founders Edition | |
| NVIDIA GeForce RTX 4090 | |
| NVIDIA GeForce RTX 5080 Founders Edition | |
| NVIDIA GeForce RTX 4080 Founders Edition | |
| Alan Wake 2 | |
| 3840x2160 High Preset + High Ray Tracing | |
| NVIDIA GeForce RTX 5090 Founders Edition | |
| NVIDIA GeForce RTX 4090 | |
| NVIDIA GeForce RTX 5080 Founders Edition | |
| NVIDIA GeForce RTX 4080 Founders Edition | |
| XFX Radeon RX 7900 XTX Merc 310 Black Edition | |
| 1920x1080 High Preset + High Ray Tracing | |
| NVIDIA GeForce RTX 5090 Founders Edition | |
| NVIDIA GeForce RTX 4090 | |
| NVIDIA GeForce RTX 5080 Founders Edition | |
| NVIDIA GeForce RTX 4080 Founders Edition | |
| XFX Radeon RX 7900 XTX Merc 310 Black Edition | |
| 3840x2160 High Preset + High Ray Tracing + Quality DLSS + FG | |
| NVIDIA GeForce RTX 5090 Founders Edition | |
| NVIDIA GeForce RTX 4090 | |
| NVIDIA GeForce RTX 5080 Founders Edition | |
| NVIDIA GeForce RTX 4080 Founders Edition | |
| Cyberpunk 2077 2.2 Phantom Liberty | |
| 3840x2160 Ray Tracing Ultra Preset (DLSS off, no Path Tracing) | |
| NVIDIA GeForce RTX 5090 Founders Edition | |
| NVIDIA GeForce RTX 4090 | |
| NVIDIA GeForce RTX 5080 Founders Edition | |
| NVIDIA GeForce RTX 4080 Founders Edition | |
| XFX Radeon RX 7900 XTX Merc 310 Black Edition | |
| 1920x1080 Ray Tracing Ultra Preset (DLSS off) | |
| NVIDIA GeForce RTX 5090 Founders Edition | |
| NVIDIA GeForce RTX 4090 | |
| NVIDIA GeForce RTX 5080 Founders Edition | |
| NVIDIA GeForce RTX 4080 Founders Edition | |
| XFX Radeon RX 7900 XTX Merc 310 Black Edition | |
| мин. | сред. | выс. | макс. | QHD DLSS | QHD | 4K DLSS | 4K | |
|---|---|---|---|---|---|---|---|---|
| The Witcher 3 (2015) | 279 | 223 | 232 | |||||
| X-Plane 11.11 (2018) | 157.3 | 127.7 | ||||||
| Metro Exodus (2019) | 195.5 | 172.8 | ||||||
| Control (2019) | ||||||||
| F1 22 (2022) | 189.5 | 135.4 | 69.9 | |||||
| Baldur's Gate 3 (2023) | 239 | 188.1 | 164.4 | 107.6 | ||||
| Cyberpunk 2077 2.2 Phantom Liberty (2023) | 174.9 | 150 | 104 | 71.4 | ||||
| Assassin's Creed Mirage (2023) | 195 | 160 | 140 | 109 | ||||
| Alan Wake 2 (2023) | 144.1 | 101.9 | 91.7 | 55.7 | ||||
| Avatar Frontiers of Pandora (2023) | 134.4 | 96.4 | 88.1 | 52.1 | ||||
| F1 24 (2024) | 199.7 | 139.5 | 120 | 72.8 | ||||
| Black Myth: Wukong (2024) | 78 | 85 | 60 | 63 | 38 | |||
| Star Wars Outlaws (2024) | 97.2 | 97 | 74.8 | 66.4 | 46.6 | |||
| Stalker 2 (2024) | 103.1 | 164.3 | 82.9 | 110.5 | 53.6 | |||
| Indiana Jones and the Great Circle (2024) | 161.2 | 132.3 | 89.9 |
Декларация о непредвзятости
Отбор устройств для обзора осуществляется нашей редакцией. Тестовый образец был предоставлен автору производителем или продавцом для целей настоящего обзора. Кредитор не имел никакого влияния на этот обзор, и производитель не получил копию этого обзора до публикации. Обязанности публиковать этот обзор не было. Мы никогда не принимаем компенсацию или оплату в обмен на наши отзывы. Являясь независимой медиа-компанией, Notebookcheck не подчиняется власти производителей, розничных продавцов или издателей.
Вот как проводит тестирование Notebookcheck
Каждый год Notebookcheck независимо проверяет сотни ноутбуков и смартфонов, используя стандартизированные процедуры, чтобы гарантировать сопоставимость всех результатов. В течение примерно 20 лет мы постоянно совершенствовали наши методы испытаний и при этом установили отраслевые стандарты. В наших испытательных лабораториях опытные специалисты и редакторы используют высококачественное измерительное оборудование. Эти тесты включают в себя многоэтапный процесс проверки. Наша сложная рейтинговая система основана на сотнях обоснованных измерений и критериев, что обеспечивает объективность.

