Notebookcheck Logo
Teaser

Обзор мини-ПК MSI Cubi NUC 1M: Солидный, но дороже конкурентов

Не лучший баланс быстродействия и цены.

Ничего плохого за Cubi NUC 1M мы не заметили, однако и выдающимся его не назовешь. Высокая цена модели - более 900 долларов США за конфигурацию Core 7 - бросается в глаза на фоне более дешевых и быстрых альтернатив.
Allen Ngo, 👁 Allen Ngo (перевод DeepL) Опубликовано 🇺🇸 🇫🇷 ...
MSI неттопы и платформы Raptor Lake

Вердикт - Надежный, но дорогой

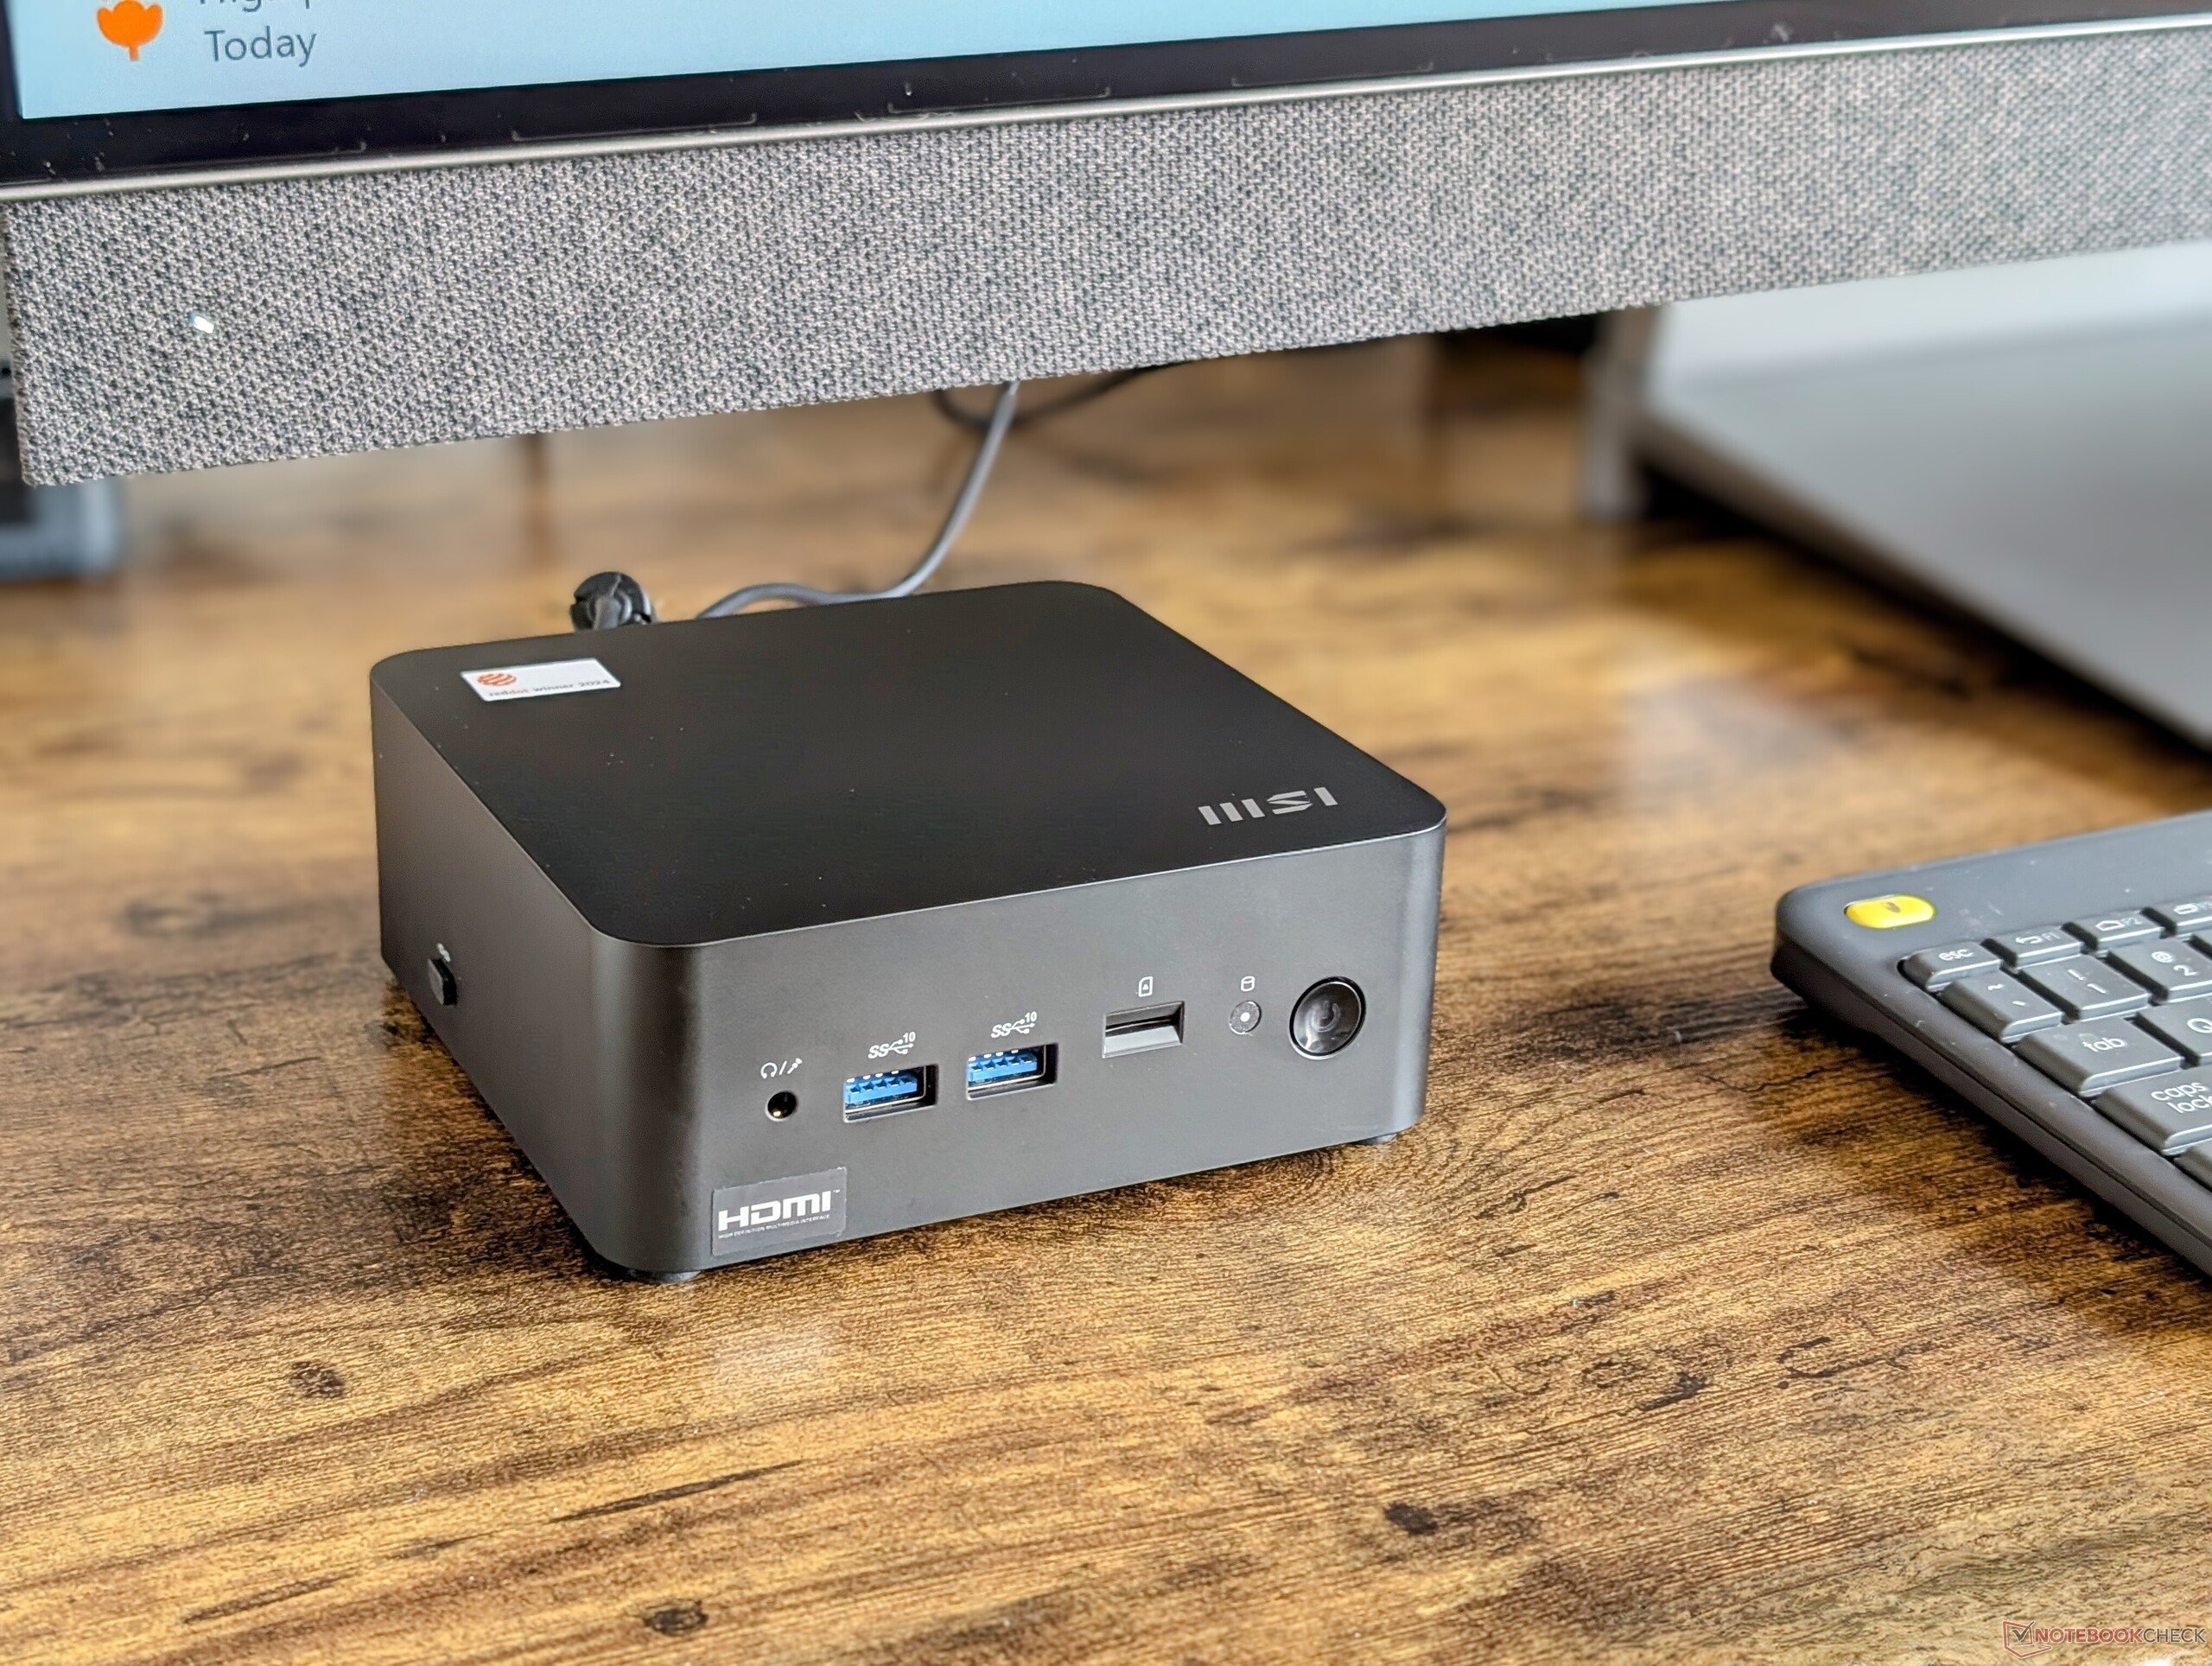
В обзоре: MSI Cubi NUC 1M. Тестовое устройство предоставлено компанией MSI

Cubi NUC 1M - это хорошо сконструированный мини-ПК для офиса или конференц-зала. Он оснащен двумя портами Thunderbolt 4 и устройством чтения MicroSD, в то время как большинство других мини-ПК имеют только один порт Thunderbolt и вообще не имеют устройства чтения SD. Если Ваши рабочие нагрузки могут ежедневно использовать эти специфические функции, то мини-ПК от MSI может стать достойным выбором.

Cubi NUC 1M - это базовый офисный мини-ПК с не самой низкой ценой. Можно найти более дешевые и быстрые альтернативы, если Вы не против лишиться встроенного устройства чтения MicroSD.

Неплохо (66%) MSI Cubi NUC 1M Intel Core 7 150UIntel Iris Xe Graphics G7 96EUs Mini PC - 30 October 2024 - v8
Тестовый образец выдан нам компанией MSI
Сохранить защищённую авторским правом картинку с итоговым рейтингом в формате PNG / SVG

За

+ легкий доступ; поддержка 2x SODIMM + 2x M.2 SSD
+ несколько портов Thunderbolt 4
+ встроенный считыватель MicroSD
+ тихий

Против

- нет встроенного считывателя отпечатков пальцев
- нет опций Core Ultra H
- магнит для отпечатков пальцев
- дорогой

Основной проблемой Cubi NUC 1M является его высокая цена - 800 долларов США за конфигурацию Core i5 120U или почти 1000 долларов США за рассмотренную нами конфигурацию Core i7. Альтернативы от Beelink или GMK стоят на несколько сотен долларов меньше, предлагая при этом более быстрые варианты процессоров и схожие размеры корпуса. Таким образом, стоимость по сравнению с конкурентами ниже, чем ожидалось.

Соперники

Image
Модель
Geizhals
Вес
Height
Display
1.
66.1%
MSI Cubi NUC 1M
MSI Cubi NUC 1M
Intel Core 7 150U ⎘
Intel Iris Xe Graphics G7 96EUs ⎘
16 Гбайт ОЗУ, 1024 Гбайт SSD
Bestpreis 699€ computeruniverse.net
2. 699€ Cyberport Stores Österreich
3. 699€ Cyberport.at
660 г50.1 ммx
2.
67.3%
GMK NucBox K9
GMK NucBox K9
Intel Core Ultra 5 125H ⎘
Intel Arc 7-Core iGPU ⎘
32 Гбайт ОЗУ, 1024 Гбайт SSD
Listenpreis 560 USD
Geizhals Suche
528 г47 ммx
3.
74.7%
Asus NUC 14 Pro
Asus NUC 14 Pro
Intel Core Ultra 5 125H ⎘
Intel Arc 7-Core iGPU ⎘
, 2048 Гбайт SSD
Bestpreis 474.9€ alza.de
2. 485.9€ alza.at
3. 497.63€ CSV-Direct.de
525 г37 ммx
4.
Beelink SEi11 Pro
Beelink SEi11 Pro
Intel Core i5-11320H ⎘
Intel Iris Xe Graphics G7 96EUs ⎘
16 Гбайт ОЗУ, 500 Гбайт SSD
Listenpreis 430 USD440 г40 ммx
5.
74.9%
Beelink SER8
Beelink SER8
AMD Ryzen 7 8845HS ⎘
AMD Radeon 780M ⎘
32 Гбайт ОЗУ, 1024 Гбайт SSD
Listenpreis 650 USD776 г44.7 ммx
6.
84.5% v7 (old)
BOSGAME M1
BOSGAME M1
AMD Ryzen 7 7840HS ⎘
AMD Radeon 780M ⎘
32 Гбайт ОЗУ
Listenpreis 690 USD766 г51 ммx

Серия MSI Cubi заполняет пробел, оставленный Intel после того, как они решили прекратить производство собственной серии NUC. Она ориентирована на основных бизнес-пользователей и офисы, где низкопрофильные ПК предпочтительнее высокопроизводительных альтернатив.

Наше тестовое устройство представляет собой конфигурацию высшего класса с процессором Raptor Lake-U Refresh Core 7 150U, в то время как менее производительные варианты доступны с Core 5 120U или Core 3 100U.

Альтернативой Cubi NUC 1M являются другие низкопрофильные мини-ПК на базе серии U, такие как GMK NucBox M5 или Beelink Mini S12 Pro.

Другие обзоры MSI:

Характеристики

MSI Cubi NUC 1M
Процессор
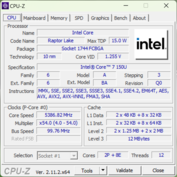
Intel Core 7 150U 10 x 1.2 - 5.4 GHz, 32 W PL2 / Short Burst, 20 W PL1 / Sustained, Raptor Lake-U Refresh
Графический адаптер
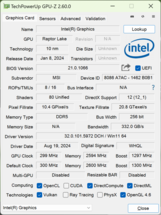
Intel Iris Xe Graphics G7 96EUs, Видеопр-р: 1300 МГц, Память: 2600 МГц, DDR5, 32.0.101.5972
ОЗУ
16 Гбайт 
, Samsung, DDR5-5600, Dual-Channel, 42-42-42-82
Материнская плата
Intel Raptor Lake-P PCH
Хранение данных
WD PC SN560 SDDPNQE-1T00, 1024 Гбайт 
Звуковая плата
Intel Raptor Lake-P/U/H PCH - cAVS
Интерфейсы
6 USB 3.1 Gen 2, 2 Thunderbolt, USB-C Power Delivery (PD), 2 HDMI, 2 DisplayPort, 1 слот замка Kensington, Аудиоразъёмы: 3.5 mm combo, картридер: MicroSD
Коммуникации
Intel Ethernet Controller I226-V (10/2500MBit/s), Intel Wi-Fi 6E AX211 (a/b/g/h/n = Wi-Fi 4/ac = Wi-Fi 5/ax = Wi-Fi 6/ Wi-Fi 6E 6 GHz), Bluetooth 5.3
Габариты
толщина х ширина х глубина (мм): 50.1 x 135.6 x 132.6
Операционная система
Microsoft Windows 11 Pro
Дополнительно
2.5-inch SATA III adapter, MSI Center, 12 мес. гарантии в Европе
Вес
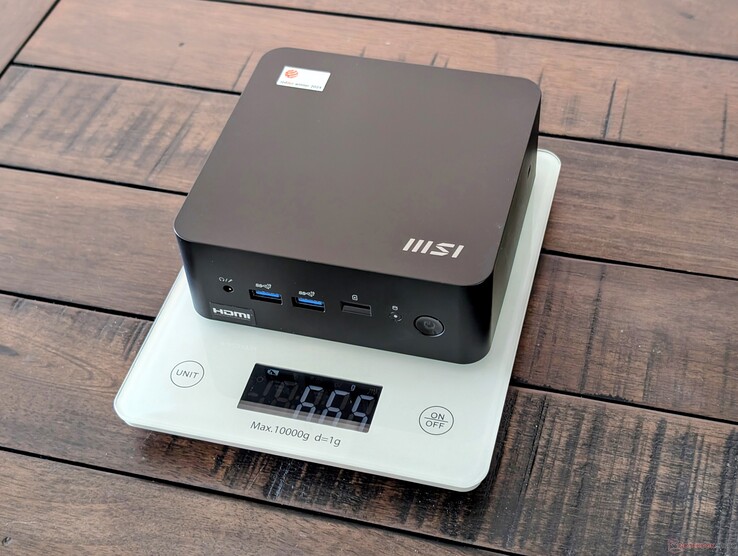
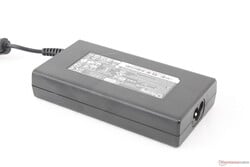
660 г, адаптер питания: 536 г
Стоимость
950 USD
Amazon
Внимание: Разные образцы одной и той же модели часто используют неодинаковые компоненты! (Матрица AUO вместо BOE, память Hynix вместо Samsung, накопитель SATA вместо PCIe, ...)


Дизайн и особенности

Шасси в основном пластиковое с металлическим усилением вокруг внутренней обшивки боковых сторон. Хотя это и увеличивает вес устройства, но создает ощущение более высокого качества, особенно когда многие альтернативы от Beelink или GMK используют гораздо меньше металлических материалов, чтобы сэкономить на стоимости.

Гладкая матовая черная поверхность, к сожалению, является большим магнитом для отпечатков пальцев. Вариант белого или серебристого цвета, подобный серии MSI Prestige, ориентированной на бизнесменов, смягчил бы эту проблему.

Сравнение размеров

136 mm 132 mm 51 mm 766 g135.6 mm 132.6 mm 50.1 mm 660 g135 mm 135 mm 44.7 mm 776 g128 mm 126 mm 47 mm 528 g126 mm 113 mm 40 mm 440 g117 mm 112 mm 37 mm 525 g210 mm 148 mm 1 mm 2.9 g

Оснащение

В отличие от большинства других мини-ПК, система оснащена достаточно быстрым встроенным кардридером MicroSD, что должно понравиться некоторым пользователям камер и создателям контента. Мы также ценим наличие двух портов USB-C, в отличие от большинства мини-ПК Beelink.

Стоит отметить, что система может питаться от сетевых адаптеров USB-C сторонних производителей, если Вы вдруг потеряете бочкообразный сетевой адаптер, входящий в комплект поставки.

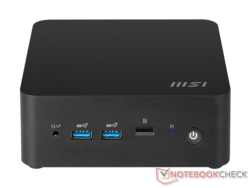
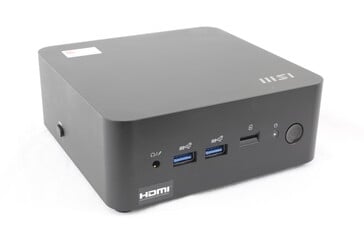
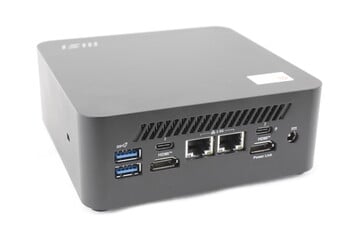
Спереди: комбинированный аудиоразъем 3,5 мм, 2x USB-A 3.2 Gen. 2 (10 Гбит/с), устройство чтения MicroSD, кнопка питания, слева: замок Кенсингтона
Сзади: 2x USB-A 3.2 Gen. 2 (10 Гбит/с), 2x USB-C w/ Thunderbolt 4 + Power Delivery + DisplayPort, 2x HDMI 2.1, 2x RJ-45 (2,5 Гбит/с), бочкообразный адаптер переменного тока

Устройство для чтения SD-карт

SD Card Reader
average JPG Copy Test (av. of 3 runs)
MSI Cubi NUC 1M
Intel Core 7 150U (Angelbird AV Pro V60)
53 MB/s
maximum AS SSD Seq Read Test (1GB)
MSI Cubi NUC 1M
Intel Core 7 150U (Angelbird AV Pro V60)
196.9 MB/s

Сеть

Поддержка Wi-Fi 6E и Bluetooth 5.3 входит в стандартную комплектацию. Wi-Fi 7 было бы здорово увидеть, особенно в этой ценовой категории.

Networking
iperf3 transmit AXE11000
BOSGAME M1
MediaTek Wi-Fi 6E MT7922 160MHz Wireless LAN Card
1470 (1310min - 1625max) MBit/s +131%
Asus NUC 14 Pro
Intel Wi-Fi 6E AX211
1331 (1187min - 1442max) MBit/s +109%
GMK NucBox K9
Intel Wi-Fi 6 AX201
823 (607min - 901max) MBit/s +29%
Beelink SER8
Intel Wi-Fi 6 AX200
812 (641min - 888max) MBit/s +28%
MSI Cubi NUC 1M
Intel Wi-Fi 6E AX211
636 (430min - 784max) MBit/s
iperf3 receive AXE11000
BOSGAME M1
MediaTek Wi-Fi 6E MT7922 160MHz Wireless LAN Card
1479 (1255min - 1539max) MBit/s +114%
Asus NUC 14 Pro
Intel Wi-Fi 6E AX211
1379 (1016min - 1613max) MBit/s +99%
Beelink SER8
Intel Wi-Fi 6 AX200
784 (679min - 845max) MBit/s +13%
GMK NucBox K9
Intel Wi-Fi 6 AX201
764 (635min - 829max) MBit/s +10%
MSI Cubi NUC 1M
Intel Wi-Fi 6E AX211
692 (506min - 872max) MBit/s
iperf3 transmit AXE11000 6GHz
MSI Cubi NUC 1M
Intel Wi-Fi 6E AX211
1400 (1199min - 1463max) MBit/s
Asus NUC 14 Pro
Intel Wi-Fi 6E AX211
1379 (1299min - 1425max) MBit/s -1%
BOSGAME M1
MediaTek Wi-Fi 6E MT7922 160MHz Wireless LAN Card
1324 (1090min - 1580max) MBit/s -5%
Beelink SEi11 Pro
MediaTek RZ608
722 (447min - 789max) MBit/s -48%
iperf3 receive AXE11000 6GHz
Asus NUC 14 Pro
Intel Wi-Fi 6E AX211
1729 (1594min - 1755max) MBit/s +11%
MSI Cubi NUC 1M
Intel Wi-Fi 6E AX211
1560 (1528min - 1585max) MBit/s
BOSGAME M1
MediaTek Wi-Fi 6E MT7922 160MHz Wireless LAN Card
1321 (1233min - 1393max) MBit/s -15%
Beelink SEi11 Pro
MediaTek RZ608
743 (453min - 793max) MBit/s -52%
050100150200250300350400450500550600650700750800850900950100010501100115012001250130013501400145015001550Tooltip
MSI Cubi NUC 1M; iperf3 transmit AXE11000 6GHz; iperf 3.1.3: Ø1400 (1199-1463)
MSI Cubi NUC 1M; iperf3 receive AXE11000 6GHz; iperf 3.1.3: Ø1559 (1528-1585)

Обслуживание

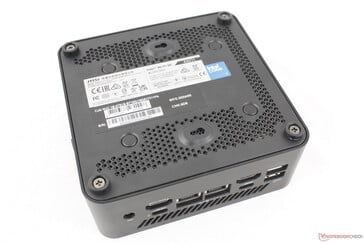
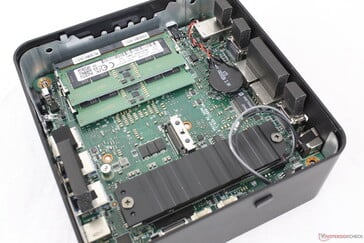
Нижнюю металлическую пластину можно легко снять с помощью крестовой отвертки, чтобы открыть доступ к компонентам, которые можно модернизировать. Обратите внимание, что винты не являются винтами с накатанной головкой, в отличие от многих моделей Intel NUC.
Нижняя сторона показывает совместимость с VESA
Легкий доступ к двум слотам SODIMM, двум слотам для M.2 SSD (2280 + 2242) и съемному модулю M.2 WLAN, расположенному под основным SSD

Экологичность

В процессе производства MSI использует 42,9% переработанного пластика, а также древесную целлюлозу, полученную из экологически чистых источников, для изготовления упаковки. Тем не менее, пластиковая упаковка по-прежнему используется для сетевого адаптера и аксессуаров.

Аксессуары и гарантия

В комплект входит съемный кабель SATA III для пользователей, которые хотят подключить внешний 2,5-дюймовый накопитель SATA III к специальному порту на правой стороне устройства. Это не очень элегантное решение, но, по крайней мере, такая возможность есть, в то время как большинство других мини-ПК сейчас вообще отказываются от поддержки 2,5-дюймового SATA.

На устройство распространяется стандартная ограниченная гарантия производителя сроком на один год с возможностью продления до трех лет.

Производительность


Условия тестирования

Мы установили Windows и MSI Center в режим "Производительность" перед тем, как запустить приведенные ниже бенчмарки.

Процессор

В то время как Core 7 150U относительно новый, он основан на более старой платформе Raptor Lake-U, и поэтому его производительность очень похожа на производительность выходящей модели Core i7-1365U. В нем отсутствуют встроенные функции искусственного интеллекта и улучшенная интегрированная графика Arc, характерные для платформы Meteor Lake.

Опустившись до Core 5 120U не окажет существенного влияния на производительность процессора, поскольку эти два процессора имеют одинаковое количество ядер и потоков. Если Вы пытаетесь сэкономить, то по этой причине стоит рассмотреть вариант Core 5 SKU.

Многопоточный тест Cinebench R15

0135270405540675810945108012151350148516201755189020252160229524302565Tooltip
MSI Cubi NUC 1M Intel Core 7 150U: Ø971 (535.59-1039.66)
GMK NucBox K9 Intel Core Ultra 5 125H: Ø1902 (1827.4-1965.8)
Asus NUC 14 Pro Intel Core Ultra 5 125H: Ø2021 (1900.15-2203.13)
Beelink SEi11 Pro Intel Core i5-11320H: Ø851 (845.25-856.84)
Beelink SER8 AMD Ryzen 7 8845HS: Ø2607 (2586.82-2626.57)
BOSGAME M1 AMD Ryzen 7 7840HS: Ø2554 (2501.09-2597.23)
CPU Performance Rating: Percent
Cinebench R23: Multi Core | Single Core
Cinebench R20: CPU (Multi Core) | CPU (Single Core)
Cinebench R15: CPU Multi 64Bit | CPU Single 64Bit
Blender: v2.79 BMW27 CPU
7-Zip 18.03: 7z b 4 | 7z b 4 -mmt1
Geekbench 6.3: Multi-Core | Single-Core
Geekbench 5.5: Multi-Core | Single-Core
HWBOT x265 Benchmark v2.2: 4k Preset
LibreOffice : 20 Documents To PDF
R Benchmark 2.5: Overall mean
CPU Performance Rating
Lenovo ThinkStation P3 Tiny-30H0006AGE
Intel Core i9-14900
90.6 pt
Beelink SER8
AMD Ryzen 7 8845HS
68.8 pt
GMK NucBox K6
AMD Ryzen 7 7840HS
67.9 pt
Geekom AX8 Pro
AMD Ryzen 9 8945H
67 pt
HP Elite Mini 800 G9-5M9X6EA
Intel Core i5-14500
63.4 pt
Geekom XT13 Pro
Intel Core i9-13900H
58.9 pt
GMK NucBox K9 -1!
Intel Core Ultra 5 125H
57.2 pt
Khadas Mind 2
Intel Core Ultra 7 155H
55.2 pt
Asus NUC 14 Pro
Intel Core Ultra 5 125H
54.2 pt
Beelink SER6 Pro Ryzen 7 7735HS -2!
AMD Ryzen 7 7735HS
53 pt
Усредн. модель с Intel Core 7 150U
 
52.7 pt
Lenovo IdeaPad Slim 3i 15IRU9
Intel Core 5 120U
52 pt
Beelink SER6 Pro -2!
AMD Ryzen 7 6800H
51.9 pt
MSI Cubi NUC 1M
Intel Core 7 150U
51.1 pt
GMK NucBox M6
AMD Ryzen 5 6600H
50.7 pt
GMK NucBox M5
AMD Ryzen 7 5700U
36.1 pt
Beelink SEi11 Pro -2!
Intel Core i5-11320H
35.4 pt
Cinebench R23 / Multi Core
Lenovo ThinkStation P3 Tiny-30H0006AGE
Intel Core i9-14900
31070 Points +330%
Beelink SER8
AMD Ryzen 7 8845HS
16661 (16363.9min - 16661max) Points +131%
GMK NucBox K6
AMD Ryzen 7 7840HS
15947 (9378.75min - 15947.3max) Points +121%
Geekom AX8 Pro
AMD Ryzen 9 8945H
15516 Points +115%
HP Elite Mini 800 G9-5M9X6EA
Intel Core i5-14500
15012 Points +108%
Asus NUC 14 Pro
Intel Core Ultra 5 125H
14516 Points +101%
Khadas Mind 2
Intel Core Ultra 7 155H
14099 Points +95%
GMK NucBox K9
Intel Core Ultra 5 125H
12989 (12625.3min - 12989.4max) Points +80%
Geekom XT13 Pro
Intel Core i9-13900H
11997 Points +66%
Beelink SER6 Pro Ryzen 7 7735HS
AMD Ryzen 7 7735HS
11626 (11015.5min - 11625.6max) Points +61%
Beelink SER6 Pro
AMD Ryzen 7 6800H
11481 (10813.7min - 11481.3max) Points +59%
GMK NucBox M6
AMD Ryzen 5 6600H
10418 (10142.8min - 10418max) Points +44%
Усредн. модель с Intel Core 7 150U
  (7226 - 9895, n=4)
8722 Points +21%
Lenovo IdeaPad Slim 3i 15IRU9
Intel Core 5 120U
7862 (6916.06min - 7861.59max) Points +9%
MSI Cubi NUC 1M
Intel Core 7 150U
7226 (6983.97min - 7226.42max) Points
GMK NucBox M5
AMD Ryzen 7 5700U
6649 (6519.7min - 6648.75max) Points -8%
Beelink SEi11 Pro
Intel Core i5-11320H
5720 (5681.08min - 5720.38max) Points -21%
Cinebench R23 / Single Core
Lenovo ThinkStation P3 Tiny-30H0006AGE
Intel Core i9-14900
2212 Points +18%
HP Elite Mini 800 G9-5M9X6EA
Intel Core i5-14500
1917 Points +2%
MSI Cubi NUC 1M
Intel Core 7 150U
1878 Points
Усредн. модель с Intel Core 7 150U
  (1698 - 2032, n=4)
1870 Points 0%
Lenovo IdeaPad Slim 3i 15IRU9
Intel Core 5 120U
1844 Points -2%
Geekom AX8 Pro
AMD Ryzen 9 8945H
1808 Points -4%
Beelink SER8
AMD Ryzen 7 8845HS
1783 Points -5%
GMK NucBox K6
AMD Ryzen 7 7840HS
1770 Points -6%
GMK NucBox K9
Intel Core Ultra 5 125H
1735 Points -8%
Asus NUC 14 Pro
Intel Core Ultra 5 125H
1721 Points -8%
Geekom XT13 Pro
Intel Core i9-13900H
1719 Points -8%
Khadas Mind 2
Intel Core Ultra 7 155H
1643 Points -13%
Beelink SER6 Pro Ryzen 7 7735HS
AMD Ryzen 7 7735HS
1537 Points -18%
Beelink SER6 Pro
AMD Ryzen 7 6800H
1506 Points -20%
GMK NucBox M6
AMD Ryzen 5 6600H
1486 Points -21%
Beelink SEi11 Pro
Intel Core i5-11320H
1467 Points -22%
GMK NucBox M5
AMD Ryzen 7 5700U
1267 Points -33%
Cinebench R20 / CPU (Multi Core)
Lenovo ThinkStation P3 Tiny-30H0006AGE
Intel Core i9-14900
11291 Points +300%
Beelink SER8
AMD Ryzen 7 8845HS
6431 Points +128%
GMK NucBox K6
AMD Ryzen 7 7840HS
6250 Points +122%
Geekom AX8 Pro
AMD Ryzen 9 8945H
6153 Points +118%
HP Elite Mini 800 G9-5M9X6EA
Intel Core i5-14500
5811 Points +106%
Asus NUC 14 Pro
Intel Core Ultra 5 125H
5617 Points +99%
Khadas Mind 2
Intel Core Ultra 7 155H
5448 Points +93%
GMK NucBox K9
Intel Core Ultra 5 125H
4948 Points +75%
Geekom XT13 Pro
Intel Core i9-13900H
4935 Points +75%
Beelink SER6 Pro Ryzen 7 7735HS
AMD Ryzen 7 7735HS
4524 Points +60%
Beelink SER6 Pro
AMD Ryzen 7 6800H
4460 Points +58%
GMK NucBox M6
AMD Ryzen 5 6600H
4106 Points +46%
Усредн. модель с Intel Core 7 150U
  (2821 - 3790, n=4)
3378 Points +20%
Lenovo IdeaPad Slim 3i 15IRU9
Intel Core 5 120U
3046 Points +8%
MSI Cubi NUC 1M
Intel Core 7 150U
2821 Points
GMK NucBox M5
AMD Ryzen 7 5700U
2580 Points -9%
Beelink SEi11 Pro
Intel Core i5-11320H
2208 Points -22%
Cinebench R20 / CPU (Single Core)
Lenovo ThinkStation P3 Tiny-30H0006AGE
Intel Core i9-14900
846 Points +18%
HP Elite Mini 800 G9-5M9X6EA
Intel Core i5-14500
736 Points +3%
MSI Cubi NUC 1M
Intel Core 7 150U
718 Points
Lenovo IdeaPad Slim 3i 15IRU9
Intel Core 5 120U
714 Points -1%
Усредн. модель с Intel Core 7 150U
  (652 - 782, n=4)
713 Points -1%
Geekom AX8 Pro
AMD Ryzen 9 8945H
703 Points -2%
Beelink SER8
AMD Ryzen 7 8845HS
698 Points -3%
GMK NucBox K6
AMD Ryzen 7 7840HS
688 Points -4%
GMK NucBox K9
Intel Core Ultra 5 125H
664 Points -8%
Geekom XT13 Pro
Intel Core i9-13900H
649 Points -10%
Asus NUC 14 Pro
Intel Core Ultra 5 125H
622 Points -13%
Khadas Mind 2
Intel Core Ultra 7 155H
609 Points -15%
Beelink SER6 Pro Ryzen 7 7735HS
AMD Ryzen 7 7735HS
598 Points -17%
Beelink SER6 Pro
AMD Ryzen 7 6800H
584 Points -19%
GMK NucBox M6
AMD Ryzen 5 6600H
584 Points -19%
Beelink SEi11 Pro
Intel Core i5-11320H
561 Points -22%
GMK NucBox M5
AMD Ryzen 7 5700U
495 Points -31%
Cinebench R15 / CPU Multi 64Bit
Lenovo ThinkStation P3 Tiny-30H0006AGE
Intel Core i9-14900
4793 Points +361%
Beelink SER8
AMD Ryzen 7 8845HS
2627 (2586.82min - 2626.57max) Points +153%
GMK NucBox K6
AMD Ryzen 7 7840HS
2537 (2510.2min - 2537.27max) Points +144%
Geekom AX8 Pro
AMD Ryzen 9 8945H
2521 Points +142%
Geekom XT13 Pro
Intel Core i9-13900H
2448 Points +135%
HP Elite Mini 800 G9-5M9X6EA
Intel Core i5-14500
2435 Points +134%
Khadas Mind 2
Intel Core Ultra 7 155H
2280 Points +119%
Asus NUC 14 Pro
Intel Core Ultra 5 125H
2141 Points +106%
GMK NucBox K9
Intel Core Ultra 5 125H
1966 (1827.4min - 1965.8max) Points +89%
Beelink SER6 Pro Ryzen 7 7735HS
AMD Ryzen 7 7735HS
1953 (1862.98min - 1952.55max) Points +88%
Beelink SER6 Pro
AMD Ryzen 7 6800H
1931 (1821.83min - 1930.5max) Points +86%
GMK NucBox M6
AMD Ryzen 5 6600H
1737 (1708.16min - 1737.02max) Points +67%
Lenovo IdeaPad Slim 3i 15IRU9
Intel Core 5 120U
1432 (1020.02min - 1432.1max) Points +38%
Усредн. модель с Intel Core 7 150U
  (1040 - 1609, n=4)
1415 Points +36%
GMK NucBox M5
AMD Ryzen 7 5700U
1130 (1041.59min - 1129.53max) Points +9%
MSI Cubi NUC 1M
Intel Core 7 150U
1040 (535.59min - 1039.66max) Points
Beelink SEi11 Pro
Intel Core i5-11320H
857 (845.25min - 856.84max) Points -18%
Cinebench R15 / CPU Single 64Bit
Lenovo ThinkStation P3 Tiny-30H0006AGE
Intel Core i9-14900
315 Points +22%
Geekom AX8 Pro
AMD Ryzen 9 8945H
284 Points +10%
Beelink SER8
AMD Ryzen 7 8845HS
283 Points +10%
GMK NucBox K6
AMD Ryzen 7 7840HS
280 Points +9%
HP Elite Mini 800 G9-5M9X6EA
Intel Core i5-14500
273 Points +6%
Усредн. модель с Intel Core 7 150U
  (243 - 290, n=4)
260 Points +1%
MSI Cubi NUC 1M
Intel Core 7 150U
258 Points
Lenovo IdeaPad Slim 3i 15IRU9
Intel Core 5 120U
257 Points 0%
GMK NucBox K9
Intel Core Ultra 5 125H
251 Points -3%
Asus NUC 14 Pro
Intel Core Ultra 5 125H
248 Points -4%
Beelink SER6 Pro Ryzen 7 7735HS
AMD Ryzen 7 7735HS
247 Points -4%
Geekom XT13 Pro
Intel Core i9-13900H
245 Points -5%
GMK NucBox M6
AMD Ryzen 5 6600H
243 Points -6%
Beelink SER6 Pro
AMD Ryzen 7 6800H
242 Points -6%
Khadas Mind 2
Intel Core Ultra 7 155H
234 Points -9%
Beelink SEi11 Pro
Intel Core i5-11320H
214 Points -17%
GMK NucBox M5
AMD Ryzen 7 5700U
188.1 Points -27%
Blender / v2.79 BMW27 CPU
Beelink SEi11 Pro
Intel Core i5-11320H
541 Seconds * -20%
MSI Cubi NUC 1M
Intel Core 7 150U
451 Seconds *
Lenovo IdeaPad Slim 3i 15IRU9
Intel Core 5 120U
437 Seconds * +3%
GMK NucBox M5
AMD Ryzen 7 5700U
427 Seconds * +5%
Усредн. модель с Intel Core 7 150U
  (344 - 451, n=4)
378 Seconds * +16%
GMK NucBox M6
AMD Ryzen 5 6600H
293 Seconds * +35%
Beelink SER6 Pro
AMD Ryzen 7 6800H
268 Seconds * +41%
Beelink SER6 Pro Ryzen 7 7735HS
AMD Ryzen 7 7735HS
263 Seconds * +42%
Geekom XT13 Pro
Intel Core i9-13900H
261 Seconds * +42%
GMK NucBox K9
Intel Core Ultra 5 125H
248 Seconds * +45%
Khadas Mind 2
Intel Core Ultra 7 155H
248 Seconds * +45%
Asus NUC 14 Pro
Intel Core Ultra 5 125H
228 Seconds * +49%
HP Elite Mini 800 G9-5M9X6EA
Intel Core i5-14500
223 Seconds * +51%
Geekom AX8 Pro
AMD Ryzen 9 8945H
206 Seconds * +54%
GMK NucBox K6
AMD Ryzen 7 7840HS
199 Seconds * +56%
Beelink SER8
AMD Ryzen 7 8845HS
191 Seconds * +58%
Lenovo ThinkStation P3 Tiny-30H0006AGE
Intel Core i9-14900
131 Seconds * +71%
7-Zip 18.03 / 7z b 4
Lenovo ThinkStation P3 Tiny-30H0006AGE
Intel Core i9-14900
101652 MIPS +223%
Beelink SER8
AMD Ryzen 7 8845HS
70937 MIPS +126%
GMK NucBox K6
AMD Ryzen 7 7840HS
70782 MIPS +125%
Geekom AX8 Pro
AMD Ryzen 9 8945H
66557 MIPS +112%
Beelink SER6 Pro Ryzen 7 7735HS
AMD Ryzen 7 7735HS
57693 MIPS +83%
Geekom XT13 Pro
Intel Core i9-13900H
56068 MIPS +78%
Beelink SER6 Pro
AMD Ryzen 7 6800H
55963 MIPS +78%
Khadas Mind 2
Intel Core Ultra 7 155H
55271 MIPS +76%
HP Elite Mini 800 G9-5M9X6EA
Intel Core i5-14500
54851 MIPS +74%
GMK NucBox M6
AMD Ryzen 5 6600H
49353 MIPS +57%
Усредн. модель с Intel Core 7 150U
  (31447 - 39286, n=4)
36682 MIPS +17%
GMK NucBox M5
AMD Ryzen 7 5700U
34172 MIPS +9%
Lenovo IdeaPad Slim 3i 15IRU9
Intel Core 5 120U
33657 MIPS +7%
MSI Cubi NUC 1M
Intel Core 7 150U
31447 MIPS
Beelink SEi11 Pro
Intel Core i5-11320H
24798 MIPS -21%
Asus NUC 14 Pro
Intel Core Ultra 5 125H
0 MIPS -100%
7-Zip 18.03 / 7z b 4 -mmt1
Lenovo ThinkStation P3 Tiny-30H0006AGE
Intel Core i9-14900
7276 MIPS +23%
Beelink SER8
AMD Ryzen 7 8845HS
6714 MIPS +14%
Geekom AX8 Pro
AMD Ryzen 9 8945H
6691 MIPS +13%
GMK NucBox K6
AMD Ryzen 7 7840HS
6676 MIPS +13%
HP Elite Mini 800 G9-5M9X6EA
Intel Core i5-14500
6198 MIPS +5%
MSI Cubi NUC 1M
Intel Core 7 150U
5898 MIPS
Lenovo IdeaPad Slim 3i 15IRU9
Intel Core 5 120U
5882 MIPS 0%
Geekom XT13 Pro
Intel Core i9-13900H
5828 MIPS -1%
Усредн. модель с Intel Core 7 150U
  (5407 - 6261, n=4)
5828 MIPS -1%
Beelink SER6 Pro Ryzen 7 7735HS
AMD Ryzen 7 7735HS
5809 MIPS -2%
Beelink SER6 Pro
AMD Ryzen 7 6800H
5768 MIPS -2%
GMK NucBox M6
AMD Ryzen 5 6600H
5720 MIPS -3%
Asus NUC 14 Pro
Intel Core Ultra 5 125H
5136 MIPS -13%
Beelink SEi11 Pro
Intel Core i5-11320H
5105 MIPS -13%
GMK NucBox K9
Intel Core Ultra 5 125H
5004 MIPS -15%
Khadas Mind 2
Intel Core Ultra 7 155H
4795 MIPS -19%
GMK NucBox M5
AMD Ryzen 7 5700U
4599 MIPS -22%
Geekbench 6.3 / Multi-Core
Lenovo ThinkStation P3 Tiny-30H0006AGE
Intel Core i9-14900
15962 Points +82%
Beelink SER8
AMD Ryzen 7 8845HS
13362 Points +53%
GMK NucBox K6
AMD Ryzen 7 7840HS
13184 Points +51%
Geekom AX8 Pro
AMD Ryzen 9 8945H
13162 Points +50%
Khadas Mind 2
Intel Core Ultra 7 155H
11782 Points +35%
Asus NUC 14 Pro
Intel Core Ultra 5 125H
11749 Points +34%
Geekom XT13 Pro
Intel Core i9-13900H
11541 Points +32%
GMK NucBox K9
Intel Core Ultra 5 125H
11087 Points +27%
HP Elite Mini 800 G9-5M9X6EA
Intel Core i5-14500
10644 Points +22%
Lenovo IdeaPad Slim 3i 15IRU9
Intel Core 5 120U
9733 Points +11%
GMK NucBox M6
AMD Ryzen 5 6600H
9240 Points +6%
Усредн. модель с Intel Core 7 150U
  (7737 - 10160, n=4)
8993 Points +3%
MSI Cubi NUC 1M
Intel Core 7 150U
8756 Points
GMK NucBox M5
AMD Ryzen 7 5700U
6260 Points -29%
Geekbench 6.3 / Single-Core
Lenovo ThinkStation P3 Tiny-30H0006AGE
Intel Core i9-14900
3022 Points +14%
Beelink SER8
AMD Ryzen 7 8845HS
2694 Points +2%
GMK NucBox K6
AMD Ryzen 7 7840HS
2687 Points +2%
Geekom AX8 Pro
AMD Ryzen 9 8945H
2651 Points 0%
MSI Cubi NUC 1M
Intel Core 7 150U
2646 Points
Усредн. модель с Intel Core 7 150U
  (2253 - 2781, n=4)
2586 Points -2%
HP Elite Mini 800 G9-5M9X6EA
Intel Core i5-14500
2583 Points -2%
Lenovo IdeaPad Slim 3i 15IRU9
Intel Core 5 120U
2570 Points -3%
Geekom XT13 Pro
Intel Core i9-13900H
2415 Points -9%
Asus NUC 14 Pro
Intel Core Ultra 5 125H
2316 Points -12%
GMK NucBox K9
Intel Core Ultra 5 125H
2297 Points -13%
Khadas Mind 2
Intel Core Ultra 7 155H
2218 Points -16%
GMK NucBox M6
AMD Ryzen 5 6600H
2042 Points -23%
GMK NucBox M5
AMD Ryzen 7 5700U
1625 Points -39%
Geekbench 5.5 / Multi-Core
Lenovo ThinkStation P3 Tiny-30H0006AGE
Intel Core i9-14900
17395 Points +123%
Beelink SER8
AMD Ryzen 7 8845HS
12196 Points +57%
Geekom AX8 Pro
AMD Ryzen 9 8945H
11980 Points +54%
GMK NucBox K6
AMD Ryzen 7 7840HS
11769 Points +51%
Geekom XT13 Pro
Intel Core i9-13900H
11536 Points +48%
Khadas Mind 2
Intel Core Ultra 7 155H
11449 Points +47%
Asus NUC 14 Pro
Intel Core Ultra 5 125H
10856 Points +39%
HP Elite Mini 800 G9-5M9X6EA
Intel Core i5-14500
10543 Points +35%
GMK NucBox K9
Intel Core Ultra 5 125H
10025 Points +29%
Beelink SER6 Pro Ryzen 7 7735HS
AMD Ryzen 7 7735HS
9357 Points +20%
Beelink SER6 Pro
AMD Ryzen 7 6800H
9218 Points +18%
Lenovo IdeaPad Slim 3i 15IRU9
Intel Core 5 120U
8576 Points +10%
GMK NucBox M6
AMD Ryzen 5 6600H
8195 Points +5%
Усредн. модель с Intel Core 7 150U
  (7178 - 8354, n=4)
7877 Points +1%
MSI Cubi NUC 1M
Intel Core 7 150U
7788 Points
GMK NucBox M5
AMD Ryzen 7 5700U
5593 Points -28%
Beelink SEi11 Pro
Intel Core i5-11320H
4959 Points -36%
Geekbench 5.5 / Single-Core
Lenovo ThinkStation P3 Tiny-30H0006AGE
Intel Core i9-14900
2140 Points +12%
Beelink SER8
AMD Ryzen 7 8845HS
2004 Points +5%
Geekom AX8 Pro
AMD Ryzen 9 8945H
1994 Points +4%
GMK NucBox K6
AMD Ryzen 7 7840HS
1986 Points +4%
MSI Cubi NUC 1M
Intel Core 7 150U
1910 Points
HP Elite Mini 800 G9-5M9X6EA
Intel Core i5-14500
1898 Points -1%
Lenovo IdeaPad Slim 3i 15IRU9
Intel Core 5 120U
1858 Points -3%
Усредн. модель с Intel Core 7 150U
  (1631 - 1969, n=4)
1855 Points -3%
Geekom XT13 Pro
Intel Core i9-13900H
1708 Points -11%
Asus NUC 14 Pro
Intel Core Ultra 5 125H
1685 Points -12%
GMK NucBox K9
Intel Core Ultra 5 125H
1668 Points -13%
Beelink SER6 Pro Ryzen 7 7735HS
AMD Ryzen 7 7735HS
1580 Points -17%
Khadas Mind 2
Intel Core Ultra 7 155H
1578 Points -17%
Beelink SER6 Pro
AMD Ryzen 7 6800H
1554 Points -19%
Beelink SEi11 Pro
Intel Core i5-11320H
1518 Points -21%
GMK NucBox M6
AMD Ryzen 5 6600H
1513 Points -21%
GMK NucBox M5
AMD Ryzen 7 5700U
1203 Points -37%
HWBOT x265 Benchmark v2.2 / 4k Preset
Lenovo ThinkStation P3 Tiny-30H0006AGE
Intel Core i9-14900
31.6 fps +269%
Beelink SER8
AMD Ryzen 7 8845HS
21.1 fps +146%
Geekom AX8 Pro
AMD Ryzen 9 8945H
20.6 fps +140%
GMK NucBox K6
AMD Ryzen 7 7840HS
20.5 fps +139%
HP Elite Mini 800 G9-5M9X6EA
Intel Core i5-14500
16.4 fps +91%
Asus NUC 14 Pro
Intel Core Ultra 5 125H
15.7 fps +83%
Khadas Mind 2
Intel Core Ultra 7 155H
15.7 fps +83%
Beelink SER6 Pro Ryzen 7 7735HS
AMD Ryzen 7 7735HS
15.1 fps +76%
Beelink SER6 Pro
AMD Ryzen 7 6800H
15 fps +75%
Geekom XT13 Pro
Intel Core i9-13900H
14.7 fps +72%
GMK NucBox M6
AMD Ryzen 5 6600H
13.9 fps +62%
GMK NucBox K9
Intel Core Ultra 5 125H
13.8 fps +61%
Усредн. модель с Intel Core 7 150U
  (8.57 - 11.1, n=4)
9.74 fps +14%
Lenovo IdeaPad Slim 3i 15IRU9
Intel Core 5 120U
8.69 fps +1%
MSI Cubi NUC 1M
Intel Core 7 150U
8.57 fps
GMK NucBox M5
AMD Ryzen 7 5700U
8.44 fps -2%
Beelink SEi11 Pro
Intel Core i5-11320H
7.28 fps -15%
LibreOffice / 20 Documents To PDF
Khadas Mind 2
Intel Core Ultra 7 155H
63.2 s * -67%
GMK NucBox M5
AMD Ryzen 7 5700U
58 s * -53%
Asus NUC 14 Pro
Intel Core Ultra 5 125H
55.7 s * -47%
GMK NucBox M6
AMD Ryzen 5 6600H
52.4 s * -38%
Geekom AX8 Pro
AMD Ryzen 9 8945H
49.8 s * -31%
Beelink SEi11 Pro
Intel Core i5-11320H
49.1 s * -30%
Beelink SER6 Pro
AMD Ryzen 7 6800H
48.8 s * -29%
Geekom XT13 Pro
Intel Core i9-13900H
46.8 s * -23%
Beelink SER8
AMD Ryzen 7 8845HS
46.1 s * -22%
HP Elite Mini 800 G9-5M9X6EA
Intel Core i5-14500
46 s * -21%
Beelink SER6 Pro Ryzen 7 7735HS
AMD Ryzen 7 7735HS
44.3 s * -17%
GMK NucBox K6
AMD Ryzen 7 7840HS
44.1 s * -16%
GMK NucBox K9
Intel Core Ultra 5 125H
44 s * -16%
Усредн. модель с Intel Core 7 150U
  (29 - 69.2, n=4)
43.6 s * -15%
Lenovo IdeaPad Slim 3i 15IRU9
Intel Core 5 120U
40.1 s * -6%
Lenovo ThinkStation P3 Tiny-30H0006AGE
Intel Core i9-14900
38.2 s * -1%
MSI Cubi NUC 1M
Intel Core 7 150U
37.9 s *
R Benchmark 2.5 / Overall mean
GMK NucBox M5
AMD Ryzen 7 5700U
0.584 sec * -32%
Beelink SEi11 Pro
Intel Core i5-11320H
0.581 sec * -31%
Khadas Mind 2
Intel Core Ultra 7 155H
0.522 sec * -18%
Beelink SER6 Pro Ryzen 7 7735HS
AMD Ryzen 7 7735HS
0.512 sec * -15%
GMK NucBox M6
AMD Ryzen 5 6600H
0.4995 sec * -13%
Beelink SER6 Pro
AMD Ryzen 7 6800H
0.4989 sec * -12%
Asus NUC 14 Pro
Intel Core Ultra 5 125H
0.4982 sec * -12%
GMK NucBox K9
Intel Core Ultra 5 125H
0.4898 sec * -10%
Geekom XT13 Pro
Intel Core i9-13900H
0.4693 sec * -6%
Lenovo IdeaPad Slim 3i 15IRU9
Intel Core 5 120U
0.4586 sec * -3%
Geekom AX8 Pro
AMD Ryzen 9 8945H
0.4576 sec * -3%
Усредн. модель с Intel Core 7 150U
  (0.4386 - 0.502, n=4)
0.4569 sec * -3%
MSI Cubi NUC 1M
Intel Core 7 150U
0.4438 sec *
HP Elite Mini 800 G9-5M9X6EA
Intel Core i5-14500
0.4356 sec * +2%
GMK NucBox K6
AMD Ryzen 7 7840HS
0.4343 sec * +2%
Beelink SER8
AMD Ryzen 7 8845HS
0.4336 sec * +2%
Lenovo ThinkStation P3 Tiny-30H0006AGE
Intel Core i9-14900
0.3803 sec * +14%
CPU Performance Rating: Percent
Cinebench R23: Multi Core | Single Core
Cinebench R20: CPU (Multi Core) | CPU (Single Core)
Cinebench R15: CPU Multi 64Bit | CPU Single 64Bit
Blender: v2.79 BMW27 CPU
7-Zip 18.03: 7z b 4 | 7z b 4 -mmt1
Geekbench 6.3: Multi-Core | Single-Core
Geekbench 5.5: Multi-Core | Single-Core
HWBOT x265 Benchmark v2.2: 4k Preset
LibreOffice : 20 Documents To PDF
R Benchmark 2.5: Overall mean

* ... меньше = лучше

Cinebench R15 CPU Multi 64Bit
1040 Points
Cinebench R15 OpenGL 64Bit
108 fps
Cinebench R15 Ref. Match 64Bit
97.8 %
Cinebench R15 CPU Single 64Bit
258 Points
Cinebench R20 CPU (Single Core)
718 Points
Cinebench R20 CPU (Multi Core)
2821 Points
Cinebench R23 Multi Core
7226 Points
Cinebench R23 Single Core
1878 Points
Cinebench 2024 CPU Single Core
108.5 Points
Cinebench 2024 CPU Multi Core
432 Points
?
Performance Rating
Beelink SER8
AMD Ryzen 7 8845HS, Radeon 780M
98.4 pt
BOSGAME M1
AMD Ryzen 7 7840HS, Radeon 780M
97.4 pt
Asus NUC 14 Pro
Intel Core Ultra 5 125H, Arc 7-Core
63.2 pt
GMK NucBox K9
Intel Core Ultra 5 125H, Arc 7-Core
59.6 pt
Усредн. модель с Intel Core 7 150U
 
40.2 pt
MSI Cubi NUC 1M
Intel Core 7 150U, Iris Xe G7 96EUs
36.4 pt
Beelink SEi11 Pro
Intel Core i5-11320H, Iris Xe G7 96EUs
35.2 pt
AIDA64 / FP32 Ray-Trace
Beelink SER8
AMD Ryzen 7 8845HS, Radeon 780M
26305 KRay/s +317%
BOSGAME M1
AMD Ryzen 7 7840HS, Radeon 780M
26022 KRay/s +313%
Asus NUC 14 Pro
Intel Core Ultra 5 125H, Arc 7-Core
13347 KRay/s +112%
GMK NucBox K9
Intel Core Ultra 5 125H, Arc 7-Core
10755 KRay/s +71%
Усредн. модель с Intel Core 7 150U
  (6306 - 7909, n=4)
7480 KRay/s +19%
Beelink SEi11 Pro
Intel Core i5-11320H, Iris Xe G7 96EUs
7047 KRay/s +12%
MSI Cubi NUC 1M
Intel Core 7 150U, Iris Xe G7 96EUs
6306 KRay/s
AIDA64 / FPU Julia
Beelink SER8
AMD Ryzen 7 8845HS, Radeon 780M
111508 Points +242%
BOSGAME M1
AMD Ryzen 7 7840HS, Radeon 780M
110752 Points +240%
Asus NUC 14 Pro
Intel Core Ultra 5 125H, Arc 7-Core
68551 Points +110%
GMK NucBox K9
Intel Core Ultra 5 125H, Arc 7-Core
58422 Points +79%
Усредн. модель с Intel Core 7 150U
  (32582 - 41382, n=4)
38359 Points +18%
MSI Cubi NUC 1M
Intel Core 7 150U, Iris Xe G7 96EUs
32582 Points
Beelink SEi11 Pro
Intel Core i5-11320H, Iris Xe G7 96EUs
29972 Points -8%
AIDA64 / CPU SHA3
Beelink SER8
AMD Ryzen 7 8845HS, Radeon 780M
4933 MB/s +198%
BOSGAME M1
AMD Ryzen 7 7840HS, Radeon 780M
4854 MB/s +193%
Asus NUC 14 Pro
Intel Core Ultra 5 125H, Arc 7-Core
3323 MB/s +101%
GMK NucBox K9
Intel Core Ultra 5 125H, Arc 7-Core
2922 MB/s +76%
Beelink SEi11 Pro
Intel Core i5-11320H, Iris Xe G7 96EUs
1992 MB/s +20%
Усредн. модель с Intel Core 7 150U
  (1656 - 2165, n=4)
1991 MB/s +20%
MSI Cubi NUC 1M
Intel Core 7 150U, Iris Xe G7 96EUs
1656 MB/s
AIDA64 / CPU Queen
BOSGAME M1
AMD Ryzen 7 7840HS, Radeon 780M
117809 Points +89%
Beelink SER8
AMD Ryzen 7 8845HS, Radeon 780M
115546 Points +86%
Asus NUC 14 Pro
Intel Core Ultra 5 125H, Arc 7-Core
79866 Points +28%
GMK NucBox K9
Intel Core Ultra 5 125H, Arc 7-Core
78797 Points +27%
Усредн. модель с Intel Core 7 150U
  (58025 - 70820, n=4)
64562 Points +4%
MSI Cubi NUC 1M
Intel Core 7 150U, Iris Xe G7 96EUs
62280 Points
Beelink SEi11 Pro
Intel Core i5-11320H, Iris Xe G7 96EUs
48212 Points -23%
AIDA64 / FPU SinJulia
Beelink SER8
AMD Ryzen 7 8845HS, Radeon 780M
15420 Points +251%
BOSGAME M1
AMD Ryzen 7 7840HS, Radeon 780M
14915 Points +240%
Asus NUC 14 Pro
Intel Core Ultra 5 125H, Arc 7-Core
7851 Points +79%
GMK NucBox K9
Intel Core Ultra 5 125H, Arc 7-Core
7780 Points +77%
Усредн. модель с Intel Core 7 150U
  (4387 - 5293, n=4)
4987 Points +14%
Beelink SEi11 Pro
Intel Core i5-11320H, Iris Xe G7 96EUs
4771 Points +9%
MSI Cubi NUC 1M
Intel Core 7 150U, Iris Xe G7 96EUs
4387 Points
AIDA64 / FPU Mandel
Beelink SER8
AMD Ryzen 7 8845HS, Radeon 780M
59522 Points +271%
BOSGAME M1
AMD Ryzen 7 7840HS, Radeon 780M
59072 Points +268%
Asus NUC 14 Pro
Intel Core Ultra 5 125H, Arc 7-Core
34225 Points +113%
GMK NucBox K9
Intel Core Ultra 5 125H, Arc 7-Core
27972 Points +74%
Усредн. модель с Intel Core 7 150U
  (16042 - 20259, n=4)
18959 Points +18%
Beelink SEi11 Pro
Intel Core i5-11320H, Iris Xe G7 96EUs
17987 Points +12%
MSI Cubi NUC 1M
Intel Core 7 150U, Iris Xe G7 96EUs
16042 Points
AIDA64 / CPU AES
Beelink SER8
AMD Ryzen 7 8845HS, Radeon 780M
172642 MB/s +423%
BOSGAME M1
AMD Ryzen 7 7840HS, Radeon 780M
166944 MB/s +406%
GMK NucBox K9
Intel Core Ultra 5 125H, Arc 7-Core
108402 MB/s +228%
Beelink SEi11 Pro
Intel Core i5-11320H, Iris Xe G7 96EUs
68683 MB/s +108%
Asus NUC 14 Pro
Intel Core Ultra 5 125H, Arc 7-Core
64107 MB/s +94%
Усредн. модель с Intel Core 7 150U
  (33007 - 41731, n=4)
39259 MB/s +19%
MSI Cubi NUC 1M
Intel Core 7 150U, Iris Xe G7 96EUs
33007 MB/s
AIDA64 / CPU ZLib
Beelink SER8
AMD Ryzen 7 8845HS, Radeon 780M
1073 MB/s +119%
BOSGAME M1
AMD Ryzen 7 7840HS, Radeon 780M
1051 MB/s +114%
Asus NUC 14 Pro
Intel Core Ultra 5 125H, Arc 7-Core
969 MB/s +97%
GMK NucBox K9
Intel Core Ultra 5 125H, Arc 7-Core
844 MB/s +72%
Усредн. модель с Intel Core 7 150U
  (491 - 695, n=4)
616 MB/s +25%
MSI Cubi NUC 1M
Intel Core 7 150U, Iris Xe G7 96EUs
491 MB/s
Beelink SEi11 Pro
Intel Core i5-11320H, Iris Xe G7 96EUs
368 MB/s -25%
AIDA64 / FP64 Ray-Trace
Beelink SER8
AMD Ryzen 7 8845HS, Radeon 780M
14041 KRay/s +311%
BOSGAME M1
AMD Ryzen 7 7840HS, Radeon 780M
13897 KRay/s +307%
Asus NUC 14 Pro
Intel Core Ultra 5 125H, Arc 7-Core
6786 KRay/s +99%
GMK NucBox K9
Intel Core Ultra 5 125H, Arc 7-Core
5657 KRay/s +66%
Усредн. модель с Intel Core 7 150U
  (3417 - 4243, n=4)
4006 KRay/s +17%
Beelink SEi11 Pro
Intel Core i5-11320H, Iris Xe G7 96EUs
3811 KRay/s +12%
MSI Cubi NUC 1M
Intel Core 7 150U, Iris Xe G7 96EUs
3417 KRay/s
AIDA64 / CPU PhotoWorxx
Asus NUC 14 Pro
Intel Core Ultra 5 125H, Arc 7-Core
47377 MPixel/s +25%
GMK NucBox K9
Intel Core Ultra 5 125H, Arc 7-Core
46296 MPixel/s +22%
BOSGAME M1
AMD Ryzen 7 7840HS, Radeon 780M
41516 MPixel/s +10%
Beelink SER8
AMD Ryzen 7 8845HS, Radeon 780M
40489 MPixel/s +7%
MSI Cubi NUC 1M
Intel Core 7 150U, Iris Xe G7 96EUs
37889 MPixel/s
Усредн. модель с Intel Core 7 150U
  (21802 - 38866, n=4)
33751 MPixel/s -11%
Beelink SEi11 Pro
Intel Core i5-11320H, Iris Xe G7 96EUs
25964 MPixel/s -31%

Стресс-тест

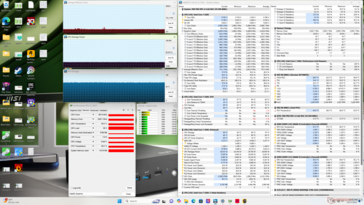
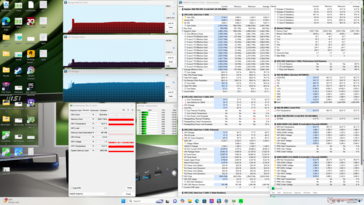
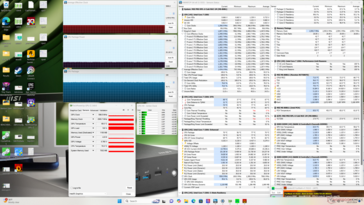
При запуске стресса Prime95 процессор разгоняется до 2,6 ГГц и 31 Вт в течение всего нескольких секунд, после чего падает и стабилизируется на уровне 1,9 ГГц и 20 Вт, как показано на скриншотах ниже. Максимальный Turbo Boost не является устойчивым, как и следовало ожидать от ПК на базе U-серии.

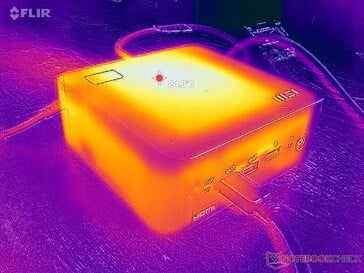
Температура ядра стабилизируется на уровне 69 C при запуске Cyberpunk 2077 по сравнению с 72 C на более быстром NucBox K9.

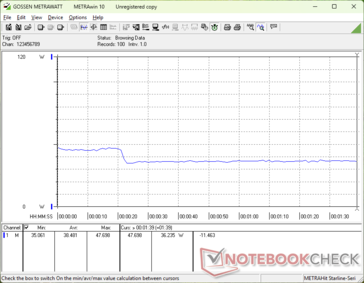
Система простаивает
Система простаивает
Киберпанк 2077 стресс
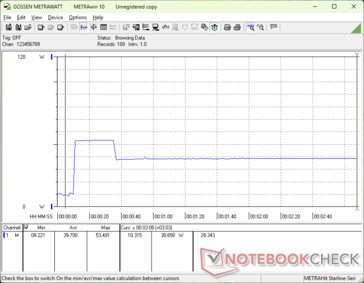
Prime95 стресс
Prime95 стресс
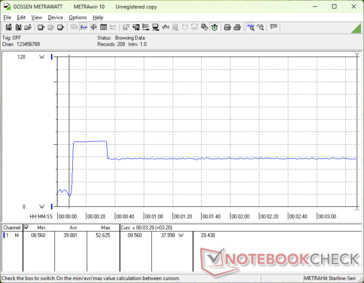
Prime95+FurMark стресс
Тактовая частота процессора (ГГц) Тактовая частота графического процессора (МГц) Средняя температура процессора (°C)
Простой системы -- -- 50
Prime95 Stress 1.9 -- 72
Prime95 + FurMark Stress 1.4 599 70
Cyberpunk 2077 Stress 0.7 998 69

Производительность системы

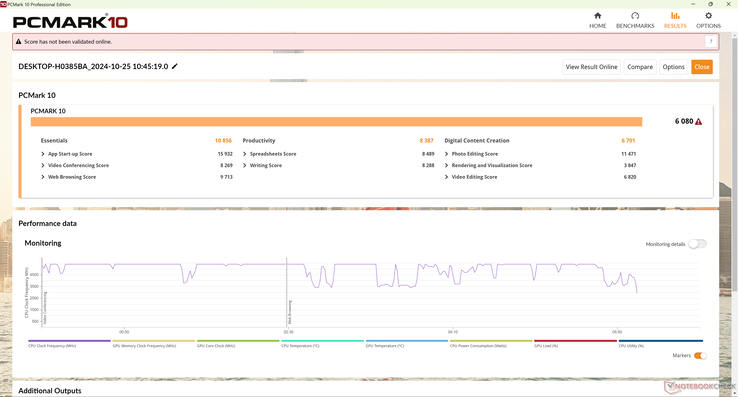
Результаты PCMark 10 достойные, но они отстают в подтесте "Создание цифрового контента" из-за медленного графического процессора Iris Xe
PCMark 10 / Score
Beelink SER8
Radeon 780M, R7 8845HS, Crucial P3 Plus CT1000P3PSSD8
7641 Points +26%
BOSGAME M1
Radeon 780M, R7 7840HS
7198 Points +18%
GMK NucBox K9
Arc 7-Core, Ultra 5 125H, MasonSemi 1TB MC7000
6463 Points +6%
Asus NUC 14 Pro
Arc 7-Core, Ultra 5 125H, Kingston KC3000 2048G SKC3000D2048G
6282 Points +3%
Усредн. модель с Intel Core 7 150U, Intel Iris Xe Graphics G7 96EUs
  (6080 - 6173, n=2)
6127 Points +1%
MSI Cubi NUC 1M
Iris Xe G7 96EUs, Core 7 150U, WD PC SN560 SDDPNQE-1T00
6080 Points
Beelink SEi11 Pro
Iris Xe G7 96EUs, i5-11320H, Kingston NV1 SNVS/500GCN
5095 Points -16%
PCMark 10 / Essentials
Beelink SER8
Radeon 780M, R7 8845HS, Crucial P3 Plus CT1000P3PSSD8
11570 Points +7%
BOSGAME M1
Radeon 780M, R7 7840HS
11211 Points +3%
Усредн. модель с Intel Core 7 150U, Intel Iris Xe Graphics G7 96EUs
  (10856 - 11219, n=2)
11038 Points +2%
MSI Cubi NUC 1M
Iris Xe G7 96EUs, Core 7 150U, WD PC SN560 SDDPNQE-1T00
10856 Points
GMK NucBox K9
Arc 7-Core, Ultra 5 125H, MasonSemi 1TB MC7000
10697 Points -1%
Beelink SEi11 Pro
Iris Xe G7 96EUs, i5-11320H, Kingston NV1 SNVS/500GCN
10281 Points -5%
Asus NUC 14 Pro
Arc 7-Core, Ultra 5 125H, Kingston KC3000 2048G SKC3000D2048G
10050 Points -7%
PCMark 10 / Productivity
Beelink SER8
Radeon 780M, R7 8845HS, Crucial P3 Plus CT1000P3PSSD8
10457 Points +25%
BOSGAME M1
Radeon 780M, R7 7840HS
9075 Points +8%
Усредн. модель с Intel Core 7 150U, Intel Iris Xe Graphics G7 96EUs
  (8387 - 8399, n=2)
8393 Points 0%
MSI Cubi NUC 1M
Iris Xe G7 96EUs, Core 7 150U, WD PC SN560 SDDPNQE-1T00
8387 Points
GMK NucBox K9
Arc 7-Core, Ultra 5 125H, MasonSemi 1TB MC7000
7659 Points -9%
Asus NUC 14 Pro
Arc 7-Core, Ultra 5 125H, Kingston KC3000 2048G SKC3000D2048G
7042 Points -16%
Beelink SEi11 Pro
Iris Xe G7 96EUs, i5-11320H, Kingston NV1 SNVS/500GCN
6915 Points -18%
PCMark 10 / Digital Content Creation
Beelink SER8
Radeon 780M, R7 8845HS, Crucial P3 Plus CT1000P3PSSD8
10009 Points +49%
BOSGAME M1
Radeon 780M, R7 7840HS
9948 Points +48%
Asus NUC 14 Pro
Arc 7-Core, Ultra 5 125H, Kingston KC3000 2048G SKC3000D2048G
9506 Points +42%
GMK NucBox K9
Arc 7-Core, Ultra 5 125H, MasonSemi 1TB MC7000
8940 Points +33%
Усредн. модель с Intel Core 7 150U, Intel Iris Xe Graphics G7 96EUs
  (6701 - 6775, n=2)
6738 Points +1%
MSI Cubi NUC 1M
Iris Xe G7 96EUs, Core 7 150U, WD PC SN560 SDDPNQE-1T00
6701 Points
Beelink SEi11 Pro
Iris Xe G7 96EUs, i5-11320H, Kingston NV1 SNVS/500GCN
5048 Points -25%
CrossMark / Overall
BOSGAME M1
Radeon 780M, R7 7840HS
1891 Points +9%
Beelink SER8
Radeon 780M, R7 8845HS, Crucial P3 Plus CT1000P3PSSD8
1875 Points +8%
MSI Cubi NUC 1M
Iris Xe G7 96EUs, Core 7 150U, WD PC SN560 SDDPNQE-1T00
1734 Points
Усредн. модель с Intel Core 7 150U, Intel Iris Xe Graphics G7 96EUs
  (1660 - 1734, n=2)
1697 Points -2%
GMK NucBox K9
Arc 7-Core, Ultra 5 125H, MasonSemi 1TB MC7000
1633 Points -6%
Asus NUC 14 Pro
Arc 7-Core, Ultra 5 125H, Kingston KC3000 2048G SKC3000D2048G
1522 Points -12%
Beelink SEi11 Pro
Iris Xe G7 96EUs, i5-11320H, Kingston NV1 SNVS/500GCN
1335 Points -23%
CrossMark / Productivity
BOSGAME M1
Radeon 780M, R7 7840HS
1823 Points +3%
Beelink SER8
Radeon 780M, R7 8845HS, Crucial P3 Plus CT1000P3PSSD8
1802 Points +1%
MSI Cubi NUC 1M
Iris Xe G7 96EUs, Core 7 150U, WD PC SN560 SDDPNQE-1T00
1778 Points
Усредн. модель с Intel Core 7 150U, Intel Iris Xe Graphics G7 96EUs
  (1649 - 1778, n=2)
1714 Points -4%
GMK NucBox K9
Arc 7-Core, Ultra 5 125H, MasonSemi 1TB MC7000
1594 Points -10%
Asus NUC 14 Pro
Arc 7-Core, Ultra 5 125H, Kingston KC3000 2048G SKC3000D2048G
1432 Points -19%
Beelink SEi11 Pro
Iris Xe G7 96EUs, i5-11320H, Kingston NV1 SNVS/500GCN
1419 Points -20%
CrossMark / Creativity
BOSGAME M1
Radeon 780M, R7 7840HS
2013 Points +18%
Beelink SER8
Radeon 780M, R7 8845HS, Crucial P3 Plus CT1000P3PSSD8
2009 Points +18%
Asus NUC 14 Pro
Arc 7-Core, Ultra 5 125H, Kingston KC3000 2048G SKC3000D2048G
1765 Points +3%
Усредн. модель с Intel Core 7 150U, Intel Iris Xe Graphics G7 96EUs
  (1708 - 1730, n=2)
1719 Points +1%
GMK NucBox K9
Arc 7-Core, Ultra 5 125H, MasonSemi 1TB MC7000
1714 Points 0%
MSI Cubi NUC 1M
Iris Xe G7 96EUs, Core 7 150U, WD PC SN560 SDDPNQE-1T00
1708 Points
Beelink SEi11 Pro
Iris Xe G7 96EUs, i5-11320H, Kingston NV1 SNVS/500GCN
1256 Points -26%
CrossMark / Responsiveness
BOSGAME M1
Radeon 780M, R7 7840HS
1749 Points +4%
Beelink SER8
Radeon 780M, R7 8845HS, Crucial P3 Plus CT1000P3PSSD8
1718 Points +2%
MSI Cubi NUC 1M
Iris Xe G7 96EUs, Core 7 150U, WD PC SN560 SDDPNQE-1T00
1685 Points
Усредн. модель с Intel Core 7 150U, Intel Iris Xe Graphics G7 96EUs
  (1493 - 1685, n=2)
1589 Points -6%
GMK NucBox K9
Arc 7-Core, Ultra 5 125H, MasonSemi 1TB MC7000
1520 Points -10%
Beelink SEi11 Pro
Iris Xe G7 96EUs, i5-11320H, Kingston NV1 SNVS/500GCN
1336 Points -21%
Asus NUC 14 Pro
Arc 7-Core, Ultra 5 125H, Kingston KC3000 2048G SKC3000D2048G
1171 Points -31%
WebXPRT 3 / Overall
Beelink SER8
Radeon 780M, R7 8845HS, Crucial P3 Plus CT1000P3PSSD8
334 Points +7%
BOSGAME M1
Radeon 780M, R7 7840HS
319 Points +3%
MSI Cubi NUC 1M
Iris Xe G7 96EUs, Core 7 150U, WD PC SN560 SDDPNQE-1T00
311 Points
Усредн. модель с Intel Core 7 150U, Intel Iris Xe Graphics G7 96EUs
  (307 - 311, n=2)
309 Points -1%
Beelink SEi11 Pro
Iris Xe G7 96EUs, i5-11320H, Kingston NV1 SNVS/500GCN
264 Points -15%
GMK NucBox K9
Arc 7-Core, Ultra 5 125H, MasonSemi 1TB MC7000
262 Points -16%
Asus NUC 14 Pro
Arc 7-Core, Ultra 5 125H, Kingston KC3000 2048G SKC3000D2048G
254 Points -18%
WebXPRT 4 / Overall
Усредн. модель с Intel Core 7 150U, Intel Iris Xe Graphics G7 96EUs
  (271 - 276, n=2)
274 Points +1%
MSI Cubi NUC 1M
Iris Xe G7 96EUs, Core 7 150U, WD PC SN560 SDDPNQE-1T00
271 Points
Beelink SER8
Radeon 780M, R7 8845HS, Crucial P3 Plus CT1000P3PSSD8
266 Points -2%
BOSGAME M1
Radeon 780M, R7 7840HS
258 Points -5%
Asus NUC 14 Pro
Arc 7-Core, Ultra 5 125H, Kingston KC3000 2048G SKC3000D2048G
231 Points -15%
GMK NucBox K9
Arc 7-Core, Ultra 5 125H, MasonSemi 1TB MC7000
231 Points -15%
Beelink SEi11 Pro
Iris Xe G7 96EUs, i5-11320H, Kingston NV1 SNVS/500GCN
206 Points -24%
Mozilla Kraken 1.1 / Total
Beelink SEi11 Pro
Iris Xe G7 96EUs, i5-11320H, Kingston NV1 SNVS/500GCN
663 ms * -36%
Asus NUC 14 Pro
Arc 7-Core, Ultra 5 125H, Kingston KC3000 2048G SKC3000D2048G
567 ms * -16%
GMK NucBox K9
Arc 7-Core, Ultra 5 125H, MasonSemi 1TB MC7000
566 ms * -16%
BOSGAME M1
Radeon 780M, R7 7840HS
526 ms * -8%
Beelink SER8
Radeon 780M, R7 8845HS, Crucial P3 Plus CT1000P3PSSD8
501 ms * -2%
Усредн. модель с Intel Core 7 150U, Intel Iris Xe Graphics G7 96EUs
  (489 - 502, n=2)
496 ms * -1%
MSI Cubi NUC 1M
Iris Xe G7 96EUs, Core 7 150U, WD PC SN560 SDDPNQE-1T00
489 ms *

* ... меньше = лучше

PCMark 10 Score
6080 баллов
?
AIDA64 / Memory Copy
BOSGAME M1
AMD Ryzen 7 7840HS, Radeon 780M
69508 MB/s +17%
Asus NUC 14 Pro
Intel Core Ultra 5 125H, Arc 7-Core
69264 MB/s +16%
Beelink SER8
AMD Ryzen 7 8845HS, Radeon 780M
68283 MB/s +15%
GMK NucBox K9
Intel Core Ultra 5 125H, Arc 7-Core
67482 MB/s +13%
MSI Cubi NUC 1M
Intel Core 7 150U, Iris Xe G7 96EUs
59609 MB/s
Усредн. модель с Intel Core 7 150U
  (36579 - 61190, n=4)
53226 MB/s -11%
Beelink SEi11 Pro
Intel Core i5-11320H, Iris Xe G7 96EUs
41106 MB/s -31%
AIDA64 / Memory Read
Asus NUC 14 Pro
Intel Core Ultra 5 125H, Arc 7-Core
74415 MB/s +8%
GMK NucBox K9
Intel Core Ultra 5 125H, Arc 7-Core
70520 MB/s +3%
MSI Cubi NUC 1M
Intel Core 7 150U, Iris Xe G7 96EUs
68780 MB/s
Beelink SER8
AMD Ryzen 7 8845HS, Radeon 780M
61976 MB/s -10%
BOSGAME M1
AMD Ryzen 7 7840HS, Radeon 780M
61765 MB/s -10%
Усредн. модель с Intel Core 7 150U
  (39827 - 68780, n=4)
55315 MB/s -20%
Beelink SEi11 Pro
Intel Core i5-11320H, Iris Xe G7 96EUs
46516 MB/s -32%
AIDA64 / Memory Write
BOSGAME M1
AMD Ryzen 7 7840HS, Radeon 780M
86719 MB/s +43%
Beelink SER8
AMD Ryzen 7 8845HS, Radeon 780M
85464 MB/s +41%
Asus NUC 14 Pro
Intel Core Ultra 5 125H, Arc 7-Core
72443 MB/s +19%
GMK NucBox K9
Intel Core Ultra 5 125H, Arc 7-Core
71218 MB/s +17%
Усредн. модель с Intel Core 7 150U
  (44925 - 78327, n=4)
60724 MB/s 0%
MSI Cubi NUC 1M
Intel Core 7 150U, Iris Xe G7 96EUs
60626 MB/s
Beelink SEi11 Pro
Intel Core i5-11320H, Iris Xe G7 96EUs
46760 MB/s -23%
AIDA64 / Memory Latency
GMK NucBox K9
Intel Core Ultra 5 125H, Arc 7-Core
140.2 ns * -88%
Asus NUC 14 Pro
Intel Core Ultra 5 125H, Arc 7-Core
127.3 ns * -71%
BOSGAME M1
AMD Ryzen 7 7840HS, Radeon 780M
89.8 ns * -21%
Beelink SER8
AMD Ryzen 7 8845HS, Radeon 780M
88.9 ns * -19%
Усредн. модель с Intel Core 7 150U
  (74.5 - 100, n=4)
87.9 ns * -18%
Beelink SEi11 Pro
Intel Core i5-11320H, Iris Xe G7 96EUs
81 ns * -9%
MSI Cubi NUC 1M
Intel Core 7 150U, Iris Xe G7 96EUs
74.5 ns *

* ... меньше = лучше

Задержка DPC

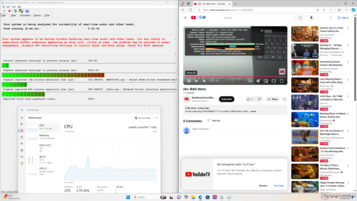
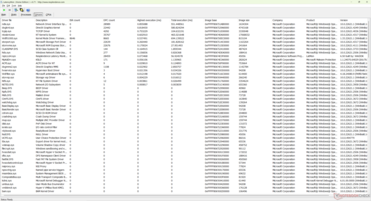
LatencyMon выявляет незначительные проблемы с DPC при открытии нескольких вкладок браузера на нашей домашней странице. воспроизведение 4K-видео при 60 FPS в остальном превосходно: за 60-секундный период был зафиксирован всего один выпавший кадр.

LatencyMon
LatencyMon
Список драйверов
Список драйверов
DPC Latencies / LatencyMon - interrupt to process latency (max), Web, Youtube, Prime95
GMK NucBox K9
Arc 7-Core, Ultra 5 125H, MasonSemi 1TB MC7000
29083.3 μs * -609%
MSI Cubi NUC 1M
Iris Xe G7 96EUs, Core 7 150U, WD PC SN560 SDDPNQE-1T00
4103.1 μs *
Asus NUC 14 Pro
Arc 7-Core, Ultra 5 125H, Kingston KC3000 2048G SKC3000D2048G
2776 μs * +32%
BOSGAME M1
Radeon 780M, R7 7840HS
1179.5 μs * +71%
Beelink SER8
Radeon 780M, R7 8845HS, Crucial P3 Plus CT1000P3PSSD8
1071.2 μs * +74%
Beelink SEi11 Pro
Iris Xe G7 96EUs, i5-11320H, Kingston NV1 SNVS/500GCN
167.2 μs * +96%

* ... меньше = лучше

Накопитель

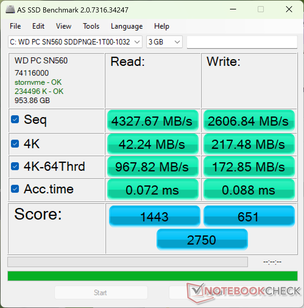
Наше устройство поставляется со средним уровнем WD PC SN560 SDDPNQE-1T00 Твердотельный накопитель M.2 PCIe4 x4 NVMe, обеспечивающий стабильную скорость передачи данных до 5000 МБ/с. Мы ценим то, что теплораспределитель SSD входит в стандартную комплектацию и предустановлен.

AS SSD
AS SSD
CDM 8
CDM 8
WD PC SN560 SDDPNQE-1T00
CDM 5/6 Read Seq Q32T1: 4996 MB/s
CDM 5/6 Write Seq Q32T1: 2784 MB/s
CDM 5/6 Read 4K Q32T1: 846.2 MB/s
CDM 5/6 Write 4K Q32T1: 551.3 MB/s
CDM 5 Read Seq: 4572 MB/s
CDM 5 Write Seq: 2754 MB/s
CDM 5/6 Read 4K: 74.62 MB/s
CDM 5/6 Write 4K: 260.7 MB/s
Drive Performance Rating - Percent
GMK NucBox K9
MasonSemi 1TB MC7000
83.9 pt
Beelink SER8
Crucial P3 Plus CT1000P3PSSD8
64.2 pt
Asus NUC 14 Pro
Kingston KC3000 2048G SKC3000D2048G
63.5 pt
BOSGAME M1
 
57 pt
MSI Cubi NUC 1M
WD PC SN560 SDDPNQE-1T00
56.9 pt
Beelink SEi11 Pro
Kingston NV1 SNVS/500GCN
37.7 pt
DiskSpd
seq read
MSI Cubi NUC 1M
WD PC SN560 SDDPNQE-1T00
4128 (4092.8min - 4128.38max) MB/s
GMK NucBox K9
MasonSemi 1TB MC7000
3783 (3597.81min - 3782.84max) MB/s -8%
Asus NUC 14 Pro
Kingston KC3000 2048G SKC3000D2048G
3706 (3594.04min - 3706.37max) MB/s -10%
Beelink SER8
Crucial P3 Plus CT1000P3PSSD8
3106 (3062.47min - 3106.43max) MB/s -25%
BOSGAME M1
 
2533 (2518.88min - 2532.52max) MB/s -39%
Beelink SEi11 Pro
Kingston NV1 SNVS/500GCN
1638 (1628.34min - 1637.59max) MB/s -60%
seq write
GMK NucBox K9
MasonSemi 1TB MC7000
5556 (1352.45min - 5556.19max) MB/s +73%
Beelink SER8
Crucial P3 Plus CT1000P3PSSD8
4604 (4532.99min - 4603.88max) MB/s +43%
MSI Cubi NUC 1M
WD PC SN560 SDDPNQE-1T00
3215 (3133.8min - 3214.8max) MB/s
BOSGAME M1
 
3176 (2921.36min - 3176.08max) MB/s -1%
Asus NUC 14 Pro
Kingston KC3000 2048G SKC3000D2048G
2928 (1958.53min - 2927.62max) MB/s -9%
Beelink SEi11 Pro
Kingston NV1 SNVS/500GCN
1661 (336.85min - 1661.33max) MB/s -48%
seq q8 t1 read
Asus NUC 14 Pro
Kingston KC3000 2048G SKC3000D2048G
7110 (6058.21min - 7110.02max) MB/s +43%
GMK NucBox K9
MasonSemi 1TB MC7000
7066 (6607.49min - 7066.35max) MB/s +42%
Beelink SER8
Crucial P3 Plus CT1000P3PSSD8
5195 (4594.02min - 5195.39max) MB/s +4%
MSI Cubi NUC 1M
WD PC SN560 SDDPNQE-1T00
4987 (4558.37min - 4987.33max) MB/s
BOSGAME M1
 
4109 (3651.18min - 4108.53max) MB/s -18%
Beelink SEi11 Pro
Kingston NV1 SNVS/500GCN
2374 (2218.75min - 2374.19max) MB/s -52%
seq q8 t1 write
GMK NucBox K9
MasonSemi 1TB MC7000
6647 (1260.59min - 6647.13max) MB/s +101%
Beelink SER8
Crucial P3 Plus CT1000P3PSSD8
4725 (4657.36min - 4724.88max) MB/s +43%
Asus NUC 14 Pro
Kingston KC3000 2048G SKC3000D2048G
4712 (3064.99min - 4711.88max) MB/s +42%
MSI Cubi NUC 1M
WD PC SN560 SDDPNQE-1T00
3308 (3211.45min - 3307.84max) MB/s
BOSGAME M1
 
3187 (3142.8min - 3187.38max) MB/s -4%
Beelink SEi11 Pro
Kingston NV1 SNVS/500GCN
1433 (67.32min - 1432.98max) MB/s -57%
4k q1 t1 read
Beelink SER8
Crucial P3 Plus CT1000P3PSSD8
79.7 (77.93min - 79.74max) MB/s +9%
GMK NucBox K9
MasonSemi 1TB MC7000
79.5 (78.92min - 79.5max) MB/s +8%
MSI Cubi NUC 1M
WD PC SN560 SDDPNQE-1T00
73.3 (72.01min - 73.31max) MB/s
BOSGAME M1
 
64.4 (64.2min - 64.35max) MB/s -12%
Asus NUC 14 Pro
Kingston KC3000 2048G SKC3000D2048G
53.4 (49.89min - 53.35max) MB/s -27%
Beelink SEi11 Pro
Kingston NV1 SNVS/500GCN
50.5 (48.13min - 50.48max) MB/s -31%
4k q1 t1 write
Beelink SER8
Crucial P3 Plus CT1000P3PSSD8
289 (283.17min - 289.07max) MB/s +2%
MSI Cubi NUC 1M
WD PC SN560 SDDPNQE-1T00
282 (265.11min - 281.58max) MB/s
BOSGAME M1
 
261 (258.95min - 260.75max) MB/s -7%
GMK NucBox K9
MasonSemi 1TB MC7000
205 (173.87min - 205.2max) MB/s -27%
Beelink SEi11 Pro
Kingston NV1 SNVS/500GCN
173.6 (113.3min - 173.62max) MB/s -38%
Asus NUC 14 Pro
Kingston KC3000 2048G SKC3000D2048G
83.1 (75.3min - 83.11max) MB/s -71%
4k q32 t16 read
Beelink SER8
Crucial P3 Plus CT1000P3PSSD8
3139 (3067min - 3138.94max) MB/s +105%
GMK NucBox K9
MasonSemi 1TB MC7000
2243 (1941.91min - 2243.48max) MB/s +46%
MSI Cubi NUC 1M
WD PC SN560 SDDPNQE-1T00
1533 (1419.74min - 1533.25max) MB/s
BOSGAME M1
 
791 (751.42min - 791.35max) MB/s -48%
Beelink SEi11 Pro
Kingston NV1 SNVS/500GCN
745 (742.2min - 744.53max) MB/s -51%
Asus NUC 14 Pro
Kingston KC3000 2048G SKC3000D2048G
731 (660.89min - 731.29max) MB/s -52%
4k q32 t16 write
Beelink SER8
Crucial P3 Plus CT1000P3PSSD8
4288 (4275.2min - 4287.55max) MB/s +113%
GMK NucBox K9
MasonSemi 1TB MC7000
3232 (3002.64min - 3232.41max) MB/s +61%
BOSGAME M1
 
3112 (3068.44min - 3111.56max) MB/s +55%
MSI Cubi NUC 1M
WD PC SN560 SDDPNQE-1T00
2010 (1622.95min - 2010.14max) MB/s
Beelink SEi11 Pro
Kingston NV1 SNVS/500GCN
733 (332min - 733.18max) MB/s -64%
Asus NUC 14 Pro
Kingston KC3000 2048G SKC3000D2048G
186.7 (155.05min - 186.74max) MB/s -91%
AS SSD
Score Total
GMK NucBox K9
MasonSemi 1TB MC7000
7509 Points +173%
Asus NUC 14 Pro
Kingston KC3000 2048G SKC3000D2048G
5131 Points +87%
BOSGAME M1
 
4263 Points +55%
MSI Cubi NUC 1M
WD PC SN560 SDDPNQE-1T00
2750 Points
Beelink SEi11 Pro
Kingston NV1 SNVS/500GCN
2742 Points 0%
Beelink SER8
Crucial P3 Plus CT1000P3PSSD8
2646 Points -4%
Score Read
GMK NucBox K9
MasonSemi 1TB MC7000
3258 Points +126%
MSI Cubi NUC 1M
WD PC SN560 SDDPNQE-1T00
1443 Points
Asus NUC 14 Pro
Kingston KC3000 2048G SKC3000D2048G
1275 Points -12%
BOSGAME M1
 
1146 Points -21%
Beelink SER8
Crucial P3 Plus CT1000P3PSSD8
1108 Points -23%
Beelink SEi11 Pro
Kingston NV1 SNVS/500GCN
975 Points -32%
Score Write
Asus NUC 14 Pro
Kingston KC3000 2048G SKC3000D2048G
3313 Points +409%
GMK NucBox K9
MasonSemi 1TB MC7000
2593 Points +298%
BOSGAME M1
 
2547 Points +291%
Beelink SEi11 Pro
Kingston NV1 SNVS/500GCN
1282 Points +97%
Beelink SER8
Crucial P3 Plus CT1000P3PSSD8
1057 Points +62%
MSI Cubi NUC 1M
WD PC SN560 SDDPNQE-1T00
651 Points
Seq Read
GMK NucBox K9
MasonSemi 1TB MC7000
5766.47 MB/s +33%
Asus NUC 14 Pro
Kingston KC3000 2048G SKC3000D2048G
5158 MB/s +19%
MSI Cubi NUC 1M
WD PC SN560 SDDPNQE-1T00
4327.67 MB/s
Beelink SER8
Crucial P3 Plus CT1000P3PSSD8
3913.46 MB/s -10%
BOSGAME M1
 
3438.69 MB/s -21%
Beelink SEi11 Pro
Kingston NV1 SNVS/500GCN
2246.84 MB/s -48%
Seq Write
GMK NucBox K9
MasonSemi 1TB MC7000
5653.88 MB/s +117%
BOSGAME M1
 
2877.44 MB/s +10%
Asus NUC 14 Pro
Kingston KC3000 2048G SKC3000D2048G
2646 MB/s +2%
MSI Cubi NUC 1M
WD PC SN560 SDDPNQE-1T00
2606.84 MB/s
Beelink SER8
Crucial P3 Plus CT1000P3PSSD8
1944.73 MB/s -25%
Beelink SEi11 Pro
Kingston NV1 SNVS/500GCN
1764.26 MB/s -32%
4K Read
GMK NucBox K9
MasonSemi 1TB MC7000
67.66 MB/s +60%
Asus NUC 14 Pro
Kingston KC3000 2048G SKC3000D2048G
63.6 MB/s +51%
Beelink SER8
Crucial P3 Plus CT1000P3PSSD8
51.6 MB/s +22%
BOSGAME M1
 
48.27 MB/s +14%
Beelink SEi11 Pro
Kingston NV1 SNVS/500GCN
44.12 MB/s +4%
MSI Cubi NUC 1M
WD PC SN560 SDDPNQE-1T00
42.24 MB/s
4K Write
Beelink SER8
Crucial P3 Plus CT1000P3PSSD8
219.02 MB/s +1%
MSI Cubi NUC 1M
WD PC SN560 SDDPNQE-1T00
217.48 MB/s
Beelink SEi11 Pro
Kingston NV1 SNVS/500GCN
192.62 MB/s -11%
Asus NUC 14 Pro
Kingston KC3000 2048G SKC3000D2048G
169.5 MB/s -22%
GMK NucBox K9
MasonSemi 1TB MC7000
148.58 MB/s -32%
BOSGAME M1
 
114.69 MB/s -47%
4K-64 Read
GMK NucBox K9
MasonSemi 1TB MC7000
2614.06 MB/s +170%
MSI Cubi NUC 1M
WD PC SN560 SDDPNQE-1T00
967.82 MB/s
BOSGAME M1
 
754.28 MB/s -22%
Beelink SEi11 Pro
Kingston NV1 SNVS/500GCN
706.35 MB/s -27%
Asus NUC 14 Pro
Kingston KC3000 2048G SKC3000D2048G
695 MB/s -28%
Beelink SER8
Crucial P3 Plus CT1000P3PSSD8
664.76 MB/s -31%
4K-64 Write
Asus NUC 14 Pro
Kingston KC3000 2048G SKC3000D2048G
2878 MB/s +1565%
BOSGAME M1
 
2144.62 MB/s +1141%
GMK NucBox K9
MasonSemi 1TB MC7000
1879.53 MB/s +987%
Beelink SEi11 Pro
Kingston NV1 SNVS/500GCN
912.72 MB/s +428%
Beelink SER8
Crucial P3 Plus CT1000P3PSSD8
643.31 MB/s +272%
MSI Cubi NUC 1M
WD PC SN560 SDDPNQE-1T00
172.85 MB/s
Access Time Read
BOSGAME M1
 
0.088 ms * -22%
Beelink SER8
Crucial P3 Plus CT1000P3PSSD8
0.077 ms * -7%
MSI Cubi NUC 1M
WD PC SN560 SDDPNQE-1T00
0.072 ms *
GMK NucBox K9
MasonSemi 1TB MC7000
0.06 ms * +17%
Beelink SEi11 Pro
Kingston NV1 SNVS/500GCN
0.053 ms * +26%
Asus NUC 14 Pro
Kingston KC3000 2048G SKC3000D2048G
0.053 ms * +26%
Access Time Write
Beelink SEi11 Pro
Kingston NV1 SNVS/500GCN
0.342 ms * -289%
GMK NucBox K9
MasonSemi 1TB MC7000
0.195 ms * -122%
MSI Cubi NUC 1M
WD PC SN560 SDDPNQE-1T00
0.088 ms *
Beelink SER8
Crucial P3 Plus CT1000P3PSSD8
0.075 ms * +15%
BOSGAME M1
 
0.058 ms * +34%
Asus NUC 14 Pro
Kingston KC3000 2048G SKC3000D2048G
0.043 ms * +51%

* ... меньше = лучше

Чтение в DiskSpd, Глубина запроса 8

02605207801040130015601820208023402600286031203380364039004160442046804940Tooltip
MSI Cubi NUC 1M WD PC SN560 SDDPNQE-1T00; diskspd 2.0.17 f: Ø4962 (4554.8-4986.07)
Beelink SER8 Crucial P3 Plus CT1000P3PSSD8; diskspd 2.0.17 f: Ø5188 (4957.94-5197.46)

Производительность GPU

 Iris Xe G7 96 EUs ему уже несколько лет, и поэтому он значительно отстает от большинства новых мини-ПК, работающих на платформах Meteor Lake или Zen 4 и выше. Поэтому Cubi NUC 1M больше подходит для потокового вещания и легких 2D-игр.

Работа в сбалансированном режиме вместо режима Performance, похоже, не влияет на производительность, поскольку в наших тестах 3DMark их результаты были почти одинаковыми.

Снижение до конфигурации Core 5 120U, как ожидается, повлияет на производительность графики примерно на 10-20%, поскольку процессор Core 5 работает в паре с более медленным интегрированным процессором Iris Xe 80 EUs вместо этого.

X-Plane не смог запуститься на нашем устройстве Cubi 1M, поэтому его результаты не представлены ниже.

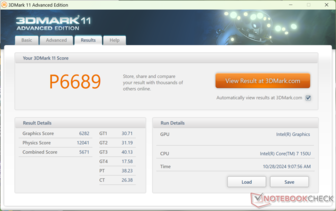
3DMark 11
3DMark 11
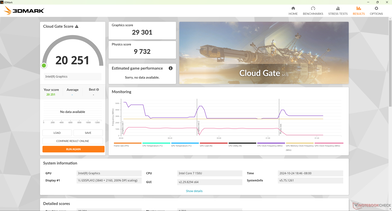
Cloud Gate
Cloud Gate
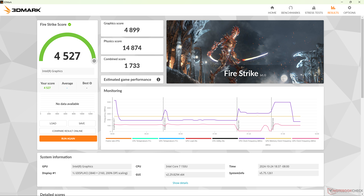
Fire Strike
Fire Strike
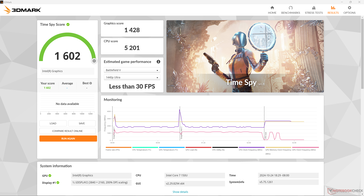
Time Spy
Time Spy
3DMark Performance Rating - Percent
Beelink SER8
AMD Radeon 780M, AMD Ryzen 7 8845HS
97.2 pt
GMK NucBox K6 -1!
AMD Radeon 780M, AMD Ryzen 7 7840HS
94.7 pt
Lenovo ThinkStation P3 Tiny-30H0006AGE
NVIDIA T1000, Intel Core i9-14900
93.4 pt
Geekom AX8 Pro
AMD Radeon 780M, AMD Ryzen 9 8945H
92.3 pt
Khadas Mind 2
Intel Arc 8-Core iGPU, Intel Core Ultra 7 155H
92.2 pt
Asus NUC 14 Pro
Intel Arc 7-Core iGPU, Intel Core Ultra 5 125H
88.7 pt
GMK NucBox K9
Intel Arc 7-Core iGPU, Intel Core Ultra 5 125H
81.6 pt
Beelink SER6 Pro
AMD Radeon 680M, AMD Ryzen 7 6800H
80.4 pt
Beelink SER6 Pro Ryzen 7 7735HS -1!
AMD Radeon 680M, AMD Ryzen 7 7735HS
78.4 pt
Geekom XT13 Pro
Intel Iris Xe Graphics G7 96EUs, Intel Core i9-13900H
59.6 pt
GMK NucBox M6
AMD Radeon 660M, AMD Ryzen 5 6600H
54.7 pt
MSI Cubi NUC 1M
Intel Iris Xe Graphics G7 96EUs, Intel Core 7 150U
50.4 pt
Усредн. модель с Intel Iris Xe Graphics G7 96EUs
 
49.8 pt
Beelink SEi11 Pro
Intel Iris Xe Graphics G7 96EUs, Intel Core i5-11320H
48.4 pt
Lenovo IdeaPad Slim 3i 15IRU9
Intel Iris Xe Graphics G7 80EUs, Intel Core 5 120U
46.5 pt
GMK NucBox M5
AMD Radeon RX Vega 8 (Ryzen 4000/5000), AMD Ryzen 7 5700U
41.1 pt
HP Elite Mini 800 G9-5M9X6EA
Intel UHD Graphics 770, Intel Core i5-14500
27.3 pt
3DMark 11 - 1280x720 Performance GPU
GMK NucBox K6
AMD Radeon 780M, AMD Ryzen 7 7840HS
13716 Points +118%
Beelink SER8
AMD Radeon 780M, AMD Ryzen 7 8845HS
13673 Points +118%
Geekom AX8 Pro
AMD Radeon 780M, AMD Ryzen 9 8945H
13281 Points +111%
Khadas Mind 2
Intel Arc 8-Core iGPU, Intel Core Ultra 7 155H
11902 Points +89%
Lenovo ThinkStation P3 Tiny-30H0006AGE
NVIDIA T1000, Intel Core i9-14900
11793 Points +88%
Asus NUC 14 Pro
Intel Arc 7-Core iGPU, Intel Core Ultra 5 125H
11785 Points +88%
Beelink SER6 Pro
AMD Radeon 680M, AMD Ryzen 7 6800H
10807 Points +72%
GMK NucBox K9
Intel Arc 7-Core iGPU, Intel Core Ultra 5 125H
10737 Points +71%
Beelink SER6 Pro Ryzen 7 7735HS
AMD Radeon 680M, AMD Ryzen 7 7735HS
10734 Points +71%
Geekom XT13 Pro
Intel Iris Xe Graphics G7 96EUs, Intel Core i9-13900H
7428 Points +18%
GMK NucBox M6
AMD Radeon 660M, AMD Ryzen 5 6600H
7184 Points +14%
Beelink SEi11 Pro
Intel Iris Xe Graphics G7 96EUs, Intel Core i5-11320H
6571 Points +5%
Усредн. модель с Intel Iris Xe Graphics G7 96EUs
  (2867 - 7676, n=202)
6353 Points +1%
MSI Cubi NUC 1M
Intel Iris Xe Graphics G7 96EUs, Intel Core 7 150U
6282 Points
Lenovo IdeaPad Slim 3i 15IRU9
Intel Iris Xe Graphics G7 80EUs, Intel Core 5 120U
5606 Points -11%
GMK NucBox M5
AMD Radeon RX Vega 8 (Ryzen 4000/5000), AMD Ryzen 7 5700U
5388 Points -14%
HP Elite Mini 800 G9-5M9X6EA
Intel UHD Graphics 770, Intel Core i5-14500
3428 Points -45%
3DMark
1280x720 Cloud Gate Standard Graphics
Beelink SER8
AMD Radeon 780M, AMD Ryzen 7 8845HS
53347 Points +82%
Lenovo ThinkStation P3 Tiny-30H0006AGE
NVIDIA T1000, Intel Core i9-14900
50553 Points +73%
Geekom AX8 Pro
AMD Radeon 780M, AMD Ryzen 9 8945H
48166 Points +64%
Beelink SER6 Pro
AMD Radeon 680M, AMD Ryzen 7 6800H
45727 Points +56%
Khadas Mind 2
Intel Arc 8-Core iGPU, Intel Core Ultra 7 155H
45726 Points +56%
Asus NUC 14 Pro
Intel Arc 7-Core iGPU, Intel Core Ultra 5 125H
41975 Points +43%
GMK NucBox K9
Intel Arc 7-Core iGPU, Intel Core Ultra 5 125H
39695 Points +35%
Geekom XT13 Pro
Intel Iris Xe Graphics G7 96EUs, Intel Core i9-13900H
34469 Points +18%
GMK NucBox M6
AMD Radeon 660M, AMD Ryzen 5 6600H
31849 Points +9%
MSI Cubi NUC 1M
Intel Iris Xe Graphics G7 96EUs, Intel Core 7 150U
29301 Points
Lenovo IdeaPad Slim 3i 15IRU9
Intel Iris Xe Graphics G7 80EUs, Intel Core 5 120U
26873 Points -8%
Усредн. модель с Intel Iris Xe Graphics G7 96EUs
  (13162 - 38578, n=180)
26508 Points -10%
Beelink SEi11 Pro
Intel Iris Xe Graphics G7 96EUs, Intel Core i5-11320H
26093 Points -11%
GMK NucBox M5
AMD Radeon RX Vega 8 (Ryzen 4000/5000), AMD Ryzen 7 5700U
25003 Points -15%
HP Elite Mini 800 G9-5M9X6EA
Intel UHD Graphics 770, Intel Core i5-14500
16443 Points -44%
1920x1080 Fire Strike Graphics
Beelink SER8
AMD Radeon 780M, AMD Ryzen 7 8845HS
8572 Points +75%
Lenovo ThinkStation P3 Tiny-30H0006AGE
NVIDIA T1000, Intel Core i9-14900
8450 Points +72%
Khadas Mind 2
Intel Arc 8-Core iGPU, Intel Core Ultra 7 155H
8260 Points +69%
GMK NucBox K6
AMD Radeon 780M, AMD Ryzen 7 7840HS
8164 Points +67%
Geekom AX8 Pro
AMD Radeon 780M, AMD Ryzen 9 8945H
8117 Points +66%
Asus NUC 14 Pro
Intel Arc 7-Core iGPU, Intel Core Ultra 5 125H
7900 Points +61%
GMK NucBox K9
Intel Arc 7-Core iGPU, Intel Core Ultra 5 125H
7325 Points +50%
Beelink SER6 Pro Ryzen 7 7735HS
AMD Radeon 680M, AMD Ryzen 7 7735HS
7180 Points +47%
Beelink SER6 Pro
AMD Radeon 680M, AMD Ryzen 7 6800H
7026 Points +43%
Geekom XT13 Pro
Intel Iris Xe Graphics G7 96EUs, Intel Core i9-13900H
5845 Points +19%
GMK NucBox M6
AMD Radeon 660M, AMD Ryzen 5 6600H
4984 Points +2%
Усредн. модель с Intel Iris Xe Graphics G7 96EUs
  (2286 - 6482, n=215)
4920 Points 0%
MSI Cubi NUC 1M
Intel Iris Xe Graphics G7 96EUs, Intel Core 7 150U
4899 Points
Lenovo IdeaPad Slim 3i 15IRU9
Intel Iris Xe Graphics G7 80EUs, Intel Core 5 120U
4651 Points -5%
Beelink SEi11 Pro
Intel Iris Xe Graphics G7 96EUs, Intel Core i5-11320H
4523 Points -8%
GMK NucBox M5
AMD Radeon RX Vega 8 (Ryzen 4000/5000), AMD Ryzen 7 5700U
3653 Points -25%
HP Elite Mini 800 G9-5M9X6EA
Intel UHD Graphics 770, Intel Core i5-14500
2655 Points -46%
2560x1440 Time Spy Graphics
Khadas Mind 2
Intel Arc 8-Core iGPU, Intel Core Ultra 7 155H
3269 Points +129%
Asus NUC 14 Pro
Intel Arc 7-Core iGPU, Intel Core Ultra 5 125H
3205 Points +124%
Lenovo ThinkStation P3 Tiny-30H0006AGE
NVIDIA T1000, Intel Core i9-14900
3088 Points +116%
Beelink SER8
AMD Radeon 780M, AMD Ryzen 7 8845HS
2917 Points +104%
GMK NucBox K6
AMD Radeon 780M, AMD Ryzen 7 7840HS
2906 Points +104%
GMK NucBox K9
Intel Arc 7-Core iGPU, Intel Core Ultra 5 125H
2881 Points +102%
Geekom AX8 Pro
AMD Radeon 780M, AMD Ryzen 9 8945H
2852 Points +100%
Beelink SER6 Pro
AMD Radeon 680M, AMD Ryzen 7 6800H
2452 Points +72%
Beelink SER6 Pro Ryzen 7 7735HS
AMD Radeon 680M, AMD Ryzen 7 7735HS
2395 Points +68%
Geekom XT13 Pro
Intel Iris Xe Graphics G7 96EUs, Intel Core i9-13900H
1682 Points +18%
GMK NucBox M6
AMD Radeon 660M, AMD Ryzen 5 6600H
1582 Points +11%
Усредн. модель с Intel Iris Xe Graphics G7 96EUs
  (707 - 1871, n=212)
1495 Points +5%
Beelink SEi11 Pro
Intel Iris Xe Graphics G7 96EUs, Intel Core i5-11320H
1443 Points +1%
MSI Cubi NUC 1M
Intel Iris Xe Graphics G7 96EUs, Intel Core 7 150U
1428 Points
Lenovo IdeaPad Slim 3i 15IRU9
Intel Iris Xe Graphics G7 80EUs, Intel Core 5 120U
1329 Points -7%
GMK NucBox M5
AMD Radeon RX Vega 8 (Ryzen 4000/5000), AMD Ryzen 7 5700U
1162 Points -19%
HP Elite Mini 800 G9-5M9X6EA
Intel UHD Graphics 770, Intel Core i5-14500
737 Points -48%
3DMark 11 Performance
6689 баллов
3DMark Cloud Gate Standard Score
20251 баллов
3DMark Fire Strike Score
4527 баллов
3DMark Time Spy Score
1602 баллов
?
Blender
v3.3 Classroom HIP/AMD
Beelink SER6 Pro
AMD Radeon 680M, AMD Ryzen 7 6800H
318 Seconds *
Beelink SER6 Pro Ryzen 7 7735HS
AMD Radeon 680M, AMD Ryzen 7 7735HS
314 Seconds *
v3.3 Classroom OPTIX/RTX
Lenovo ThinkStation P3 Tiny-30H0006AGE
NVIDIA T1000, Intel Core i9-14900
159 Seconds *
v3.3 Classroom CUDA
Lenovo ThinkStation P3 Tiny-30H0006AGE
NVIDIA T1000, Intel Core i9-14900
159 Seconds *
v3.3 Classroom CPU
Beelink SEi11 Pro
Intel Iris Xe Graphics G7 96EUs, Intel Core i5-11320H
995 Seconds * -20%
MSI Cubi NUC 1M
Intel Iris Xe Graphics G7 96EUs, Intel Core 7 150U
829 Seconds *
GMK NucBox M5
AMD Radeon RX Vega 8 (Ryzen 4000/5000), AMD Ryzen 7 5700U
758 Seconds * +9%
Усредн. модель с Intel Iris Xe Graphics G7 96EUs
  (336 - 1259, n=101)
696 Seconds * +16%
GMK NucBox M6
AMD Radeon 660M, AMD Ryzen 5 6600H
497 Seconds * +40%
Beelink SER6 Pro
AMD Radeon 680M, AMD Ryzen 7 6800H
453 Seconds * +45%
Khadas Mind 2
Intel Arc 8-Core iGPU, Intel Core Ultra 7 155H
448 Seconds * +46%
Beelink SER6 Pro Ryzen 7 7735HS
AMD Radeon 680M, AMD Ryzen 7 7735HS
445 Seconds * +46%
GMK NucBox K9
Intel Arc 7-Core iGPU, Intel Core Ultra 5 125H
435 Seconds * +48%
Asus NUC 14 Pro
Intel Arc 7-Core iGPU, Intel Core Ultra 5 125H
399 Seconds * +52%
HP Elite Mini 800 G9-5M9X6EA
Intel UHD Graphics 770, Intel Core i5-14500
396 Seconds * +52%
GMK NucBox K6
AMD Radeon 780M, AMD Ryzen 7 7840HS
327 Seconds * +61%
Geekom AX8 Pro
AMD Radeon 780M, AMD Ryzen 9 8945H
326 Seconds * +61%
Beelink SER8
AMD Radeon 780M, AMD Ryzen 7 8845HS
310 Seconds * +63%
Lenovo ThinkStation P3 Tiny-30H0006AGE
NVIDIA T1000, Intel Core i9-14900
263 Seconds * +68%
v3.3 Classroom oneAPI/Intel
GMK NucBox K9
Intel Arc 7-Core iGPU, Intel Core Ultra 5 125H
308 Seconds *
Khadas Mind 2
Intel Arc 8-Core iGPU, Intel Core Ultra 7 155H
225 Seconds *

* ... меньше = лучше

Performance Rating - Percent
BOSGAME M1 -1!
AMD Ryzen 7 7840HS, AMD Radeon 780M
99.3 pt
Beelink SER8 -1!
AMD Ryzen 7 8845HS, AMD Radeon 780M
97.4 pt
Asus NUC 14 Pro -2!
Intel Core Ultra 5 125H, Intel Arc 7-Core iGPU
83.9 pt
GMK NucBox K9
Intel Core Ultra 5 125H, Intel Arc 7-Core iGPU
80.2 pt
Beelink SEi11 Pro -3!
Intel Core i5-11320H, Intel Iris Xe Graphics G7 96EUs
59.4 pt
MSI Cubi NUC 1M -2!
Intel Core 7 150U, Intel Iris Xe Graphics G7 96EUs
55.5 pt
Baldur's Gate 3 - 1920x1080 Ultra Preset
BOSGAME M1
AMD Ryzen 7 7840HS, AMD Radeon 780M
29.2 fps
Beelink SER8
AMD Ryzen 7 8845HS, AMD Radeon 780M
28 fps
GMK NucBox K9
Intel Core Ultra 5 125H, Intel Arc 7-Core iGPU
23.1 fps
Asus NUC 14 Pro
Intel Core Ultra 5 125H, Intel Arc 7-Core iGPU
21.5 (13.6min, 13.7P0.1, 14.1P1) fps
GTA V - 1920x1080 Highest Settings possible AA:4xMSAA + FX AF:16x
Asus NUC 14 Pro
Intel Core Ultra 5 125H, Intel Arc 7-Core iGPU
16.6 (2.85min, 11.4P1) fps +66%
GMK NucBox K9
Intel Core Ultra 5 125H, Intel Arc 7-Core iGPU
12.7 (2.89min, 8.93P1) fps +27%
MSI Cubi NUC 1M
Intel Core 7 150U, Intel Iris Xe Graphics G7 96EUs
9.98 (4.2min, 6.21P1) fps
Final Fantasy XV Benchmark - 1920x1080 High Quality
BOSGAME M1
AMD Ryzen 7 7840HS, AMD Radeon 780M
30.8 fps +86%
Beelink SER8
AMD Ryzen 7 8845HS, AMD Radeon 780M
29.4 fps +77%
Asus NUC 14 Pro
Intel Core Ultra 5 125H, Intel Arc 7-Core iGPU
25.3 fps +52%
GMK NucBox K9
Intel Core Ultra 5 125H, Intel Arc 7-Core iGPU
22.3 fps +34%
MSI Cubi NUC 1M
Intel Core 7 150U, Intel Iris Xe Graphics G7 96EUs
16.6 fps
Beelink SEi11 Pro
Intel Core i5-11320H, Intel Iris Xe Graphics G7 96EUs
14.9 fps -10%
Strange Brigade - 1920x1080 ultra AA:ultra AF:16
BOSGAME M1
AMD Ryzen 7 7840HS, AMD Radeon 780M
52.1 (5.2min, 33.8P1) fps +107%
Beelink SER8
AMD Ryzen 7 8845HS, AMD Radeon 780M
50.8 (24.5min, 33.9P1) fps +102%
GMK NucBox K9
Intel Core Ultra 5 125H, Intel Arc 7-Core iGPU
43.5 (8.2min, 17.8P1) fps +73%
MSI Cubi NUC 1M
Intel Core 7 150U, Intel Iris Xe Graphics G7 96EUs
25.2 (5.3min, 6.89P1) fps
Beelink SEi11 Pro
Intel Core i5-11320H, Intel Iris Xe Graphics G7 96EUs
22.2 (5.6min, 7.76P1) fps -12%
Dota 2 Reborn - 1920x1080 ultra (3/3) best looking
Beelink SER8
AMD Ryzen 7 8845HS, AMD Radeon 780M
90.4 (71.8min) fps +56%
BOSGAME M1
AMD Ryzen 7 7840HS, AMD Radeon 780M
88.5 (78.9min) fps +53%
GMK NucBox K9
Intel Core Ultra 5 125H, Intel Arc 7-Core iGPU
73.3 (48.5min) fps +27%
Asus NUC 14 Pro
Intel Core Ultra 5 125H, Intel Arc 7-Core iGPU
72.9 (47.2min) fps +26%
MSI Cubi NUC 1M
Intel Core 7 150U, Intel Iris Xe Graphics G7 96EUs
57.8 (39.9min) fps
Beelink SEi11 Pro
Intel Core i5-11320H, Intel Iris Xe Graphics G7 96EUs
47.4 (40.8min) fps -18%
X-Plane 11.11 - 1920x1080 high (fps_test=3)
Beelink SER8
AMD Ryzen 7 8845HS, AMD Radeon 780M
39.6 fps
BOSGAME M1
AMD Ryzen 7 7840HS, AMD Radeon 780M
38.7 fps
Beelink SEi11 Pro
Intel Core i5-11320H, Intel Iris Xe Graphics G7 96EUs
37.3 fps
GMK NucBox K9
Intel Core Ultra 5 125H, Intel Arc 7-Core iGPU
37.3 fps
Asus NUC 14 Pro
Intel Core Ultra 5 125H, Intel Arc 7-Core iGPU
32.9 fps
Far Cry 5 - 1920x1080 Ultra Preset AA:T
BOSGAME M1
AMD Ryzen 7 7840HS, AMD Radeon 780M
47 (41min) fps +96%
Beelink SER8
AMD Ryzen 7 8845HS, AMD Radeon 780M
45 (40min) fps +88%
GMK NucBox K9
Intel Core Ultra 5 125H, Intel Arc 7-Core iGPU
35 (32min) fps +46%
MSI Cubi NUC 1M
Intel Core 7 150U, Intel Iris Xe Graphics G7 96EUs
24 (21min) fps
Tiny Tina's Wonderlands
1280x720 Lowest Preset (DX12)
Lenovo ThinkStation P3 Tiny-30H0006AGE
Intel Core i9-14900, NVIDIA T1000
139.9 fps +269%
GMK NucBox K6
AMD Ryzen 7 7840HS, AMD Radeon 780M
139 fps +267%
Beelink SER8
AMD Ryzen 7 8845HS, AMD Radeon 780M
127.9 fps +237%
GMK NucBox K9
Intel Core Ultra 5 125H, Intel Arc 7-Core iGPU
89 fps +135%
GMK NucBox M6
AMD Ryzen 5 6600H, AMD Radeon 660M
80.8 fps +113%
GMK NucBox M5
AMD Ryzen 7 5700U, AMD Radeon RX Vega 8 (Ryzen 4000/5000)
54.5 fps +44%
Усредн. модель с Intel Iris Xe Graphics G7 96EUs
  (25.9 - 67.3, n=31)
49.4 fps +30%
Lenovo IdeaPad Slim 3i 15IRU9
Intel Core 5 120U, Intel Iris Xe Graphics G7 80EUs
39.2 fps +3%
MSI Cubi NUC 1M
Intel Core 7 150U, Intel Iris Xe Graphics G7 96EUs
37.9 fps
1920x1080 Low Preset (DX12)
GMK NucBox K6
AMD Ryzen 7 7840HS, AMD Radeon 780M
74.6 fps +171%
Beelink SER8
AMD Ryzen 7 8845HS, AMD Radeon 780M
72.8 fps +165%
Lenovo ThinkStation P3 Tiny-30H0006AGE
Intel Core i9-14900, NVIDIA T1000
69.2 fps +152%
Beelink SER6 Pro Ryzen 7 7735HS
AMD Ryzen 7 7735HS, AMD Radeon 680M
58.6 fps +113%
GMK NucBox K9
Intel Core Ultra 5 125H, Intel Arc 7-Core iGPU
50.7 fps +84%
GMK NucBox M6
AMD Ryzen 5 6600H, AMD Radeon 660M
40 fps +45%
Усредн. модель с Intel Iris Xe Graphics G7 96EUs
  (22.3 - 53, n=31)
29.7 fps +8%
MSI Cubi NUC 1M
Intel Core 7 150U, Intel Iris Xe Graphics G7 96EUs
27.5 fps
GMK NucBox M5
AMD Ryzen 7 5700U, AMD Radeon RX Vega 8 (Ryzen 4000/5000)
27.3 fps -1%
Lenovo IdeaPad Slim 3i 15IRU9
Intel Core 5 120U, Intel Iris Xe Graphics G7 80EUs
24.7 fps -10%
1920x1080 Medium Preset (DX12)
Lenovo ThinkStation P3 Tiny-30H0006AGE
Intel Core i9-14900, NVIDIA T1000
55.6 fps +174%
Beelink SER8
AMD Ryzen 7 8845HS, AMD Radeon 780M
52.8 fps +160%
GMK NucBox K6
AMD Ryzen 7 7840HS, AMD Radeon 780M
52.2 fps +157%
Beelink SER6 Pro Ryzen 7 7735HS
AMD Ryzen 7 7735HS, AMD Radeon 680M
44.4 fps +119%
GMK NucBox K9
Intel Core Ultra 5 125H, Intel Arc 7-Core iGPU
39.4 fps +94%
GMK NucBox M6
AMD Ryzen 5 6600H, AMD Radeon 660M
31.3 fps +54%
Усредн. модель с Intel Iris Xe Graphics G7 96EUs
  (17 - 40.1, n=29)
23.4 fps +15%
GMK NucBox M5
AMD Ryzen 7 5700U, AMD Radeon RX Vega 8 (Ryzen 4000/5000)
21.5 fps +6%
MSI Cubi NUC 1M
Intel Core 7 150U, Intel Iris Xe Graphics G7 96EUs
20.3 fps
Lenovo IdeaPad Slim 3i 15IRU9
Intel Core 5 120U, Intel Iris Xe Graphics G7 80EUs
18.8 fps -7%
1920x1080 High Preset (DX12)
Beelink SER8
AMD Ryzen 7 8845HS, AMD Radeon 780M
36.8 fps +163%
GMK NucBox K6
AMD Ryzen 7 7840HS, AMD Radeon 780M
36.6 fps +161%
Lenovo ThinkStation P3 Tiny-30H0006AGE
Intel Core i9-14900, NVIDIA T1000
35.3 fps +152%
Beelink SER6 Pro Ryzen 7 7735HS
AMD Ryzen 7 7735HS, AMD Radeon 680M
29.9 fps +114%
GMK NucBox K9
Intel Core Ultra 5 125H, Intel Arc 7-Core iGPU
26.8 fps +91%
GMK NucBox M6
AMD Ryzen 5 6600H, AMD Radeon 660M
20.5 fps +46%
Усредн. модель с Intel Iris Xe Graphics G7 96EUs
  (10.6 - 24.1, n=28)
15 fps +7%
MSI Cubi NUC 1M
Intel Core 7 150U, Intel Iris Xe Graphics G7 96EUs
14 fps
GMK NucBox M5
AMD Ryzen 7 5700U, AMD Radeon RX Vega 8 (Ryzen 4000/5000)
13.8 fps -1%
Lenovo IdeaPad Slim 3i 15IRU9
Intel Core 5 120U, Intel Iris Xe Graphics G7 80EUs
12.3 fps -12%
1920x1080 Badass Preset (DX12)
Beelink SER8
AMD Ryzen 7 8845HS, AMD Radeon 780M
29.6 fps +172%
GMK NucBox K6
AMD Ryzen 7 7840HS, AMD Radeon 780M
29.5 fps +171%
Lenovo ThinkStation P3 Tiny-30H0006AGE
Intel Core i9-14900, NVIDIA T1000
27.6 fps +153%
Beelink SER6 Pro Ryzen 7 7735HS
AMD Ryzen 7 7735HS, AMD Radeon 680M
23.1 fps +112%
GMK NucBox K9
Intel Core Ultra 5 125H, Intel Arc 7-Core iGPU
22.4 fps +106%
GMK NucBox M6
AMD Ryzen 5 6600H, AMD Radeon 660M
15.6 fps +43%
Усредн. модель с Intel Iris Xe Graphics G7 96EUs
  (8.4 - 18.4, n=25)
11.8 fps +8%
MSI Cubi NUC 1M
Intel Core 7 150U, Intel Iris Xe Graphics G7 96EUs
10.9 fps
GMK NucBox M5
AMD Ryzen 7 5700U, AMD Radeon RX Vega 8 (Ryzen 4000/5000)
10.3 fps -6%
Lenovo IdeaPad Slim 3i 15IRU9
Intel Core 5 120U, Intel Iris Xe Graphics G7 80EUs
9.5 fps -13%
GTA V
1024x768 Lowest Settings possible
Lenovo ThinkStation P3 Tiny-30H0006AGE
Intel Core i9-14900, NVIDIA T1000
187.4 (1.697min, 200P1) fps +87%
Geekom AX8 Pro
AMD Ryzen 9 8945H, AMD Radeon 780M
169.4 (3.69min, 125P1) fps +69%
GMK NucBox K6
AMD Ryzen 7 7840HS, AMD Radeon 780M
163.4 (2.4min, 100P1) fps +63%
Asus NUC 14 Pro
Intel Core Ultra 5 125H, Intel Arc 7-Core iGPU
156.3 (4.92min, 90.9P1) fps +56%
Beelink SER6 Pro
AMD Ryzen 7 6800H, AMD Radeon 680M
152.3 (4.42min, 100P1) fps +52%
Khadas Mind 2
Intel Core Ultra 7 155H, Intel Arc 8-Core iGPU
145.4 (4.75min, 83.3P1) fps +45%
GMK NucBox K9
Intel Core Ultra 5 125H, Intel Arc 7-Core iGPU
143.6 (5.11min, 83.3P1) fps +43%
Geekom XT13 Pro
Intel Core i9-13900H, Intel Iris Xe Graphics G7 96EUs
123.5 (30.5min, 66.7P1) fps +23%
Lenovo IdeaPad Slim 3i 15IRU9
Intel Core 5 120U, Intel Iris Xe Graphics G7 80EUs
103.1 (12.1min, 62.5P1) fps +3%
HP Elite Mini 800 G9-5M9X6EA
Intel Core i5-14500, Intel UHD Graphics 770
102.4 (25.3min, 71.4P1) fps +2%
MSI Cubi NUC 1M
Intel Core 7 150U, Intel Iris Xe Graphics G7 96EUs
100.3 (39.9min, 62.5P1) fps
Усредн. модель с Intel Iris Xe Graphics G7 96EUs
  (52 - 166.4, n=162)
98.5 fps -2%
Beelink SEi11 Pro
Intel Core i5-11320H, Intel Iris Xe Graphics G7 96EUs
94.2 (16.5min, 58.8P1) fps -6%
1920x1080 Lowest Settings possible
Lenovo ThinkStation P3 Tiny-30H0006AGE
Intel Core i9-14900, NVIDIA T1000
187.3 (4.93min, 166.7P1) fps +138%
Asus NUC 14 Pro
Intel Core Ultra 5 125H, Intel Arc 7-Core iGPU
129.8 (58.5min, 90.9P1) fps +65%
Geekom AX8 Pro
AMD Ryzen 9 8945H, AMD Radeon 780M
129.3 (19.9min, 90.9P1) fps +65%
GMK NucBox K6
AMD Ryzen 7 7840HS, AMD Radeon 780M
124.7 (11.8min, 83.3P1) fps +59%
Khadas Mind 2
Intel Core Ultra 7 155H, Intel Arc 8-Core iGPU
121.4 (39.2min, 83.3P1) fps +54%
GMK NucBox K9
Intel Core Ultra 5 125H, Intel Arc 7-Core iGPU
118.7 (7.47min, 83.3P1) fps +51%
Beelink SER6 Pro
AMD Ryzen 7 6800H, AMD Radeon 680M
111.4 (35min, 71.4P1) fps +42%
Geekom XT13 Pro
Intel Core i9-13900H, Intel Iris Xe Graphics G7 96EUs
91.3 (21.4min, 52.6P1) fps +16%
MSI Cubi NUC 1M
Intel Core 7 150U, Intel Iris Xe Graphics G7 96EUs
78.6 (26min, 50P1) fps
Lenovo IdeaPad Slim 3i 15IRU9
Intel Core 5 120U, Intel Iris Xe Graphics G7 80EUs
77.2 (14.6min, 50P1) fps -2%
Усредн. модель с Intel Iris Xe Graphics G7 96EUs
  (34.7 - 132.1, n=136)
73.8 fps -6%
Beelink SEi11 Pro
Intel Core i5-11320H, Intel Iris Xe Graphics G7 96EUs
65.9 (13.2min, 45.5P1) fps -16%
HP Elite Mini 800 G9-5M9X6EA
Intel Core i5-14500, Intel UHD Graphics 770
53.9 (29.4min, 40P1) fps -31%
1366x768 Normal/Off AF:4x
Lenovo ThinkStation P3 Tiny-30H0006AGE
Intel Core i9-14900, NVIDIA T1000
187.1 (1.566min, 200P1) fps +117%
Geekom AX8 Pro
AMD Ryzen 9 8945H, AMD Radeon 780M
158.3 (4.14min, 111.1P1) fps +84%
GMK NucBox K6
AMD Ryzen 7 7840HS, AMD Radeon 780M
153.8 (4.97min, 90.9P1) fps +79%
Asus NUC 14 Pro
Intel Core Ultra 5 125H, Intel Arc 7-Core iGPU
148.8 (4.43min, 83.3P1) fps +73%
Beelink SER6 Pro
AMD Ryzen 7 6800H, AMD Radeon 680M
139.7 (5.95min, 90.9P1) fps +62%
Khadas Mind 2
Intel Core Ultra 7 155H, Intel Arc 8-Core iGPU
131.5 (4.53min, 47.6P1) fps +53%
GMK NucBox K9
Intel Core Ultra 5 125H, Intel Arc 7-Core iGPU
125.5 (15.3min, 76.9P1) fps +46%
Geekom XT13 Pro
Intel Core i9-13900H, Intel Iris Xe Graphics G7 96EUs
105.9 (23.9min, 47.6P1) fps +23%
Lenovo IdeaPad Slim 3i 15IRU9
Intel Core 5 120U, Intel Iris Xe Graphics G7 80EUs
91 (14.4min, 58.8P1) fps +6%
HP Elite Mini 800 G9-5M9X6EA
Intel Core i5-14500, Intel UHD Graphics 770
90.8 (26.7min, 62.5P1) fps +5%
MSI Cubi NUC 1M
Intel Core 7 150U, Intel Iris Xe Graphics G7 96EUs
86.1 (7.7min, 50P1) fps
Усредн. модель с Intel Iris Xe Graphics G7 96EUs
  (24.1 - 149.3, n=165)
83.1 fps -3%
Beelink SEi11 Pro
Intel Core i5-11320H, Intel Iris Xe Graphics G7 96EUs
77.6 (21.9min, 50P1) fps -10%
1920x1080 Normal/Off AF:4x
Lenovo ThinkStation P3 Tiny-30H0006AGE
Intel Core i9-14900, NVIDIA T1000
185.8 (1.693min, 142.9P1) fps +162%
Geekom AX8 Pro
AMD Ryzen 9 8945H, AMD Radeon 780M
132.3 (12min, 90.9P1) fps +86%
GMK NucBox K6
AMD Ryzen 7 7840HS, AMD Radeon 780M
128.7 (21.5min, 76.9P1) fps +81%
Asus NUC 14 Pro
Intel Core Ultra 5 125H, Intel Arc 7-Core iGPU
117.6 (36.7min, 83.3P1) fps +66%
Beelink SER6 Pro
AMD Ryzen 7 6800H, AMD Radeon 680M
110.4 (6.6min, 71.4P1) fps +55%
Khadas Mind 2
Intel Core Ultra 7 155H, Intel Arc 8-Core iGPU
109.8 (7.83min, 50P1) fps +55%
GMK NucBox K9
Intel Core Ultra 5 125H, Intel Arc 7-Core iGPU
95.2 (10.5min, 66.7P1) fps +34%
Geekom XT13 Pro
Intel Core i9-13900H, Intel Iris Xe Graphics G7 96EUs
78.5 (6.01min, 40P1) fps +11%
Lenovo IdeaPad Slim 3i 15IRU9
Intel Core 5 120U, Intel Iris Xe Graphics G7 80EUs
73.3 (17.6min, 45.5P1) fps +3%
MSI Cubi NUC 1M
Intel Core 7 150U, Intel Iris Xe Graphics G7 96EUs
71 (6.44min, 40P1) fps
Усредн. модель с Intel Iris Xe Graphics G7 96EUs
  (20 - 119.3, n=137)
65.2 fps -8%
Beelink SEi11 Pro
Intel Core i5-11320H, Intel Iris Xe Graphics G7 96EUs
57.3 (22.2min, 38.5P1) fps -19%
HP Elite Mini 800 G9-5M9X6EA
Intel Core i5-14500, Intel UHD Graphics 770
53.9 (16min, 38.5P1) fps -24%
1920x1080 High/On (Advanced Graphics Off) AA:2xMSAA + FX AF:8x
Lenovo ThinkStation P3 Tiny-30H0006AGE
Intel Core i9-14900, NVIDIA T1000
103.5 (6.88min, 76.9P1) fps +339%
Geekom AX8 Pro
AMD Ryzen 9 8945H, AMD Radeon 780M
65.9 (2.44min, 41.7P1) fps +179%
GMK NucBox K6
AMD Ryzen 7 7840HS, AMD Radeon 780M
65.7 (3.85min, 40P1) fps +178%
Beelink SER6 Pro
AMD Ryzen 7 6800H, AMD Radeon 680M
51.9 (14.3min, 37P1) fps +120%
Asus NUC 14 Pro
Intel Core Ultra 5 125H, Intel Arc 7-Core iGPU
39.9 (3.1min, 29.4P1) fps +69%
Khadas Mind 2
Intel Core Ultra 7 155H, Intel Arc 8-Core iGPU
35.9 (2.99min, 27P1) fps +52%
GMK NucBox K9
Intel Core Ultra 5 125H, Intel Arc 7-Core iGPU
33.6 (6.68min, 22.7P1) fps +42%
MSI Cubi NUC 1M
Intel Core 7 150U, Intel Iris Xe Graphics G7 96EUs
23.6 (8.96min, 17.2P1) fps
Beelink SEi11 Pro
Intel Core i5-11320H, Intel Iris Xe Graphics G7 96EUs
23.2 (11.5min, 15.9P1) fps -2%
Усредн. модель с Intel Iris Xe Graphics G7 96EUs
  (9.39 - 51.6, n=157)
22.8 fps -3%
Lenovo IdeaPad Slim 3i 15IRU9
Intel Core 5 120U, Intel Iris Xe Graphics G7 80EUs
22.3 (8.86min, 15.9P1) fps -6%
Geekom XT13 Pro
Intel Core i9-13900H, Intel Iris Xe Graphics G7 96EUs
22.1 (7.08min, 16.4P1) fps -6%
HP Elite Mini 800 G9-5M9X6EA
Intel Core i5-14500, Intel UHD Graphics 770
12.3 (4.52min, 9.35P1) fps -48%
1920x1080 Highest Settings possible AA:4xMSAA + FX AF:16x
Lenovo ThinkStation P3 Tiny-30H0006AGE
Intel Core i9-14900, NVIDIA T1000
50.2 (6.23min, 34.5P1) fps +403%
Geekom AX8 Pro
AMD Ryzen 9 8945H, AMD Radeon 780M
27.7 (13.2min, 18.2P1) fps +178%
GMK NucBox K6
AMD Ryzen 7 7840HS, AMD Radeon 780M
26 (2.62min, 17.5P1) fps +161%
Beelink SER6 Pro
AMD Ryzen 7 6800H, AMD Radeon 680M
23.7 (9.52min, 16.4P1) fps +137%
Asus NUC 14 Pro
Intel Core Ultra 5 125H, Intel Arc 7-Core iGPU
16.6 (2.85min, 11.4P1) fps +66%
Khadas Mind 2
Intel Core Ultra 7 155H, Intel Arc 8-Core iGPU
13.9 (2.71min, 10.6P1) fps +39%
GMK NucBox K9
Intel Core Ultra 5 125H, Intel Arc 7-Core iGPU
12.7 (2.89min, 8.93P1) fps +27%
MSI Cubi NUC 1M
Intel Core 7 150U, Intel Iris Xe Graphics G7 96EUs
9.98 (4.2min, 6.21P1) fps
Lenovo IdeaPad Slim 3i 15IRU9
Intel Core 5 120U, Intel Iris Xe Graphics G7 80EUs
9.55 (4.54min, 5.43P1) fps -4%
Усредн. модель с Intel Iris Xe Graphics G7 96EUs
  (4.13 - 22.9, n=151)
9.48 fps -5%
Geekom XT13 Pro
Intel Core i9-13900H, Intel Iris Xe Graphics G7 96EUs
9 (3.72min, 7.14P1) fps -10%
HP Elite Mini 800 G9-5M9X6EA
Intel Core i5-14500, Intel UHD Graphics 770
5.34 (2.38min, 2.94P1) fps -46%
Final Fantasy XV Benchmark
1280x720 Lite Quality
Lenovo ThinkStation P3 Tiny-30H0006AGE
Intel Core i9-14900, NVIDIA T1000
101.3 fps +148%
GMK NucBox K6
AMD Ryzen 7 7840HS, AMD Radeon 780M
80.8 fps +98%
Beelink SER8
AMD Ryzen 7 8845HS, AMD Radeon 780M
79.7 fps +95%
Geekom AX8 Pro
AMD Ryzen 9 8945H, AMD Radeon 780M
77.9 fps +90%
Beelink SER6 Pro
AMD Ryzen 7 6800H, AMD Radeon 680M
68.1 fps +67%
Khadas Mind 2
Intel Core Ultra 7 155H, Intel Arc 8-Core iGPU
64.8 fps +58%
Beelink SER6 Pro Ryzen 7 7735HS
AMD Ryzen 7 7735HS, AMD Radeon 680M
62.2 fps +52%
Asus NUC 14 Pro
Intel Core Ultra 5 125H, Intel Arc 7-Core iGPU
60.6 fps +48%
GMK NucBox K9
Intel Core Ultra 5 125H, Intel Arc 7-Core iGPU
59.6 fps +46%
GMK NucBox M6
AMD Ryzen 5 6600H, AMD Radeon 660M
48.3 fps +18%
Geekom XT13 Pro
Intel Core i9-13900H, Intel Iris Xe Graphics G7 96EUs
46 fps +12%
MSI Cubi NUC 1M
Intel Core 7 150U, Intel Iris Xe Graphics G7 96EUs
40.9 fps
Усредн. модель с Intel Iris Xe Graphics G7 96EUs
  (14.9 - 56.5, n=183)
39.4 fps -4%
Beelink SEi11 Pro
Intel Core i5-11320H, Intel Iris Xe Graphics G7 96EUs
38.6 fps -6%
Lenovo IdeaPad Slim 3i 15IRU9
Intel Core 5 120U, Intel Iris Xe Graphics G7 80EUs
37.7 fps -8%
GMK NucBox M5
AMD Ryzen 7 5700U, AMD Radeon RX Vega 8 (Ryzen 4000/5000)
35.2 fps -14%
HP Elite Mini 800 G9-5M9X6EA
Intel Core i5-14500, Intel UHD Graphics 770
26.2 fps -36%
1920x1080 Standard Quality
Lenovo ThinkStation P3 Tiny-30H0006AGE
Intel Core i9-14900, NVIDIA T1000
49.3 fps +114%
Beelink SER8
AMD Ryzen 7 8845HS, AMD Radeon 780M
40.2 fps +75%
GMK NucBox K6
AMD Ryzen 7 7840HS, AMD Radeon 780M
39.3 fps +71%
Geekom AX8 Pro
AMD Ryzen 9 8945H, AMD Radeon 780M
38.8 fps +69%
Khadas Mind 2
Intel Core Ultra 7 155H, Intel Arc 8-Core iGPU
37 fps +61%
Asus NUC 14 Pro
Intel Core Ultra 5 125H, Intel Arc 7-Core iGPU
35.4 fps +54%
Beelink SER6 Pro
AMD Ryzen 7 6800H, AMD Radeon 680M
34.7 fps +51%
GMK NucBox K9
Intel Core Ultra 5 125H, Intel Arc 7-Core iGPU
33.3 fps +45%
Beelink SER6 Pro Ryzen 7 7735HS
AMD Ryzen 7 7735HS, AMD Radeon 680M
33 fps +43%
Geekom XT13 Pro
Intel Core i9-13900H, Intel Iris Xe Graphics G7 96EUs
25.7 fps +12%
GMK NucBox M6
AMD Ryzen 5 6600H, AMD Radeon 660M
24.7 fps +7%
MSI Cubi NUC 1M
Intel Core 7 150U, Intel Iris Xe Graphics G7 96EUs
23 fps
Усредн. модель с Intel Iris Xe Graphics G7 96EUs
  (10.5 - 31.2, n=179)
21.8 fps -5%
Lenovo IdeaPad Slim 3i 15IRU9
Intel Core 5 120U, Intel Iris Xe Graphics G7 80EUs
20.6 fps -10%
Beelink SEi11 Pro
Intel Core i5-11320H, Intel Iris Xe Graphics G7 96EUs
20.3 fps -12%
GMK NucBox M5
AMD Ryzen 7 5700U, AMD Radeon RX Vega 8 (Ryzen 4000/5000)
18 fps -22%
HP Elite Mini 800 G9-5M9X6EA
Intel Core i5-14500, Intel UHD Graphics 770
14.3 fps -38%
1920x1080 High Quality
Lenovo ThinkStation P3 Tiny-30H0006AGE
Intel Core i9-14900, NVIDIA T1000
36.2 fps +118%
Beelink SER8
AMD Ryzen 7 8845HS, AMD Radeon 780M
29.4 fps +77%
GMK NucBox K6
AMD Ryzen 7 7840HS, AMD Radeon 780M
29.3 fps +77%
Geekom AX8 Pro
AMD Ryzen 9 8945H, AMD Radeon 780M
28.5 fps +72%
Khadas Mind 2
Intel Core Ultra 7 155H, Intel Arc 8-Core iGPU
26.1 fps +57%
Asus NUC 14 Pro
Intel Core Ultra 5 125H, Intel Arc 7-Core iGPU
25.3 fps +52%
Beelink SER6 Pro Ryzen 7 7735HS
AMD Ryzen 7 7735HS, AMD Radeon 680M
24.7 fps +49%
Beelink SER6 Pro
AMD Ryzen 7 6800H, AMD Radeon 680M
24.6 fps +48%
GMK NucBox K9
Intel Core Ultra 5 125H, Intel Arc 7-Core iGPU
22.3 fps +34%
Geekom XT13 Pro
Intel Core i9-13900H, Intel Iris Xe Graphics G7 96EUs
18.2 fps +10%
GMK NucBox M6
AMD Ryzen 5 6600H, AMD Radeon 660M
17.9 fps +8%
Усредн. модель с Intel Iris Xe Graphics G7 96EUs
  (8.15 - 27.8, n=172)
16.8 fps +1%
MSI Cubi NUC 1M
Intel Core 7 150U, Intel Iris Xe Graphics G7 96EUs
16.6 fps
Beelink SEi11 Pro
Intel Core i5-11320H, Intel Iris Xe Graphics G7 96EUs
14.9 fps -10%
Lenovo IdeaPad Slim 3i 15IRU9
Intel Core 5 120U, Intel Iris Xe Graphics G7 80EUs
14.8 fps -11%
GMK NucBox M5
AMD Ryzen 7 5700U, AMD Radeon RX Vega 8 (Ryzen 4000/5000)
13.1 fps -21%
HP Elite Mini 800 G9-5M9X6EA
Intel Core i5-14500, Intel UHD Graphics 770
9.38 fps -43%
Dota 2 Reborn
1280x720 min (0/3) fastest
Lenovo ThinkStation P3 Tiny-30H0006AGE
Intel Core i9-14900, NVIDIA T1000
246.2 (207.1min) fps +152%
GMK NucBox K6
AMD Ryzen 7 7840HS, AMD Radeon 780M
161.2 (11.9min) fps +65%
Geekom AX8 Pro
AMD Ryzen 9 8945H, AMD Radeon 780M
157.5 (136min) fps +61%
Beelink SER8
AMD Ryzen 7 8845HS, AMD Radeon 780M
151.9 (101.9min) fps +55%
GMK NucBox M6
AMD Ryzen 5 6600H, AMD Radeon 660M
144.9 (123.5min) fps +48%
Beelink SER6 Pro
AMD Ryzen 7 6800H, AMD Radeon 680M
143.3 (123.8min) fps +47%
Beelink SER6 Pro Ryzen 7 7735HS
AMD Ryzen 7 7735HS, AMD Radeon 680M
142.2 (123.6min) fps +46%
Beelink SEi11 Pro
Intel Core i5-11320H, Intel Iris Xe Graphics G7 96EUs
119.6 (108.4min) fps +22%
Geekom XT13 Pro
Intel Core i9-13900H, Intel Iris Xe Graphics G7 96EUs
117.2 (74.5min) fps +20%
HP Elite Mini 800 G9-5M9X6EA
Intel Core i5-14500, Intel UHD Graphics 770
105.8 (73.2min) fps +8%
Lenovo IdeaPad Slim 3i 15IRU9
Intel Core 5 120U, Intel Iris Xe Graphics G7 80EUs
105 (80.8min) fps +7%
Khadas Mind 2
Intel Core Ultra 7 155H, Intel Arc 8-Core iGPU
101.5 (54.9min) fps +4%
Усредн. модель с Intel Iris Xe Graphics G7 96EUs
  (36 - 148, n=215)
100.3 fps +3%
GMK NucBox M5
AMD Ryzen 7 5700U, AMD Radeon RX Vega 8 (Ryzen 4000/5000)
99.7 (85.3min) fps +2%
GMK NucBox K9
Intel Core Ultra 5 125H, Intel Arc 7-Core iGPU
97.7 (67.3min) fps 0%
MSI Cubi NUC 1M
Intel Core 7 150U, Intel Iris Xe Graphics G7 96EUs
97.7 (57.3min) fps
Asus NUC 14 Pro
Intel Core Ultra 5 125H, Intel Arc 7-Core iGPU
97.1 (61.8min) fps -1%
1366x768 med (1/3)
Lenovo ThinkStation P3 Tiny-30H0006AGE
Intel Core i9-14900, NVIDIA T1000
217.7 (183.7min) fps +252%
Beelink SER8
AMD Ryzen 7 8845HS, AMD Radeon 780M
130.1 (91.5min) fps +110%
GMK NucBox K6
AMD Ryzen 7 7840HS, AMD Radeon 780M
124.8 (104.5min) fps +102%
Geekom AX8 Pro
AMD Ryzen 9 8945H, AMD Radeon 780M
116.1 (93.2min) fps +88%
Beelink SER6 Pro Ryzen 7 7735HS
AMD Ryzen 7 7735HS, AMD Radeon 680M
113.5 (96.1min) fps +83%
Beelink SER6 Pro
AMD Ryzen 7 6800H, AMD Radeon 680M
113.4 (94min) fps +83%
GMK NucBox M6
AMD Ryzen 5 6600H, AMD Radeon 660M
107.9 (92.8min) fps +74%
GMK NucBox K9
Intel Core Ultra 5 125H, Intel Arc 7-Core iGPU
83.1 (60.5min) fps +34%
Geekom XT13 Pro
Intel Core i9-13900H, Intel Iris Xe Graphics G7 96EUs
82.9 (52.4min) fps +34%
GMK NucBox M5
AMD Ryzen 7 5700U, AMD Radeon RX Vega 8 (Ryzen 4000/5000)
80.6 (61.8min) fps +30%
Asus NUC 14 Pro
Intel Core Ultra 5 125H, Intel Arc 7-Core iGPU
79.2 (57.5min) fps +28%
Beelink SEi11 Pro
Intel Core i5-11320H, Intel Iris Xe Graphics G7 96EUs
78.6 (66.2min) fps +27%
HP Elite Mini 800 G9-5M9X6EA
Intel Core i5-14500, Intel UHD Graphics 770
78.4 (32.1min) fps +27%
Lenovo IdeaPad Slim 3i 15IRU9
Intel Core 5 120U, Intel Iris Xe Graphics G7 80EUs
76.5 (59min) fps +24%
Усредн. модель с Intel Iris Xe Graphics G7 96EUs
  (31.6 - 108.5, n=215)
75.7 fps +22%
MSI Cubi NUC 1M
Intel Core 7 150U, Intel Iris Xe Graphics G7 96EUs
61.9 (45.9min) fps
Khadas Mind 2
Intel Core Ultra 7 155H, Intel Arc 8-Core iGPU
54.2 (30.3min) fps -12%
1920x1080 high (2/3)
Lenovo ThinkStation P3 Tiny-30H0006AGE
Intel Core i9-14900, NVIDIA T1000
150.4 (134.4min) fps +141%
Beelink SER8
AMD Ryzen 7 8845HS, AMD Radeon 780M
98.8 (80.5min) fps +58%
GMK NucBox K6
AMD Ryzen 7 7840HS, AMD Radeon 780M
96.8 (17.4min) fps +55%
Beelink SER6 Pro Ryzen 7 7735HS
AMD Ryzen 7 7735HS, AMD Radeon 680M
89.1 (74.5min) fps +43%
Geekom AX8 Pro
AMD Ryzen 9 8945H, AMD Radeon 780M
88 (69.2min) fps +41%
Beelink SER6 Pro
AMD Ryzen 7 6800H, AMD Radeon 680M
83.9 (73.4min) fps +34%
Asus NUC 14 Pro
Intel Core Ultra 5 125H, Intel Arc 7-Core iGPU
75.9 (45.7min) fps +21%
GMK NucBox K9
Intel Core Ultra 5 125H, Intel Arc 7-Core iGPU
75.6 (48.6min) fps +21%
Geekom XT13 Pro
Intel Core i9-13900H, Intel Iris Xe Graphics G7 96EUs
72.5 (53min) fps +16%
GMK NucBox M6
AMD Ryzen 5 6600H, AMD Radeon 660M
70 (63.6min) fps +12%
MSI Cubi NUC 1M
Intel Core 7 150U, Intel Iris Xe Graphics G7 96EUs
62.5 (42.1min) fps
Lenovo IdeaPad Slim 3i 15IRU9
Intel Core 5 120U, Intel Iris Xe Graphics G7 80EUs
57.2 (49.2min) fps -8%
Усредн. модель с Intel Iris Xe Graphics G7 96EUs
  (23.2 - 88.1, n=215)
54.2 fps -13%
GMK NucBox M5
AMD Ryzen 7 5700U, AMD Radeon RX Vega 8 (Ryzen 4000/5000)
50.5 (43.1min) fps -19%
Beelink SEi11 Pro
Intel Core i5-11320H, Intel Iris Xe Graphics G7 96EUs
50.4 (41.9min) fps -19%
Khadas Mind 2
Intel Core Ultra 7 155H, Intel Arc 8-Core iGPU
47 (29min) fps -25%
HP Elite Mini 800 G9-5M9X6EA
Intel Core i5-14500, Intel UHD Graphics 770
43.9 (24.2min) fps -30%
1920x1080 ultra (3/3) best looking
Lenovo ThinkStation P3 Tiny-30H0006AGE
Intel Core i9-14900, NVIDIA T1000
136.5 (120.3min) fps +136%
Beelink SER8
AMD Ryzen 7 8845HS, AMD Radeon 780M
90.4 (71.8min) fps +56%
GMK NucBox K6
AMD Ryzen 7 7840HS, AMD Radeon 780M
87.4 (16.1min) fps +51%
Geekom AX8 Pro
AMD Ryzen 9 8945H, AMD Radeon 780M
81.2 (64.4min) fps +40%
GMK NucBox K9
Intel Core Ultra 5 125H, Intel Arc 7-Core iGPU
73.3 (48.5min) fps +27%
Beelink SER6 Pro
AMD Ryzen 7 6800H, AMD Radeon 680M
73.1 (64min) fps +26%
Asus NUC 14 Pro
Intel Core Ultra 5 125H, Intel Arc 7-Core iGPU
72.9 (47.2min) fps +26%
Beelink SER6 Pro Ryzen 7 7735HS
AMD Ryzen 7 7735HS, AMD Radeon 680M
72.8 (65.3min) fps +26%
Geekom XT13 Pro
Intel Core i9-13900H, Intel Iris Xe Graphics G7 96EUs
66.5 (50.4min) fps +15%
GMK NucBox M6
AMD Ryzen 5 6600H, AMD Radeon 660M
60.8 (54.4min) fps +5%
MSI Cubi NUC 1M
Intel Core 7 150U, Intel Iris Xe Graphics G7 96EUs
57.8 (39.9min) fps
Lenovo IdeaPad Slim 3i 15IRU9
Intel Core 5 120U, Intel Iris Xe Graphics G7 80EUs
51.9 (44.8min) fps -10%
Усредн. модель с Intel Iris Xe Graphics G7 96EUs
  (20.6 - 78.5, n=215)
49.4 fps -15%
GMK NucBox M5
AMD Ryzen 7 5700U, AMD Radeon RX Vega 8 (Ryzen 4000/5000)
47.6 (40.4min) fps -18%
Beelink SEi11 Pro
Intel Core i5-11320H, Intel Iris Xe Graphics G7 96EUs
47.4 (40.8min) fps -18%
Khadas Mind 2
Intel Core Ultra 7 155H, Intel Arc 8-Core iGPU
41.8 (27.6min) fps -28%
HP Elite Mini 800 G9-5M9X6EA
Intel Core i5-14500, Intel UHD Graphics 770
40.7 (22.6min) fps -30%
Far Cry 5
1280x720 Low Preset AA:T
Lenovo ThinkStation P3 Tiny-30H0006AGE
Intel Core i9-14900, NVIDIA T1000
127 (102min) fps +159%
Beelink SER8
AMD Ryzen 7 8845HS, AMD Radeon 780M
89 (77min) fps +82%
GMK NucBox K6
AMD Ryzen 7 7840HS, AMD Radeon 780M
86 (75min) fps +76%
GMK NucBox M6
AMD Ryzen 5 6600H, AMD Radeon 660M
71 (62min) fps +45%
GMK NucBox K9
Intel Core Ultra 5 125H, Intel Arc 7-Core iGPU
71 (63min) fps +45%
MSI Cubi NUC 1M
Intel Core 7 150U, Intel Iris Xe Graphics G7 96EUs
49 (43min) fps
Усредн. модель с Intel Iris Xe Graphics G7 96EUs
  (23 - 75, n=92)
46.5 fps -5%
GMK NucBox M5
AMD Ryzen 7 5700U, AMD Radeon RX Vega 8 (Ryzen 4000/5000)
42 (36min) fps -14%
Lenovo IdeaPad Slim 3i 15IRU9
Intel Core 5 120U, Intel Iris Xe Graphics G7 80EUs
42 (31min) fps -14%
1920x1080 Medium Preset AA:T
Lenovo ThinkStation P3 Tiny-30H0006AGE
Intel Core i9-14900, NVIDIA T1000
62 (53min) fps +121%
Beelink SER8
AMD Ryzen 7 8845HS, AMD Radeon 780M
51 (45min) fps +82%
GMK NucBox K6
AMD Ryzen 7 7840HS, AMD Radeon 780M
49 (44min) fps +75%
GMK NucBox K9
Intel Core Ultra 5 125H, Intel Arc 7-Core iGPU
40 (37min) fps +43%
GMK NucBox M6
AMD Ryzen 5 6600H, AMD Radeon 660M
33 (29min) fps +18%
MSI Cubi NUC 1M
Intel Core 7 150U, Intel Iris Xe Graphics G7 96EUs
28 (24min) fps
Усредн. модель с Intel Iris Xe Graphics G7 96EUs
  (14 - 39, n=90)
25.5 fps -9%
Lenovo IdeaPad Slim 3i 15IRU9
Intel Core 5 120U, Intel Iris Xe Graphics G7 80EUs
24 (22min) fps -14%
GMK NucBox M5
AMD Ryzen 7 5700U, AMD Radeon RX Vega 8 (Ryzen 4000/5000)
20 (17min) fps -29%
1920x1080 High Preset AA:T
Lenovo ThinkStation P3 Tiny-30H0006AGE
Intel Core i9-14900, NVIDIA T1000
57 (48min) fps +119%
Beelink SER8
AMD Ryzen 7 8845HS, AMD Radeon 780M
47 (42min) fps +81%
GMK NucBox K6
AMD Ryzen 7 7840HS, AMD Radeon 780M
45 (41min) fps +73%
GMK NucBox K9
Intel Core Ultra 5 125H, Intel Arc 7-Core iGPU
37 (34min) fps +42%
GMK NucBox M6
AMD Ryzen 5 6600H, AMD Radeon 660M
30 (26min) fps +15%
MSI Cubi NUC 1M
Intel Core 7 150U, Intel Iris Xe Graphics G7 96EUs
26 (22min) fps
Усредн. модель с Intel Iris Xe Graphics G7 96EUs
  (10 - 35, n=88)
23.8 fps -8%
Lenovo IdeaPad Slim 3i 15IRU9
Intel Core 5 120U, Intel Iris Xe Graphics G7 80EUs
23 (20min) fps -12%
GMK NucBox M5
AMD Ryzen 7 5700U, AMD Radeon RX Vega 8 (Ryzen 4000/5000)
19 (16min) fps -27%
1920x1080 Ultra Preset AA:T
Lenovo ThinkStation P3 Tiny-30H0006AGE
Intel Core i9-14900, NVIDIA T1000
53 (46min) fps +121%
Beelink SER8
AMD Ryzen 7 8845HS, AMD Radeon 780M
45 (40min) fps +88%
GMK NucBox K6
AMD Ryzen 7 7840HS, AMD Radeon 780M
43 (38min) fps +79%
GMK NucBox K9
Intel Core Ultra 5 125H, Intel Arc 7-Core iGPU
35 (32min) fps +46%
GMK NucBox M6
AMD Ryzen 5 6600H, AMD Radeon 660M
27 (20min) fps +13%
MSI Cubi NUC 1M
Intel Core 7 150U, Intel Iris Xe Graphics G7 96EUs
24 (21min) fps
Усредн. модель с Intel Iris Xe Graphics G7 96EUs
  (11 - 33, n=74)
22.6 fps -6%
Lenovo IdeaPad Slim 3i 15IRU9
Intel Core 5 120U, Intel Iris Xe Graphics G7 80EUs
21 (19min) fps -12%
GMK NucBox M5
AMD Ryzen 7 5700U, AMD Radeon RX Vega 8 (Ryzen 4000/5000)
17 (15min) fps -29%
F1 22
1280x720 Ultra Low Preset AA:T AF:16x
GMK NucBox K6
AMD Ryzen 7 7840HS, AMD Radeon 780M
170 (137min, 113P1) fps +137%
Beelink SER8
AMD Ryzen 7 8845HS, AMD Radeon 780M
145.7 (108min, 89P1) fps +103%
Beelink SER6 Pro Ryzen 7 7735HS
AMD Ryzen 7 7735HS, AMD Radeon 680M
141.3 (116min, 93P1) fps +97%
GMK NucBox K9
Intel Core Ultra 5 125H, Intel Arc 7-Core iGPU
130.2 (112min, 96P1) fps +81%
GMK NucBox M6
AMD Ryzen 5 6600H, AMD Radeon 660M
107.3 (86min, 79P1) fps +49%
Усредн. модель с Intel Iris Xe Graphics G7 96EUs
  (57.4 - 94.6, n=52)
75.8 fps +6%
MSI Cubi NUC 1M
Intel Core 7 150U, Intel Iris Xe Graphics G7 96EUs
71.8 (51min, 58P1) fps
Lenovo IdeaPad Slim 3i 15IRU9
Intel Core 5 120U, Intel Iris Xe Graphics G7 80EUs
67.7 (48min, 54P1) fps -6%
GMK NucBox M5
AMD Ryzen 7 5700U, AMD Radeon RX Vega 8 (Ryzen 4000/5000)
64.5 (55min, 54P1) fps -10%
1920x1080 Low Preset AA:T AF:16x
GMK NucBox K6
AMD Ryzen 7 7840HS, AMD Radeon 780M
99.8 (12min, 70P1) fps +136%
Beelink SER8
AMD Ryzen 7 8845HS, AMD Radeon 780M
99 (86min, 76P1) fps +134%
Beelink SER6 Pro Ryzen 7 7735HS
AMD Ryzen 7 7735HS, AMD Radeon 680M
80.1 (69min, 55P1) fps +89%
GMK NucBox K9
Intel Core Ultra 5 125H, Intel Arc 7-Core iGPU
79.4 (63min, 66P1) fps +88%
GMK NucBox M6
AMD Ryzen 5 6600H, AMD Radeon 660M
58.3 (43min, 42P1) fps +38%
Усредн. модель с Intel Iris Xe Graphics G7 96EUs
  (33.3 - 57.2, n=57)
44.6 fps +5%
MSI Cubi NUC 1M
Intel Core 7 150U, Intel Iris Xe Graphics G7 96EUs
42.3 (35min, 32P1) fps
Lenovo IdeaPad Slim 3i 15IRU9
Intel Core 5 120U, Intel Iris Xe Graphics G7 80EUs
40.1 (33min, 32P1) fps -5%
GMK NucBox M5
AMD Ryzen 7 5700U, AMD Radeon RX Vega 8 (Ryzen 4000/5000)
35.7 (31min, 27P1) fps -16%
1920x1080 Medium Preset AA:T AF:16x
GMK NucBox K6
AMD Ryzen 7 7840HS, AMD Radeon 780M
85.9 (67min, 59P1) fps +125%
Beelink SER8
AMD Ryzen 7 8845HS, AMD Radeon 780M
85.9 (73min, 68P1) fps +125%
GMK NucBox K9
Intel Core Ultra 5 125H, Intel Arc 7-Core iGPU
71.9 (61min, 59P1) fps +88%
Beelink SER6 Pro Ryzen 7 7735HS
AMD Ryzen 7 7735HS, AMD Radeon 680M
69.5 (57min, 49P1) fps +82%
GMK NucBox M6
AMD Ryzen 5 6600H, AMD Radeon 660M
52.3 (41min, 39P1) fps +37%
Усредн. модель с Intel Iris Xe Graphics G7 96EUs
  (28 - 52.3, n=57)
40.3 fps +5%
MSI Cubi NUC 1M
Intel Core 7 150U, Intel Iris Xe Graphics G7 96EUs
38.2 (32min, 31P1) fps
Lenovo IdeaPad Slim 3i 15IRU9
Intel Core 5 120U, Intel Iris Xe Graphics G7 80EUs
35 (30min, 29P1) fps -8%
GMK NucBox M5
AMD Ryzen 7 5700U, AMD Radeon RX Vega 8 (Ryzen 4000/5000)
32.3 (28min, 25P1) fps -15%
1920x1080 High Preset AA:T AF:16x
GMK NucBox K6
AMD Ryzen 7 7840HS, AMD Radeon 780M
66.7 (53min, 36P1) fps +136%
Beelink SER8
AMD Ryzen 7 8845HS, AMD Radeon 780M
65.6 (54min, 52P1) fps +132%
Beelink SER6 Pro Ryzen 7 7735HS
AMD Ryzen 7 7735HS, AMD Radeon 680M
52.9 (43min, 38P1) fps +87%
GMK NucBox K9
Intel Core Ultra 5 125H, Intel Arc 7-Core iGPU
52.9 (46min, 45P1) fps +87%
GMK NucBox M6
AMD Ryzen 5 6600H, AMD Radeon 660M
37.2 (31min, 29P1) fps +31%
Усредн. модель с Intel Iris Xe Graphics G7 96EUs
  (21.7 - 37.1, n=57)
29.2 fps +3%
MSI Cubi NUC 1M
Intel Core 7 150U, Intel Iris Xe Graphics G7 96EUs
28.3 (24min, 22P1) fps
Lenovo IdeaPad Slim 3i 15IRU9
Intel Core 5 120U, Intel Iris Xe Graphics G7 80EUs
25.9 (22min, 21P1) fps -8%
GMK NucBox M5
AMD Ryzen 7 5700U, AMD Radeon RX Vega 8 (Ryzen 4000/5000)
23.8 (20min, 18P1) fps -16%
1920x1080 Ultra High Preset AA:T AF:16x
Усредн. модель с Intel Iris Xe Graphics G7 96EUs
  (16.1 - 28, n=48)
22.2 fps +4%
MSI Cubi NUC 1M
Intel Core 7 150U, Intel Iris Xe Graphics G7 96EUs
21.4 (17min, 16P1) fps
Lenovo IdeaPad Slim 3i 15IRU9
Intel Core 5 120U, Intel Iris Xe Graphics G7 80EUs
19.4 (16min, 15P1) fps -9%
GMK NucBox K6
AMD Ryzen 7 7840HS, AMD Radeon 780M
18.4 (12min, 12P1) fps -14%
Beelink SER8
AMD Ryzen 7 8845HS, AMD Radeon 780M
17.9 (13min, 13P1) fps -16%
GMK NucBox M5
AMD Ryzen 7 5700U, AMD Radeon RX Vega 8 (Ryzen 4000/5000)
16.8 (13min, 13P1) fps -21%
Beelink SER6 Pro Ryzen 7 7735HS
AMD Ryzen 7 7735HS, AMD Radeon 680M
13.9 (10min, 9P1) fps -35%
GMK NucBox M6
AMD Ryzen 5 6600H, AMD Radeon 660M
8.43 (6min, 6P1) fps -61%
Cyberpunk 2077 2.1 Phantom Liberty
1280x720 Low Preset (FSR off)
GMK NucBox K6
AMD Ryzen 7 7840HS, AMD Radeon 780M
77.4 (28.7min) fps +204%
Lenovo ThinkStation P3 Tiny-30H0006AGE
Intel Core i9-14900, NVIDIA T1000
77.1 (60.4min) fps +202%
Beelink SER8
AMD Ryzen 7 8845HS, AMD Radeon 780M
72.6 (60.1min) fps +185%
Geekom AX8 Pro
AMD Ryzen 9 8945H, AMD Radeon 780M
69 (56.9min) fps +171%
Khadas Mind 2
Intel Core Ultra 7 155H, Intel Arc 8-Core iGPU
50.5 (42.1min) fps +98%
GMK NucBox K9
Intel Core Ultra 5 125H, Intel Arc 7-Core iGPU
46.4 (37.7min) fps +82%
Asus NUC 14 Pro
Intel Core Ultra 5 125H, Intel Arc 7-Core iGPU
46.3 (39.2min) fps +82%
Geekom XT13 Pro
Intel Core i9-13900H, Intel Iris Xe Graphics G7 96EUs
31.8 (24.6min) fps +25%
Усредн. модель с Intel Iris Xe Graphics G7 96EUs
  (21.4 - 37.3, n=12)
28.9 fps +13%
MSI Cubi NUC 1M
Intel Core 7 150U, Intel Iris Xe Graphics G7 96EUs
25.5 (19.8min) fps
Lenovo IdeaPad Slim 3i 15IRU9
Intel Core 5 120U, Intel Iris Xe Graphics G7 80EUs
25.3 (19.5min) fps -1%
GMK NucBox M5
AMD Ryzen 7 5700U, AMD Radeon RX Vega 8 (Ryzen 4000/5000)
24.4 (12.7min) fps -4%
HP Elite Mini 800 G9-5M9X6EA
Intel Core i5-14500, Intel UHD Graphics 770
15.1 (4.01min) fps -41%
1920x1080 Low Preset (FSR off)
GMK NucBox K6
AMD Ryzen 7 7840HS, AMD Radeon 780M
46.3 (32.3min) fps +201%
Lenovo ThinkStation P3 Tiny-30H0006AGE
Intel Core i9-14900, NVIDIA T1000
45.1 (36.7min) fps +193%
Beelink SER8
AMD Ryzen 7 8845HS, AMD Radeon 780M
43.8 (37.3min) fps +184%
Geekom AX8 Pro
AMD Ryzen 9 8945H, AMD Radeon 780M
41.3 (34.5min) fps +168%
Khadas Mind 2
Intel Core Ultra 7 155H, Intel Arc 8-Core iGPU
33.9 (29.4min) fps +120%
GMK NucBox K9
Intel Core Ultra 5 125H, Intel Arc 7-Core iGPU
30.9 (24.8min) fps +101%
Asus NUC 14 Pro
Intel Core Ultra 5 125H, Intel Arc 7-Core iGPU
30.1 (25.8min) fps +95%
GMK NucBox M6
AMD Ryzen 5 6600H, AMD Radeon 660M
24.3 (20.5min) fps +58%
Geekom XT13 Pro
Intel Core i9-13900H, Intel Iris Xe Graphics G7 96EUs
18.6 (15.4min) fps +21%
Усредн. модель с Intel Iris Xe Graphics G7 96EUs
  (13.1 - 22.5, n=12)
17.3 fps +12%
MSI Cubi NUC 1M
Intel Core 7 150U, Intel Iris Xe Graphics G7 96EUs
15.4 (12.1min) fps
Lenovo IdeaPad Slim 3i 15IRU9
Intel Core 5 120U, Intel Iris Xe Graphics G7 80EUs
14.9 (11.6min) fps -3%
GMK NucBox M5
AMD Ryzen 7 5700U, AMD Radeon RX Vega 8 (Ryzen 4000/5000)
13.8 (6.57min) fps -10%
HP Elite Mini 800 G9-5M9X6EA
Intel Core i5-14500, Intel UHD Graphics 770
9.13 (7.04min) fps -41%
1920x1080 Medium Preset (FSR off)
GMK NucBox K6
AMD Ryzen 7 7840HS, AMD Radeon 780M
35.2 (10.9min) fps +184%
Beelink SER8
AMD Ryzen 7 8845HS, AMD Radeon 780M
34.5 (29.8min) fps +178%
Lenovo ThinkStation P3 Tiny-30H0006AGE
Intel Core i9-14900, NVIDIA T1000
34.2 (28.8min) fps +176%
Geekom AX8 Pro
AMD Ryzen 9 8945H, AMD Radeon 780M
31.8 (27.5min) fps +156%
Khadas Mind 2
Intel Core Ultra 7 155H, Intel Arc 8-Core iGPU
28 (24.4min) fps +126%
Asus NUC 14 Pro
Intel Core Ultra 5 125H, Intel Arc 7-Core iGPU
25.2 (22.3min) fps +103%
GMK NucBox K9
Intel Core Ultra 5 125H, Intel Arc 7-Core iGPU
25.2 (19.2min) fps +103%
GMK NucBox M6
AMD Ryzen 5 6600H, AMD Radeon 660M
18.1 (15.7min) fps +46%
Geekom XT13 Pro
Intel Core i9-13900H, Intel Iris Xe Graphics G7 96EUs
15 (12.4min) fps +21%
Усредн. модель с Intel Iris Xe Graphics G7 96EUs
  (11.4 - 17.7, n=9)
14.2 fps +15%
MSI Cubi NUC 1M
Intel Core 7 150U, Intel Iris Xe Graphics G7 96EUs
12.4 (10.3min) fps
Lenovo IdeaPad Slim 3i 15IRU9
Intel Core 5 120U, Intel Iris Xe Graphics G7 80EUs
11.7 (9.66min) fps -6%
GMK NucBox M5
AMD Ryzen 7 5700U, AMD Radeon RX Vega 8 (Ryzen 4000/5000)
10.9 (8.08min) fps -12%
HP Elite Mini 800 G9-5M9X6EA
Intel Core i5-14500, Intel UHD Graphics 770
7.06 (5.79min) fps -43%
Strange Brigade
1280x720 lowest AF:1
Lenovo ThinkStation P3 Tiny-30H0006AGE
Intel Core i9-14900, NVIDIA T1000
226 (39.2min, 192.3P1) fps +156%
Beelink SER8
AMD Ryzen 7 8845HS, AMD Radeon 780M
173.7 (119.2min, 145.2P1) fps +97%
GMK NucBox K6
AMD Ryzen 7 7840HS, AMD Radeon 780M
167.7 (34.3min, 142.9P1) fps +90%
GMK NucBox K9
Intel Core Ultra 5 125H, Intel Arc 7-Core iGPU
148.6 (45.8min, 118.4P1) fps +68%
Beelink SER6 Pro
AMD Ryzen 7 6800H, AMD Radeon 680M
141.9 (78.6min, 116.6P1) fps +61%
Beelink SER6 Pro Ryzen 7 7735HS
AMD Ryzen 7 7735HS, AMD Radeon 680M
137.8 (107.9min, 119.9P1) fps +56%
GMK NucBox M6
AMD Ryzen 5 6600H, AMD Radeon 660M
120.2 (78.3min, 104.5P1) fps +36%
MSI Cubi NUC 1M
Intel Core 7 150U, Intel Iris Xe Graphics G7 96EUs
88.2 (20min, 29.9P1) fps
Усредн. модель с Intel Iris Xe Graphics G7 96EUs
  (48.5 - 115.1, n=168)
84.8 fps -4%
Lenovo IdeaPad Slim 3i 15IRU9
Intel Core 5 120U, Intel Iris Xe Graphics G7 80EUs
84.7 (19.2min, 27.3P1) fps -4%
GMK NucBox M5
AMD Ryzen 7 5700U, AMD Radeon RX Vega 8 (Ryzen 4000/5000)
79.8 (20.7min, 69.9P1) fps -10%
Beelink SEi11 Pro
Intel Core i5-11320H, Intel Iris Xe Graphics G7 96EUs
79.3 (18.8min, 25.6P1) fps -10%
1920x1080 medium AA:medium AF:4
Lenovo ThinkStation P3 Tiny-30H0006AGE
Intel Core i9-14900, NVIDIA T1000
87.2 (73.7min, 77P1) fps +124%
Beelink SER8
AMD Ryzen 7 8845HS, AMD Radeon 780M
68.9 (55.3min, 59.1P1) fps +77%
GMK NucBox K6
AMD Ryzen 7 7840HS, AMD Radeon 780M
67.9 (43.7min, 58.3P1) fps +75%
GMK NucBox K9
Intel Core Ultra 5 125H, Intel Arc 7-Core iGPU
63.9 (33.2min, 54.3P1) fps +64%
Beelink SER6 Pro
AMD Ryzen 7 6800H, AMD Radeon 680M
57.8 (43.1min, 50.8P1) fps +49%
Beelink SER6 Pro Ryzen 7 7735HS
AMD Ryzen 7 7735HS, AMD Radeon 680M
56.4 (47.8min, 49P1) fps +45%
GMK NucBox M6
AMD Ryzen 5 6600H, AMD Radeon 660M
43 (36.6min, 37.4P1) fps +11%
MSI Cubi NUC 1M
Intel Core 7 150U, Intel Iris Xe Graphics G7 96EUs
38.9 (14.7min, 28.5P1) fps
Усредн. модель с Intel Iris Xe Graphics G7 96EUs
  (18.2 - 51.4, n=166)
36.5 fps -6%
Lenovo IdeaPad Slim 3i 15IRU9
Intel Core 5 120U, Intel Iris Xe Graphics G7 80EUs
35.9 (12.8min, 20.8P1) fps -8%
Beelink SEi11 Pro
Intel Core i5-11320H, Intel Iris Xe Graphics G7 96EUs
33.9 (10.3min, 19.8P1) fps -13%
GMK NucBox M5
AMD Ryzen 7 5700U, AMD Radeon RX Vega 8 (Ryzen 4000/5000)
32.4 (15.3min, 28.3P1) fps -17%
1920x1080 high AA:high AF:8
Lenovo ThinkStation P3 Tiny-30H0006AGE
Intel Core i9-14900, NVIDIA T1000
69.4 (49.4min, 53.4P1) fps +123%
Beelink SER8
AMD Ryzen 7 8845HS, AMD Radeon 780M
58.7 (43.2min, 45.6P1) fps +89%
GMK NucBox K6
AMD Ryzen 7 7840HS, AMD Radeon 780M
57.9 (7min, 45P1) fps +86%
GMK NucBox K9
Intel Core Ultra 5 125H, Intel Arc 7-Core iGPU
53.5 (28.6min, 42P1) fps +72%
Beelink SER6 Pro
AMD Ryzen 7 6800H, AMD Radeon 680M
48.6 (34.2min, 38.3P1) fps +56%
Beelink SER6 Pro Ryzen 7 7735HS
AMD Ryzen 7 7735HS, AMD Radeon 680M
47.1 (35.1min, 37.2P1) fps +51%
GMK NucBox M6
AMD Ryzen 5 6600H, AMD Radeon 660M
35.9 (28.5min, 29.1P1) fps +15%
MSI Cubi NUC 1M
Intel Core 7 150U, Intel Iris Xe Graphics G7 96EUs
31.1 (8.7min, 16.3P1) fps
Усредн. модель с Intel Iris Xe Graphics G7 96EUs
  (15.4 - 39.8, n=165)
29.3 fps -6%
Lenovo IdeaPad Slim 3i 15IRU9
Intel Core 5 120U, Intel Iris Xe Graphics G7 80EUs
28.5 (6.4min, 14.3P1) fps -8%
Beelink SEi11 Pro
Intel Core i5-11320H, Intel Iris Xe Graphics G7 96EUs
27.7 (10min, 15.1P1) fps -11%
GMK NucBox M5
AMD Ryzen 7 5700U, AMD Radeon RX Vega 8 (Ryzen 4000/5000)
26.8 (14.8min, 19.1P1) fps -14%
1920x1080 ultra AA:ultra AF:16
Lenovo ThinkStation P3 Tiny-30H0006AGE
Intel Core i9-14900, NVIDIA T1000
59.9 (44.2min, 47.8P1) fps +138%
Beelink SER8
AMD Ryzen 7 8845HS, AMD Radeon 780M
50.8 (24.5min, 33.9P1) fps +102%
GMK NucBox K6
AMD Ryzen 7 7840HS, AMD Radeon 780M
48.8 (11.1min, 31.1P1) fps +94%
GMK NucBox K9
Intel Core Ultra 5 125H, Intel Arc 7-Core iGPU
43.5 (8.2min, 17.8P1) fps +73%
Beelink SER6 Pro
AMD Ryzen 7 6800H, AMD Radeon 680M
41.9 (32.6min, 33.4P1) fps +66%
Beelink SER6 Pro Ryzen 7 7735HS
AMD Ryzen 7 7735HS, AMD Radeon 680M
40.7 (31.5min, 32.4P1) fps +62%
GMK NucBox M6
AMD Ryzen 5 6600H, AMD Radeon 660M
29.6 (21min, 24.7P1) fps +17%
MSI Cubi NUC 1M
Intel Core 7 150U, Intel Iris Xe Graphics G7 96EUs
25.2 (5.3min, 6.89P1) fps
Усредн. модель с Intel Iris Xe Graphics G7 96EUs
  (13.2 - 31.7, n=163)
23.7 fps -6%
Lenovo IdeaPad Slim 3i 15IRU9
Intel Core 5 120U, Intel Iris Xe Graphics G7 80EUs
22.8 (5min, 5.93P1) fps -10%
GMK NucBox M5
AMD Ryzen 7 5700U, AMD Radeon RX Vega 8 (Ryzen 4000/5000)
22.7 (11.3min, 12.5P1) fps -10%
Beelink SEi11 Pro
Intel Core i5-11320H, Intel Iris Xe Graphics G7 96EUs
22.2 (5.6min, 7.76P1) fps -12%
Baldur's Gate 3
1280x720 Low Preset
Lenovo ThinkStation P3 Tiny-30H0006AGE
Intel Core i9-14900, NVIDIA T1000
75.9 (36.6min, 56P0.1, 65.8P1) fps +231%
Beelink SER8
AMD Ryzen 7 8845HS, AMD Radeon 780M
63.4 fps +177%
Geekom AX8 Pro
AMD Ryzen 9 8945H, AMD Radeon 780M
60.8 (21.6min, 28.1P0.1, 35.6P1) fps +166%
GMK NucBox K9
Intel Core Ultra 5 125H, Intel Arc 7-Core iGPU
50.8 fps +122%
Asus NUC 14 Pro
Intel Core Ultra 5 125H, Intel Arc 7-Core iGPU
50.2 (27.7min, 29.7P0.1, 32.6P1) fps +119%
Khadas Mind 2
Intel Core Ultra 7 155H, Intel Arc 8-Core iGPU
48.5 (16.6min, 27.3P0.1, 31.4P1) fps +112%
GMK NucBox M6
AMD Ryzen 5 6600H, AMD Radeon 660M
37.3 fps +63%
Geekom XT13 Pro
Intel Core i9-13900H, Intel Iris Xe Graphics G7 96EUs
28.2 (13.8min, 15.1P0.1, 19.8P1) fps +23%
MSI Cubi NUC 1M
Intel Core 7 150U, Intel Iris Xe Graphics G7 96EUs
22.9 fps
Усредн. модель с Intel Iris Xe Graphics G7 96EUs
  (14.5 - 28.2, n=7)
22.8 fps 0%
GMK NucBox M5
AMD Ryzen 7 5700U, AMD Radeon RX Vega 8 (Ryzen 4000/5000)
22.5 fps -2%
Lenovo IdeaPad Slim 3i 15IRU9
Intel Core 5 120U, Intel Iris Xe Graphics G7 80EUs
20.2 fps -12%
HP Elite Mini 800 G9-5M9X6EA
Intel Core i5-14500, Intel UHD Graphics 770
16.9 (10.9min, 11.1P0.1, 12.8P1) fps -26%
1920x1080 Low Preset
Lenovo ThinkStation P3 Tiny-30H0006AGE
Intel Core i9-14900, NVIDIA T1000
45 (22.4min, 36.9P0.1, 38.2P1) fps +194%
Beelink SER8
AMD Ryzen 7 8845HS, AMD Radeon 780M
41.6 fps +172%
GMK NucBox K6
AMD Ryzen 7 7840HS, AMD Radeon 780M
40.5 fps +165%
Geekom AX8 Pro
AMD Ryzen 9 8945H, AMD Radeon 780M
38.5 (19.4min, 19.8P0.1, 29.1P1) fps +152%
GMK NucBox K9
Intel Core Ultra 5 125H, Intel Arc 7-Core iGPU
33.7 fps +120%
Asus NUC 14 Pro
Intel Core Ultra 5 125H, Intel Arc 7-Core iGPU
33.5 (20.9min, 21P0.1, 23.4P1) fps +119%
Khadas Mind 2
Intel Core Ultra 7 155H, Intel Arc 8-Core iGPU
32.9 (20.4min, 20.8P0.1, 22.7P1) fps +115%
GMK NucBox M6
AMD Ryzen 5 6600H, AMD Radeon 660M
22.9 fps +50%
Geekom XT13 Pro
Intel Core i9-13900H, Intel Iris Xe Graphics G7 96EUs
19.9 (15.5min, 15.6P0.1, 16.4P1) fps +30%
Усредн. модель с Intel Iris Xe Graphics G7 96EUs
  (9.4 - 19.9, n=7)
15.6 fps +2%
MSI Cubi NUC 1M
Intel Core 7 150U, Intel Iris Xe Graphics G7 96EUs
15.3 fps
GMK NucBox M5
AMD Ryzen 7 5700U, AMD Radeon RX Vega 8 (Ryzen 4000/5000)
14.2 fps -7%
Lenovo IdeaPad Slim 3i 15IRU9
Intel Core 5 120U, Intel Iris Xe Graphics G7 80EUs
13.1 fps -14%
HP Elite Mini 800 G9-5M9X6EA
Intel Core i5-14500, Intel UHD Graphics 770
10.2 (7.83min, 7.9P0.1, 8.15P1) fps -33%
1920x1080 Medium Preset
Lenovo ThinkStation P3 Tiny-30H0006AGE
Intel Core i9-14900, NVIDIA T1000
35.2 (20.6min, 26.7P0.1, 30.6P1) fps
Beelink SER8
AMD Ryzen 7 8845HS, AMD Radeon 780M
34.8 fps
GMK NucBox K6
AMD Ryzen 7 7840HS, AMD Radeon 780M
33.7 fps
Geekom AX8 Pro
AMD Ryzen 9 8945H, AMD Radeon 780M
29.9 (11.8min, 18.6P0.1, 23.5P1) fps
GMK NucBox K9
Intel Core Ultra 5 125H, Intel Arc 7-Core iGPU
27.9 fps
Asus NUC 14 Pro
Intel Core Ultra 5 125H, Intel Arc 7-Core iGPU
25.9 (5.81min, 8.8P0.1, 15.9P1) fps
Khadas Mind 2
Intel Core Ultra 7 155H, Intel Arc 8-Core iGPU
25 (9.42min, 11.3P0.1, 16.1P1) fps
Geekom XT13 Pro
Intel Core i9-13900H, Intel Iris Xe Graphics G7 96EUs
15.4 (11.8min, 11.9P0.1, 12.7P1) fps
GMK NucBox M6
AMD Ryzen 5 6600H, AMD Radeon 660M
15.1 fps
Усредн. модель с Intel Iris Xe Graphics G7 96EUs
  (13 - 15.4, n=4)
14.5 fps
Lenovo IdeaPad Slim 3i 15IRU9
Intel Core 5 120U, Intel Iris Xe Graphics G7 80EUs
10.8 fps
HP Elite Mini 800 G9-5M9X6EA
Intel Core i5-14500, Intel UHD Graphics 770
7.86 (5.51min, 5.72P0.1, 6.18P1) fps
1920x1080 High Preset
Lenovo ThinkStation P3 Tiny-30H0006AGE
Intel Core i9-14900, NVIDIA T1000
30.2 (10.5min, 12.6P0.1, 26.4P1) fps
Beelink SER8
AMD Ryzen 7 8845HS, AMD Radeon 780M
28.9 fps
GMK NucBox K6
AMD Ryzen 7 7840HS, AMD Radeon 780M
28.1 fps
Geekom AX8 Pro
AMD Ryzen 9 8945H, AMD Radeon 780M
24.5 (17.7min, 17.7P0.1, 19.8P1) fps
GMK NucBox K9
Intel Core Ultra 5 125H, Intel Arc 7-Core iGPU
24.2 fps
Asus NUC 14 Pro
Intel Core Ultra 5 125H, Intel Arc 7-Core iGPU
22.4 (14min, 14.2P0.1, 15.3P1) fps
Khadas Mind 2
Intel Core Ultra 7 155H, Intel Arc 8-Core iGPU
21.6 (11.7min, 12.4P0.1, 13.9P1) fps
Geekom XT13 Pro
Intel Core i9-13900H, Intel Iris Xe Graphics G7 96EUs
13.5 (11.2min, 11.2P0.1, 11.6P1) fps
GMK NucBox M6
AMD Ryzen 5 6600H, AMD Radeon 660M
13.3 fps
Усредн. модель с Intel Iris Xe Graphics G7 96EUs
  (10.6 - 13.5, n=4)
12.3 fps
HP Elite Mini 800 G9-5M9X6EA
Intel Core i5-14500, Intel UHD Graphics 770
6.88 (5.24min, 5.26P0.1, 5.41P1) fps
1920x1080 Ultra Preset
Lenovo ThinkStation P3 Tiny-30H0006AGE
Intel Core i9-14900, NVIDIA T1000
29.5 (13.3min, 21.5P0.1, 25.7P1) fps
Beelink SER8
AMD Ryzen 7 8845HS, AMD Radeon 780M
28 fps
GMK NucBox K6
AMD Ryzen 7 7840HS, AMD Radeon 780M
27 fps
Geekom AX8 Pro
AMD Ryzen 9 8945H, AMD Radeon 780M
24.4 (8.81min, 15.2P0.1, 19.3P1) fps
GMK NucBox K9
Intel Core Ultra 5 125H, Intel Arc 7-Core iGPU
23.1 fps
Asus NUC 14 Pro
Intel Core Ultra 5 125H, Intel Arc 7-Core iGPU
21.5 (13.6min, 13.7P0.1, 14.1P1) fps
Khadas Mind 2
Intel Core Ultra 7 155H, Intel Arc 8-Core iGPU
21 (12.8min, 12.9P0.1, 13.6P1) fps
Geekom XT13 Pro
Intel Core i9-13900H, Intel Iris Xe Graphics G7 96EUs
13 (10.1min, 10.1P0.1, 11P1) fps
GMK NucBox M6
AMD Ryzen 5 6600H, AMD Radeon 660M
12.6 fps
Усредн. модель с Intel Iris Xe Graphics G7 96EUs
  (9.3 - 13, n=4)
11.6 fps
X-Plane 11.11
1280x720 low (fps_test=1)
Lenovo ThinkStation P3 Tiny-30H0006AGE
Intel Core i9-14900, NVIDIA T1000
211 fps
Beelink SER6 Pro
AMD Ryzen 7 6800H, AMD Radeon 680M
66.4 fps
GMK NucBox K6
AMD Ryzen 7 7840HS, AMD Radeon 780M
65.9 fps
Beelink SER8
AMD Ryzen 7 8845HS, AMD Radeon 780M
65.9 fps
Beelink SER6 Pro Ryzen 7 7735HS
AMD Ryzen 7 7735HS, AMD Radeon 680M
65.2 fps
Geekom AX8 Pro
AMD Ryzen 9 8945H, AMD Radeon 780M
64.2 fps
Beelink SEi11 Pro
Intel Core i5-11320H, Intel Iris Xe Graphics G7 96EUs
58.2 fps
GMK NucBox K9
Intel Core Ultra 5 125H, Intel Arc 7-Core iGPU
57 fps
Khadas Mind 2
Intel Core Ultra 7 155H, Intel Arc 8-Core iGPU
52.7 fps
GMK NucBox M6
AMD Ryzen 5 6600H, AMD Radeon 660M
51.8 fps
Asus NUC 14 Pro
Intel Core Ultra 5 125H, Intel Arc 7-Core iGPU
47.5 fps
Усредн. модель с Intel Iris Xe Graphics G7 96EUs
  (13.4 - 88.4, n=212)
41.5 fps
GMK NucBox M5
AMD Ryzen 7 5700U, AMD Radeon RX Vega 8 (Ryzen 4000/5000)
40.4 fps
Lenovo IdeaPad Slim 3i 15IRU9
Intel Core 5 120U, Intel Iris Xe Graphics G7 80EUs
34.9 fps
1920x1080 med (fps_test=2)
Lenovo ThinkStation P3 Tiny-30H0006AGE
Intel Core i9-14900, NVIDIA T1000
145.8 fps
Beelink SER6 Pro
AMD Ryzen 7 6800H, AMD Radeon 680M
52.9 fps
Beelink SER6 Pro Ryzen 7 7735HS
AMD Ryzen 7 7735HS, AMD Radeon 680M
52.3 fps
Beelink SER8
AMD Ryzen 7 8845HS, AMD Radeon 780M
47.8 fps
GMK NucBox K6
AMD Ryzen 7 7840HS, AMD Radeon 780M
47.3 fps
Geekom AX8 Pro
AMD Ryzen 9 8945H, AMD Radeon 780M
46.8 fps
GMK NucBox K9
Intel Core Ultra 5 125H, Intel Arc 7-Core iGPU
44.8 fps
Beelink SEi11 Pro
Intel Core i5-11320H, Intel Iris Xe Graphics G7 96EUs
41.2 fps
Khadas Mind 2
Intel Core Ultra 7 155H, Intel Arc 8-Core iGPU
39.4 fps
GMK NucBox M6
AMD Ryzen 5 6600H, AMD Radeon 660M
38.5 fps
Asus NUC 14 Pro
Intel Core Ultra 5 125H, Intel Arc 7-Core iGPU
38.5 fps
Усредн. модель с Intel Iris Xe Graphics G7 96EUs
  (11.6 - 69.5, n=213)
35.2 fps
GMK NucBox M5
AMD Ryzen 7 5700U, AMD Radeon RX Vega 8 (Ryzen 4000/5000)
27.3 fps
Lenovo IdeaPad Slim 3i 15IRU9
Intel Core 5 120U, Intel Iris Xe Graphics G7 80EUs
25.9 fps
1920x1080 high (fps_test=3)
Lenovo ThinkStation P3 Tiny-30H0006AGE
Intel Core i9-14900, NVIDIA T1000
130.1 fps
Beelink SER6 Pro
AMD Ryzen 7 6800H, AMD Radeon 680M
43 fps
Beelink SER6 Pro Ryzen 7 7735HS
AMD Ryzen 7 7735HS, AMD Radeon 680M
42.2 fps
Geekom AX8 Pro
AMD Ryzen 9 8945H, AMD Radeon 780M
40.1 fps
GMK NucBox K6
AMD Ryzen 7 7840HS, AMD Radeon 780M
39.7 fps
Beelink SER8
AMD Ryzen 7 8845HS, AMD Radeon 780M
39.6 fps
Beelink SEi11 Pro
Intel Core i5-11320H, Intel Iris Xe Graphics G7 96EUs
37.3 fps
GMK NucBox K9
Intel Core Ultra 5 125H, Intel Arc 7-Core iGPU
37.3 fps
Khadas Mind 2
Intel Core Ultra 7 155H, Intel Arc 8-Core iGPU
34.1 fps
GMK NucBox M6
AMD Ryzen 5 6600H, AMD Radeon 660M
33.2 fps
Asus NUC 14 Pro
Intel Core Ultra 5 125H, Intel Arc 7-Core iGPU
32.9 fps
Усредн. модель с Intel Iris Xe Graphics G7 96EUs
  (11.1 - 59.8, n=212)
31.6 fps
GMK NucBox M5
AMD Ryzen 7 5700U, AMD Radeon RX Vega 8 (Ryzen 4000/5000)
25.1 fps
Lenovo IdeaPad Slim 3i 15IRU9
Intel Core 5 120U, Intel Iris Xe Graphics G7 80EUs
24.2 fps

Частота кадров, Cyberpunk 2077

0123456789Tooltip
MSI Cubi NUC 1M Core 7 150U, Iris Xe G7 96EUs: Ø9.7 (7.82-9.96)
мин.сред.выс.макс.
GTA V (2015) 100.3 86.1 23.6 9.98
Dota 2 Reborn (2015) 97.7 61.9 62.5 57.8
Final Fantasy XV Benchmark (2018) 40.9 23 16.6
Far Cry 5 (2018) 49 28 26 24
Strange Brigade (2018) 88.2 38.9 31.1 25.2
Tiny Tina's Wonderlands (2022) 27.5 20.3 14 10.9
F1 22 (2022) 42.3 38.2 28.3 21.4
Baldur's Gate 3 (2023) 15.3
Cyberpunk 2077 2.1 Phantom Liberty (2023) 15.4 12.4 10.8 9.46

Температурные и акустические показатели

Система охлаждения

Внутренний вентилятор всегда активен, его базовый уровень шума составляет около 30 дБ(А). Хорошая новость заключается в том, что это почти неслышно в типичной обстановке офиса или конференц-зала. Кроме того, вентилятор относительно инертен, поэтому при работе даже со средними и высокими нагрузками не происходит резкого или сильного увеличения числа оборотов.

Профиль шума вентилятора (Белый: Фоновый, Красный: Простой системы, Синий: 3DMark 06, Оранжевый: Cyberpunk 2077, Зеленый: Prime95+FurMark stress)

Уровень шума

Ожидание
29.9 / 29.9 / 32 дБ
Нагрузка
33.5 / 40.5 дБ
  red to green bar
 
 
30 dB
бесшумно
40 dB(A)
различимо
50 dB(A)
громко
 
min: dark, med: mid, max: light   Earthworks M23R, Arta (15 см от источника шума)   фоновый шум: 23.5 dB(A)
dB(A) 0102030405060708090Deep BassMiddle BassHigh BassLower RangeMidsHigher MidsLower HighsMid HighsUpper HighsSuper Highs2032.633.329.434.929.9252425.823.326.224.23124.724.422.724.121.24022.421.620.221.520.75025.622.42224.725.86330.130.23030.223.18023.521.522.522.925.61002320.420.31925.112524.821.722.321.824.316023.823.525.716.124.920032.526.327.513.829.525027.522.821.214.829.331525.724.222.517.826.540027.324.223.815.428.850028.429.526.412.829.163031.425.924.911.333.280028.122.822.210.129.9100026.521.919.99.827.4125029.521.620.99.530.2160031.824.222.61033.4200028.220.318.410.529.9250022.61513.910.624315027.819.118.11129.3400019.818.515.611.321.3500020.515.41411.821.8630014.313.513.112.115.2800014.514.913.61214.11000013.614.2131212.61250013.213.612.81212.3160001515.913.711.312.2SPL39.133.53223.740.4N31.81.60.53.3median 25.7median 21.6median 20.3median 12median 26.5Delta4.24.252.45.5hearing rangehide median Fan NoiseMSI Cubi NUC 1M
MSI Cubi NUC 1M
Iris Xe G7 96EUs, Core 7 150U, WD PC SN560 SDDPNQE-1T00
GMK NucBox K9
Arc 7-Core, Ultra 5 125H, MasonSemi 1TB MC7000
Asus NUC 14 Pro
Arc 7-Core, Ultra 5 125H, Kingston KC3000 2048G SKC3000D2048G
Beelink SEi11 Pro
Iris Xe G7 96EUs, i5-11320H, Kingston NV1 SNVS/500GCN
Beelink SER8
Radeon 780M, R7 8845HS, Crucial P3 Plus CT1000P3PSSD8
BOSGAME M1
Radeon 780M, R7 7840HS
Уровень шума
-11%
-4%
11%
5%
-6%
в выкл. виде (фон) *
23.5
23
2%
24
-2%
22.8
3%
23.6
-0%
23.2
1%
Мин. в простое *
29.9
29.8
-0%
26
13%
24.7
17%
28.8
4%
32
-7%
В простое, сред. *
29.9
35.7
-19%
26.2
12%
24.7
17%
28.8
4%
32
-7%
В простое, макс. *
32
35.7
-12%
26.2
18%
25.3
21%
30.5
5%
32
-0%
Нагрузка, сред. *
33.5
41.9
-25%
42.4
-27%
33.2
1%
34.6
-3%
38.7
-16%
Cyberpunk 2077 ultra *
39.1
43.8
-12%
47.7
-22%
34.1
13%
Нагрузка, макс. *
40.5
44
-9%
47.8
-18%
37.8
7%
34.5
15%
42
-4%
Witcher 3 ultra *
34.5
41.7

* ... меньше = лучше

Температура

Адаптер переменного тока достигает температуры более 35 C под нагрузкой

В отличие от большинства других мини-ПК, Cubi NUC 1M не имеет вентиляционных решеток почти со всех сторон, кроме нижней и задней. Однако энергоэффективный процессор серии U означает, что температура поверхности не должна быть проблемой, независимо от этого. Температура горячей точки сверху останется ниже 30 C даже при длительной работе с высокими нагрузками.

Система простаивает (спереди)
Система простаивает (сзади)
Prime95+FurMark стресс (спереди)
Prime95+FurMark стресс (сзади)

Энергопотребление

Энергопотребление

Среднего размера (~13 x 6.8 x 2.7 см) бочкообразный адаптер переменного тока мощностью 120 Вт

Потребление в целом ниже, чем у большинства H-мощных мини-ПК, особенно при работе с требовательными нагрузками. Особенно примечательно, что в комплект поставки системы входит внушительный адаптер переменного тока мощностью 120 Вт, хотя при 100-процентной загрузке процессора мини-ПК потребляет едва ли половину мощности. Высокие накладные расходы можно использовать для питания аксессуаров Thunderbolt или других внешних устройств.

В будущем мы хотели бы увидеть переход на универсальные сетевые адаптеры USB-C, как в современных ноутбуках с питанием от U-серии.

3DMark 06
3DMark 06
Cyberpunk 2077 1080p Ультра
Prime95
Prime95
Prime95+FurMark
Prime95+FurMark
Энергопотребление
Выкл.darklight 0.18 / 1.9 Вт
Ожиданиеdarkmidlight 6.4 / 8.3 / 10.4 Вт
Нагрузка midlight 38.5 / 52.5 Вт
 color bar
Легенда: min: dark, med: mid, max: light        Metrahit Energy
MSI Cubi NUC 1M
Core 7 150U, Iris Xe G7 96EUs, WD PC SN560 SDDPNQE-1T00, , x,
GMK NucBox K9
Ultra 5 125H, Arc 7-Core, MasonSemi 1TB MC7000, , x,
Asus NUC 14 Pro
Ultra 5 125H, Arc 7-Core, Kingston KC3000 2048G SKC3000D2048G, , x,
Beelink SEi11 Pro
i5-11320H, Iris Xe G7 96EUs, Kingston NV1 SNVS/500GCN, , x,
Beelink SER8
R7 8845HS, Radeon 780M, Crucial P3 Plus CT1000P3PSSD8, , x,
BOSGAME M1
R7 7840HS, Radeon 780M, , , x,
Энергопотребление
-41%
-34%
-26%
-24%
-32%
В простое, мин. *
6.4
10.9
-70%
5.1
20%
9.8
-53%
7.3
-14%
7.3
-14%
В простое, сред. *
8.3
11
-33%
6.4
23%
10.3
-24%
7.3
12%
7.3
12%
В простое, макс. *
10.4
11.4
-10%
14.7
-41%
10.5
-1%
8.4
19%
8.4
19%
Нагрузка, сред. *
38.5
52.8
-37%
55.5
-44%
54.2
-41%
68.2
-77%
72.7
-89%
Cyberpunk 2077 ultra external monitor *
36.1
57.1
-58%
59.1
-64%
Нагрузка, макс. *
52.5
72.2
-38%
103.3
-97%
59
-12%
84.3
-61%
99.1
-89%
Witcher 3 ultra *
53.1
75.1
80.5

* ... меньше = лучше

Энергопотребление: Cyberpunk 2077, Стресс-тест

0510152025303540455055606570Tooltip
MSI Cubi NUC 1M Core 7 150U, Iris Xe G7 96EUs: Ø40.2 (37.4-52.6)
Beelink SER6 Pro R7 6800H, Radeon 680M: Ø63.3 (62-72)

Энергопотребление с внешним монитором

0510152025303540455055606570Tooltip
MSI Cubi NUC 1M Core 7 150U, Iris Xe G7 96EUs; Prime95 V2810 Stress (external Monitor): Ø40.6 (37.7-53.5)
Beelink SER6 Pro R7 6800H, Radeon 680M; Prime95 V2810 Stress (external Monitor): Ø62.1 (60.9-70.6)
MSI Cubi NUC 1M Core 7 150U, Iris Xe G7 96EUs; Cinebench R15 Multi (external Monitor): Ø45 (33.5-48.5)
Beelink SER6 Pro R7 6800H, Radeon 680M; Cinebench R15 Multi (external Monitor): Ø61 (57.5-66.4)
MSI Cubi NUC 1M Core 7 150U, Iris Xe G7 96EUs; 1280x720 FurMark 1.19 GPU Stress Test (external Monitor): Ø35.6 (32.5-49.3)
Beelink SER6 Pro R7 6800H, Radeon 680M; 1280x720 FurMark 1.19 GPU Stress Test (external Monitor): Ø62.6 (61.3-68.3)
MSI Cubi NUC 1M Core 7 150U, Iris Xe G7 96EUs; Idle 1min (external Monitor): Ø10.5 (6.41-13.6)
Beelink SER6 Pro R7 6800H, Radeon 680M; Idle 1min (external Monitor): Ø8.51 (8.12-9.32)
MSI Cubi NUC 1M Core 7 150U, Iris Xe G7 96EUs; Cyberpunk 2077 FHD ultra no FSR - external Monitor: Ø36.1 (35.5-37.1)

Общая оценка Notebookcheck

MSI Cubi NUC 1M - 30 October 2024 v8
Allen Ngo

Корпус
76 / 98 → 77%
Порты и связь
66 / 81 → 82%
Вес
81%
3D-производительность
25 / 80 → 31%
Производительность ЦП
82 / 92 → 89%
Шумность
78%
Средний балл
40%
66%
Mini PC - Итоговый рейтинг
CO2 Emissions
No Data
Materials
50%
Packaging
50%
Power Use
75.5%
Repairability
40%
Software Updates
22.3%
Recycle Logo Total Sustainability Score: 39.6%

Декларация о непредвзятости

Протестированный экземпляр был выдан автору этого материала на короткое время для целей тестирования. Производитель товара или магазин, выдавший нам этот товар на время, не имели никакого влияния на результаты тестирования и не видели текст обзора до его публикации; статья написана не в качестве исполнения любых обязательств перед кем-либо.

This is how Notebookcheck is testing

Every year, Notebookcheck independently reviews hundreds of laptops and smartphones using standardized procedures to ensure that all results are comparable. We have continuously developed our test methods for around 20 years and set industry standards in the process. In our test labs, high-quality measuring equipment is utilized by experienced technicians and editors. These tests involve a multi-stage validation process. Our complex rating system is based on hundreds of well-founded measurements and benchmarks, which maintains objectivity. Further information on our test methods can be found here.

Этот важный материал точно понравится твоим друзьям в социальных сетях!
Mail Logo
'
> Обзоры Ноутбуков, Смартфонов, Планшетов. Тесты и Новости > Обзоры > Обзор мини-ПК MSI Cubi NUC 1M: Солидный, но дороже конкурентов
Allen Ngo, 2024-11- 6 (Update: 2024-11- 6)