

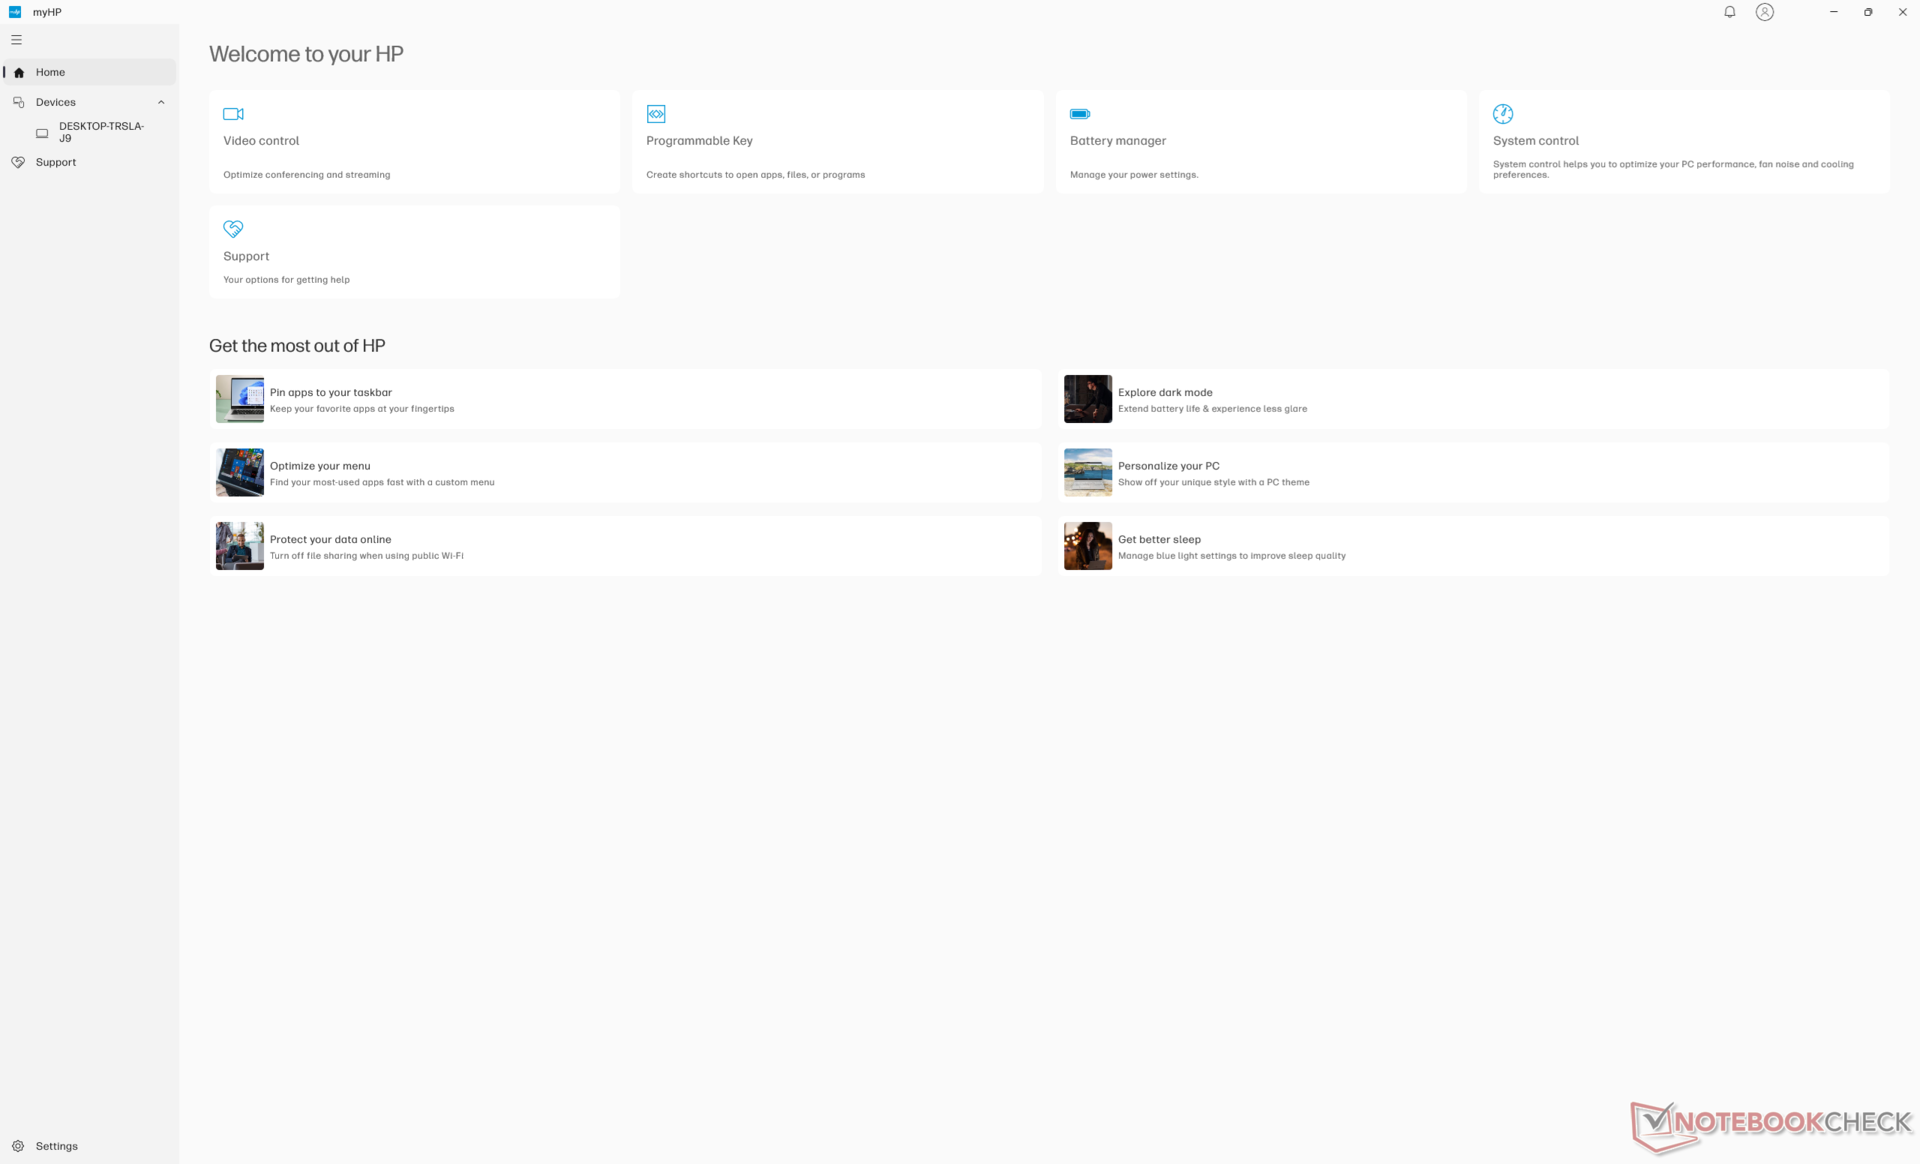
Обзор HP ZBook Power 16 G11 A: Мощная рабочая станция с AMD Zen 4

ZBook Power 16 G11 пришел на смену старшей модели ZBook Power 15 G10, получив как новые внутренние процессоры, так и новые внешние изменения. Как следует из названия, ZBook Power 16 G11 модернизирует серию, отказавшись от старого 15,6-дюймового форм-фактора в пользу 16-дюймового дизайна. По производительности он занимает место между младшей моделью ZBook Firefly и старшей ZBook Fury. Пользователи могут выбрать процессоры Intel Core Ultra от Meteor Lake или процессоры AMD Ryzen Zen 4 и графику Nvidia RTX.
В нашем обзоре представлена конфигурация AMD высшего класса (ZBook Power 16 G11 A) с процессором Ryzen 7 8845HS, графическим процессором RTX 2000 Ada и IPS-дисплеем 120 Гц 2560 x 1600p по цене около $2100. Варианты очень широки - от Ryzen 5 8645HS до Ryzen 9 8945HS с дисплеем 1200p и графикой RTX 1000, RTX 2000 или RTX 3000. Пользователи также могут выбрать вариант без дискретной графики.
Конкурентами в этом сегменте являются другие 16-дюймовые рабочие станции, такие как Dell Precision 5690, MSI CreatorPro Z16Pили Lenovo ThinkPad P16s G2.
Другие обзоры HP:
Соперники
Рейтинг | Версия | Дата | Модель | Вес | Height | Размер | Разрешение | Цена |
|---|---|---|---|---|---|---|---|---|
| 85.4 % | v8 | October 2024 | HP ZBook Power 16 G11 A R7 8845HS, NVIDIA RTX 2000 Ada Generation Laptop GPU | 2.2 килог. | 22.9 мм | 16.00" | 2560x1600 | |
| 88.9 % v7 (old) | v7 (old) | HP ZBook Power 15 G10 R7 PRO 7840HS, NVIDIA RTX 2000 Ada Generation Laptop GPU | 2 килог. | 22.9 мм | 15.60" | 2560x1440 | ||
| 85.9 % | v8 | August 2024 | HP ZBook Fury 16 G11 i9-14900HX, NVIDIA RTX 3500 Ada Generation Laptop GPU | 2.6 килог. | 28.5 мм | 16.00" | 3840x2400 | |
| 83.5 % | v8 | October 2024 | Lenovo ThinkPad P1 Gen 7 21KV001SGE Ultra 7 155H, NVIDIA GeForce RTX 4060 Laptop GPU | 2 килог. | 20.5 мм | 16.00" | 2560x1600 | |
| 88.6 % v7 (old) | v7 (old) | Lenovo ThinkPad P16s G2 21K9000CGE R7 PRO 7840U, Radeon 780M | 1.8 килог. | 24.4 мм | 16.00" | 3840x2400 | ||
| 88.3 % v7 (old) | v7 (old) | July 2024 | Dell Precision 5690 Ultra 9 185H, NVIDIA RTX 5000 Ada Generation Laptop GPU | 2.3 килог. | 22.17 мм | 16.00" | 3840x2400 |
Примечание: Недавно мы обновили нашу систему рейтинга, и результаты версии 8 не сопоставимы с результатами версии 7. Более подробная информация доступна здесь .
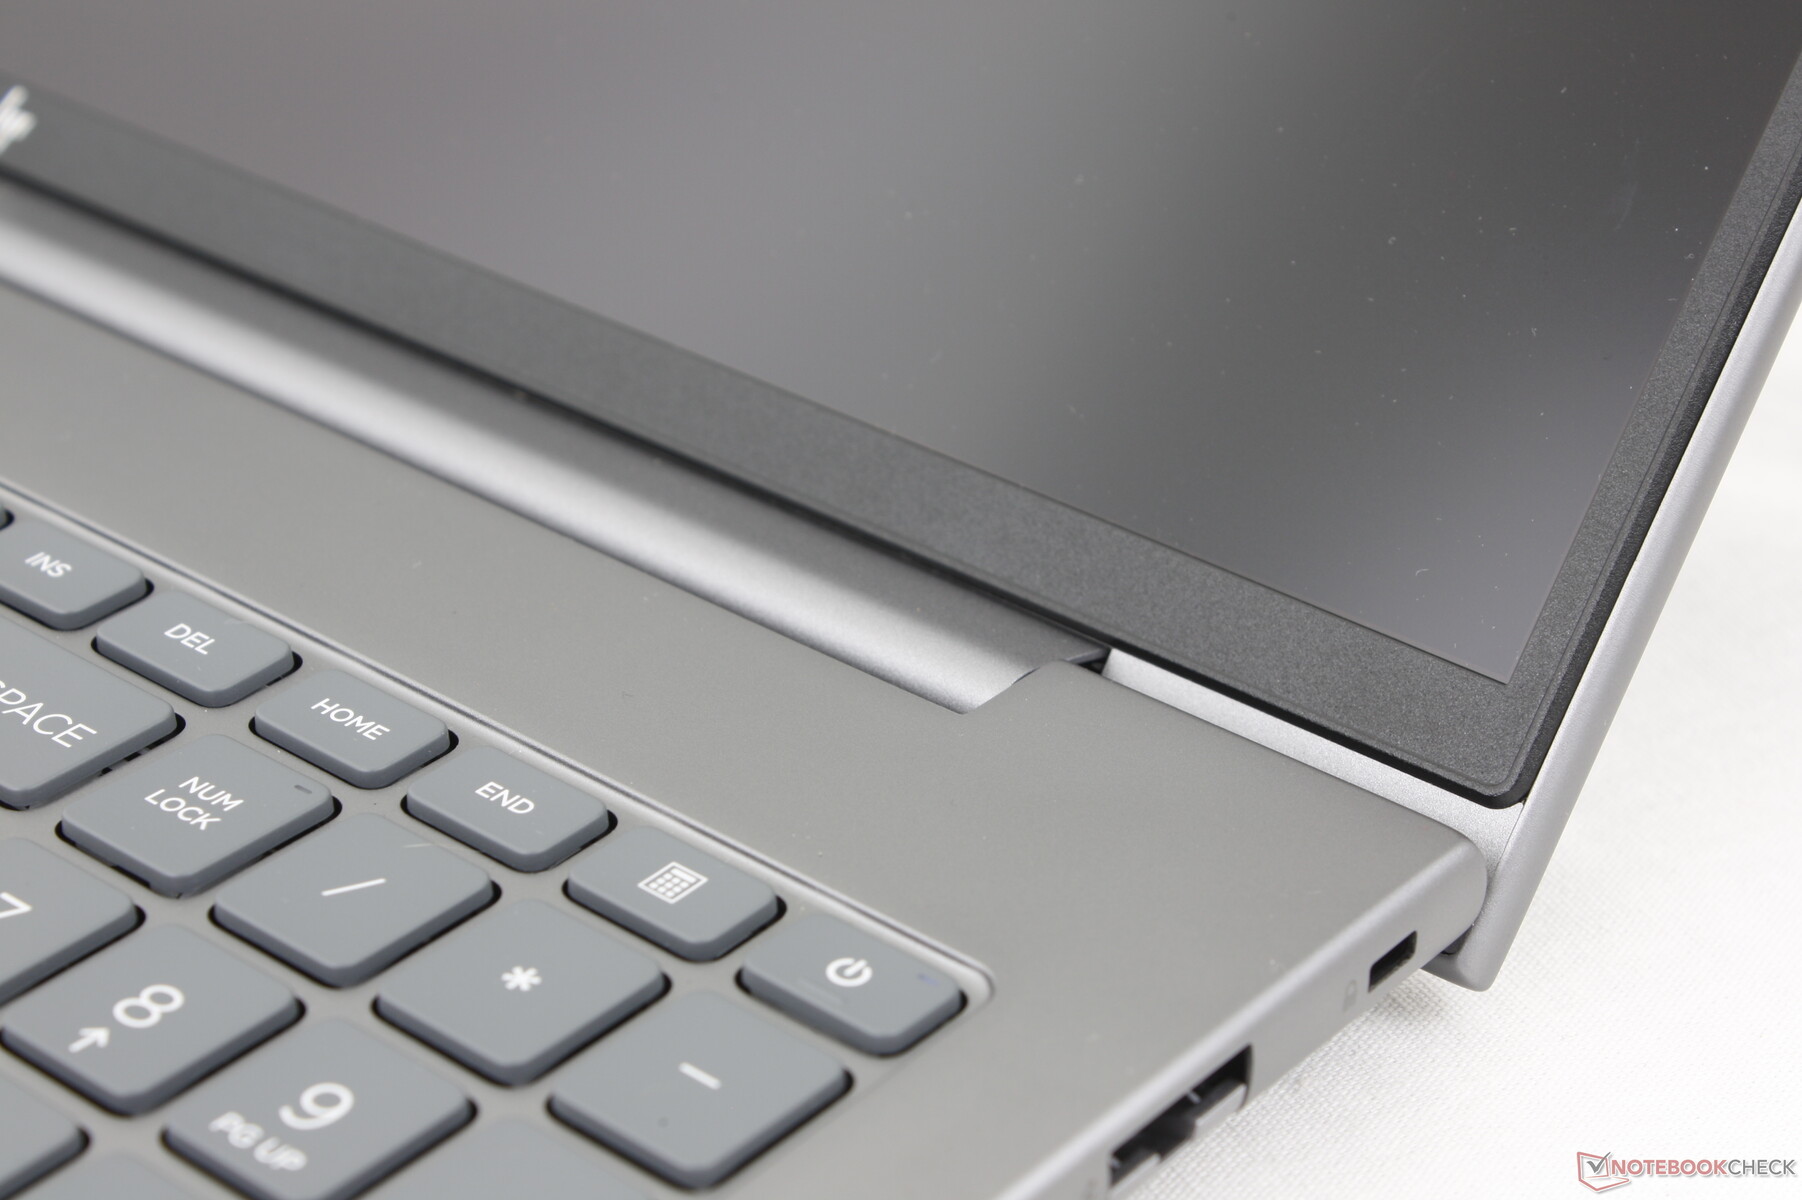
Дизайн и особенности - Сертифицирован по стандарту MIL-STD 810
Компания HP использует одинаковые материалы из серого алюминиевого сплава почти для всех своих моделей ZBook, чтобы создать ощущение единообразия во всем семействе. В данном случае ZBook Power 16 G11 имеет ту же гладкую матовую металлическую текстуру, что и ZBook Power 15 G10, но с поверхностными изменениями в границах клавиатуры, внешней отделке крышки и нижней панели.
Жесткость корпуса отличная, с минимальными изгибами и впадинами при попытке повернуть основание. Однако петли и крышка могли бы быть более жесткими, особенно учитывая, что крышка может открываться почти на все 180 градусов, в отличие от Precision 5690.
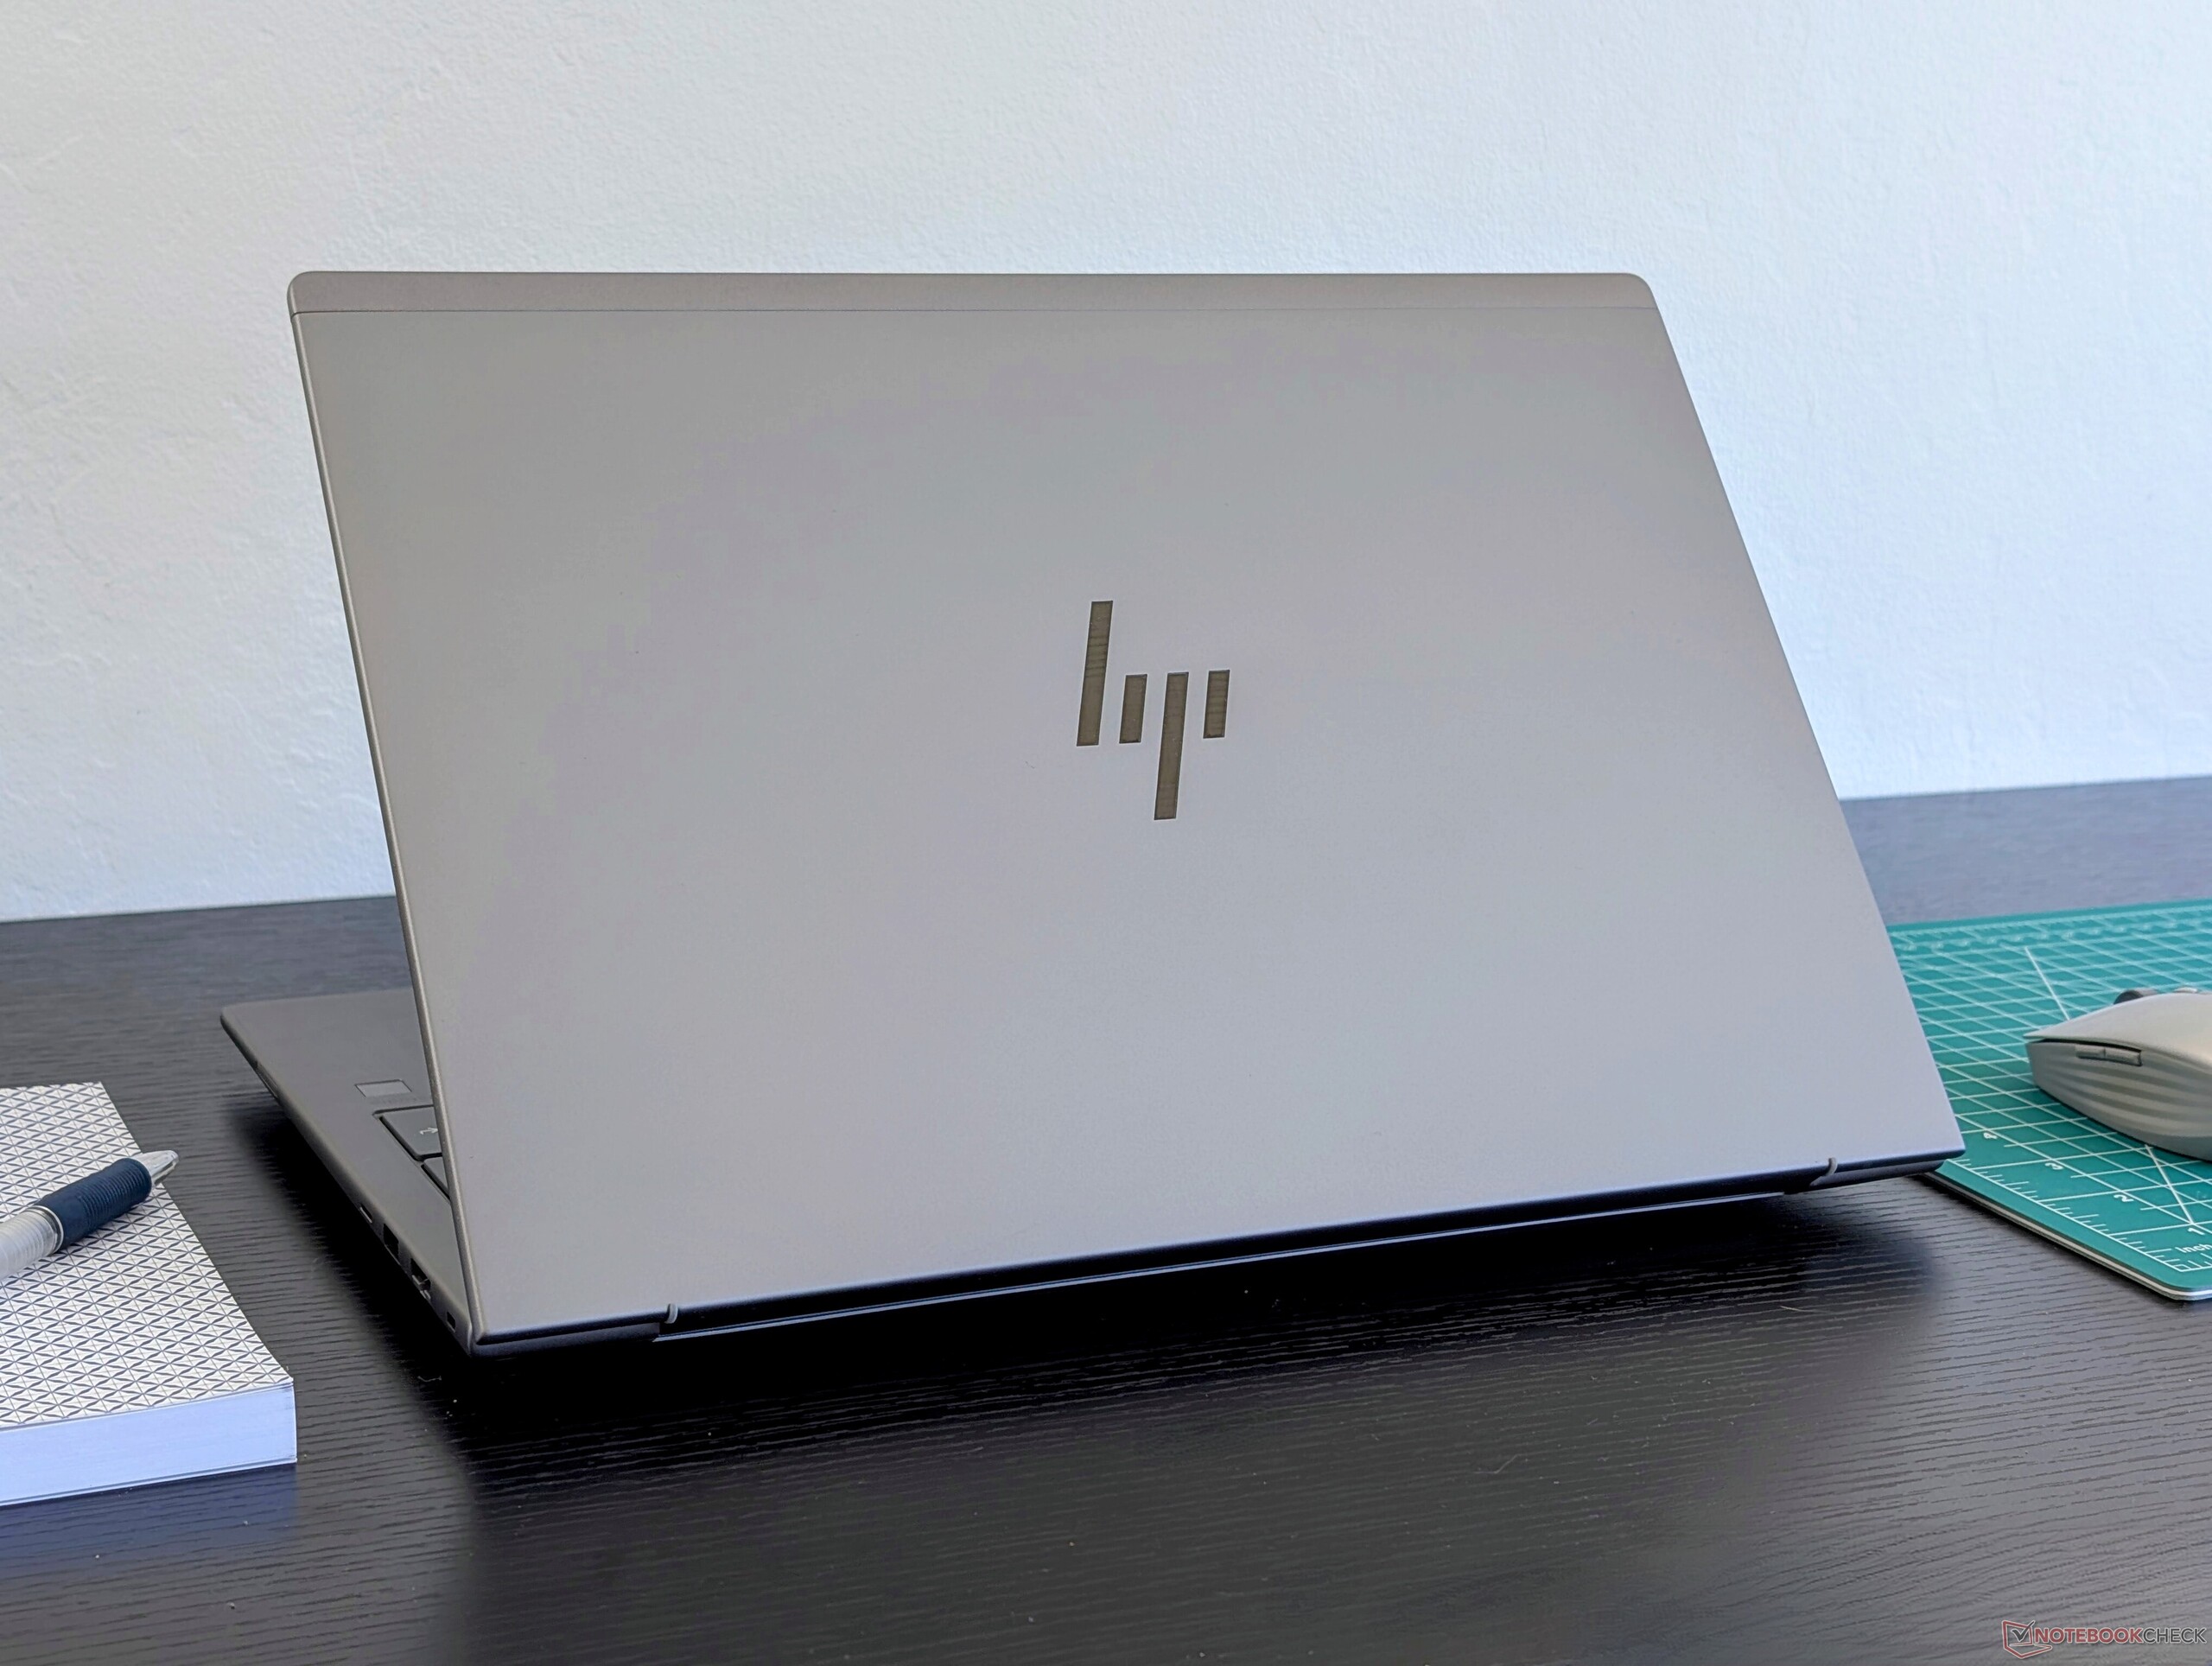
Новый 16-дюймовый дизайн примерно на 10% тяжелее и на 7% больше, чем уходящая 15-дюймовая модель. При этом он не стал тоньше, что очень неприятно, так как он уже толще некоторых конкурентов, например, ThinkPad P1 Gen 7. На сайте ZBook Fury 16 G11 еще тяжелее и толще, но с более быстрыми процессором и графическим процессором, чтобы компенсировать это. HP предлагает более тонкий ZBook Firefly 16 если пользователям нужен более портативный вариант.
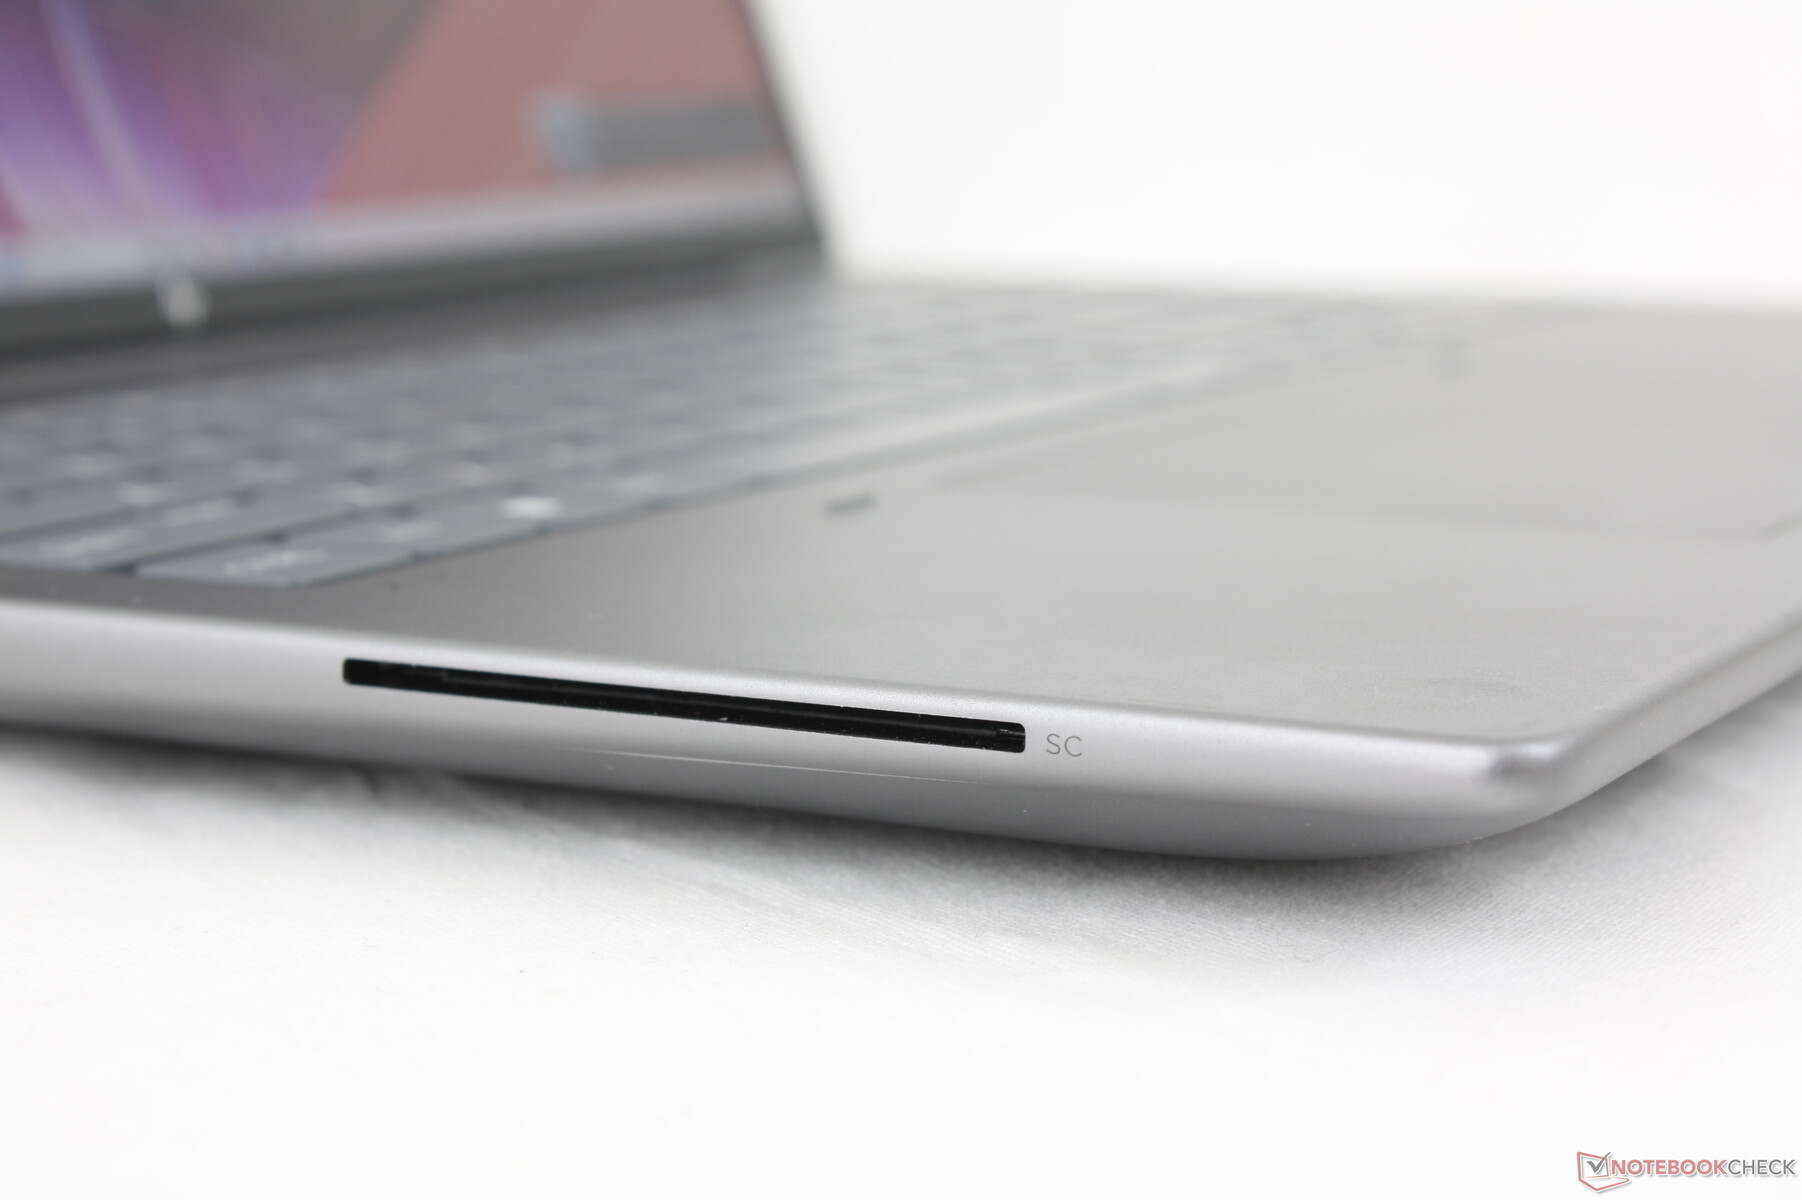
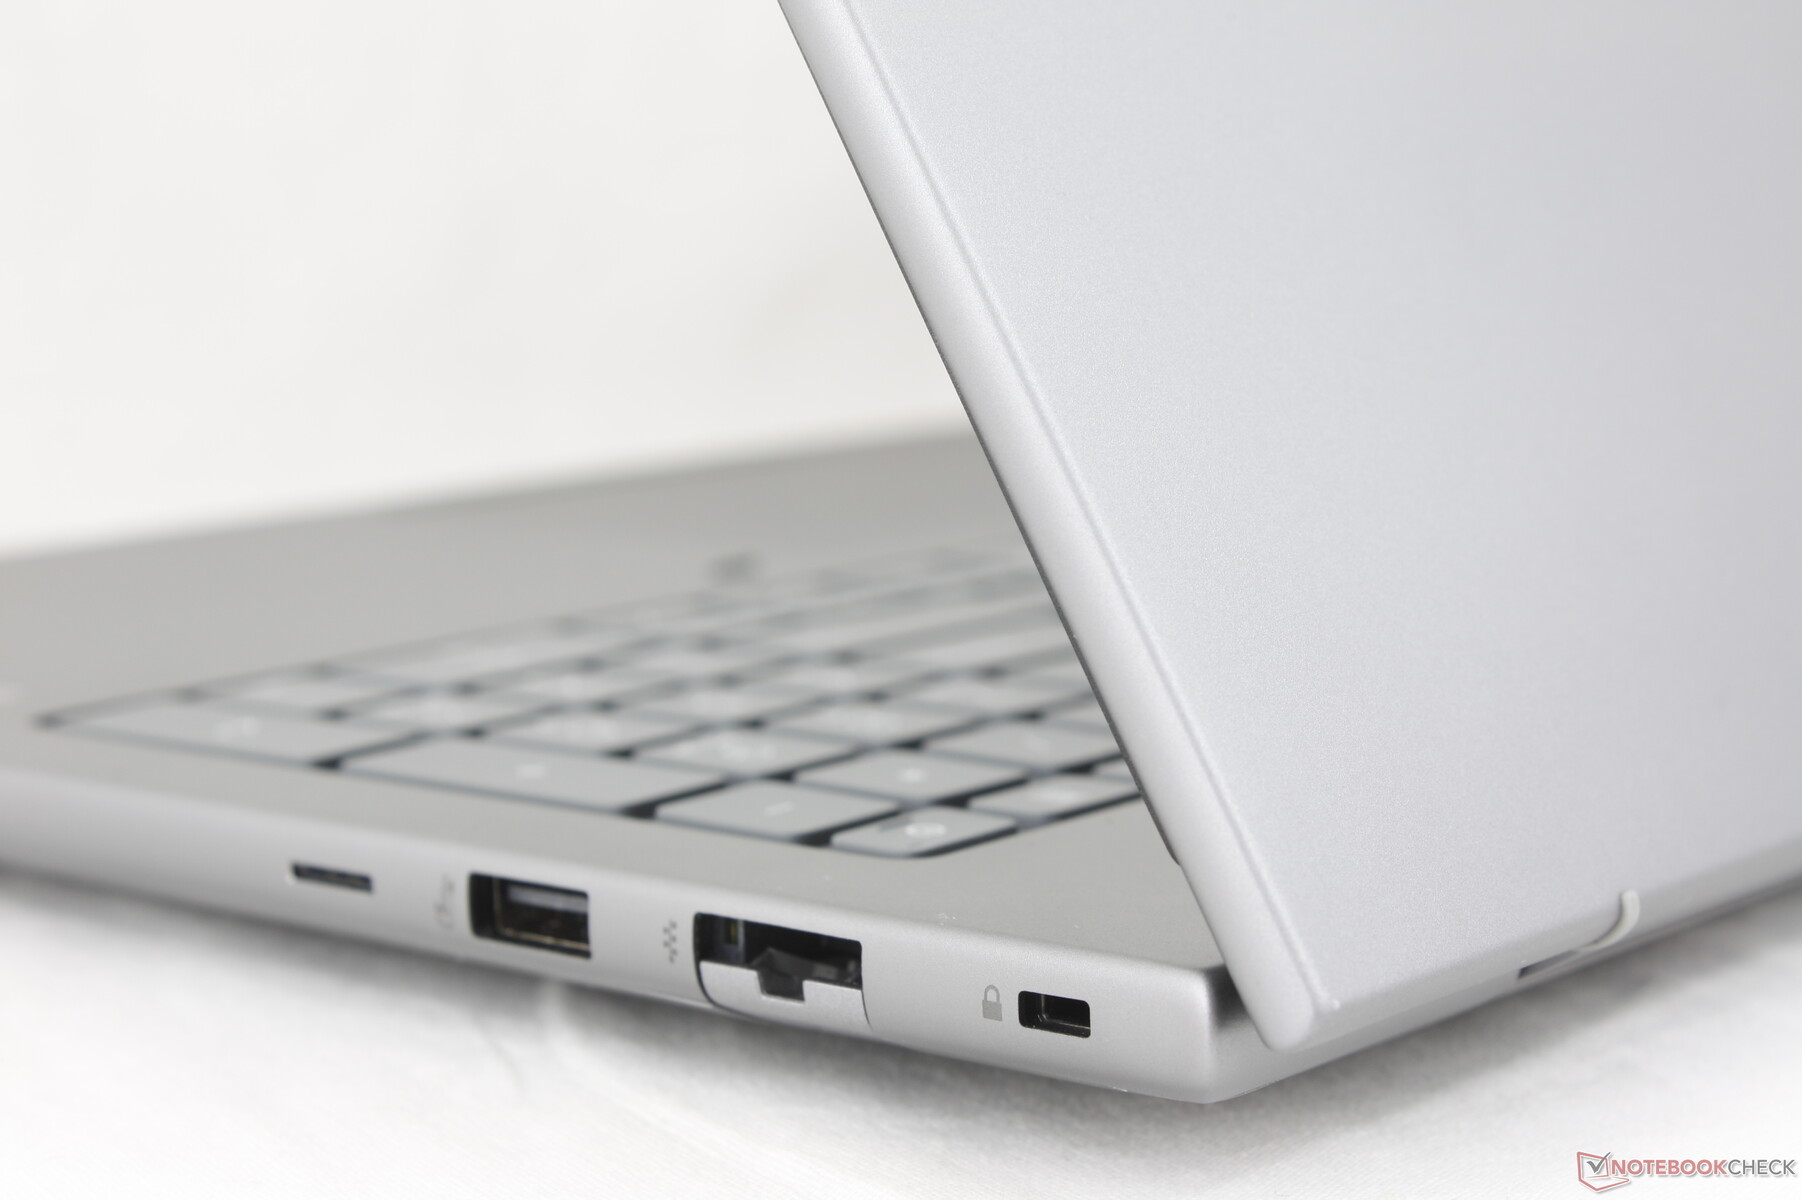
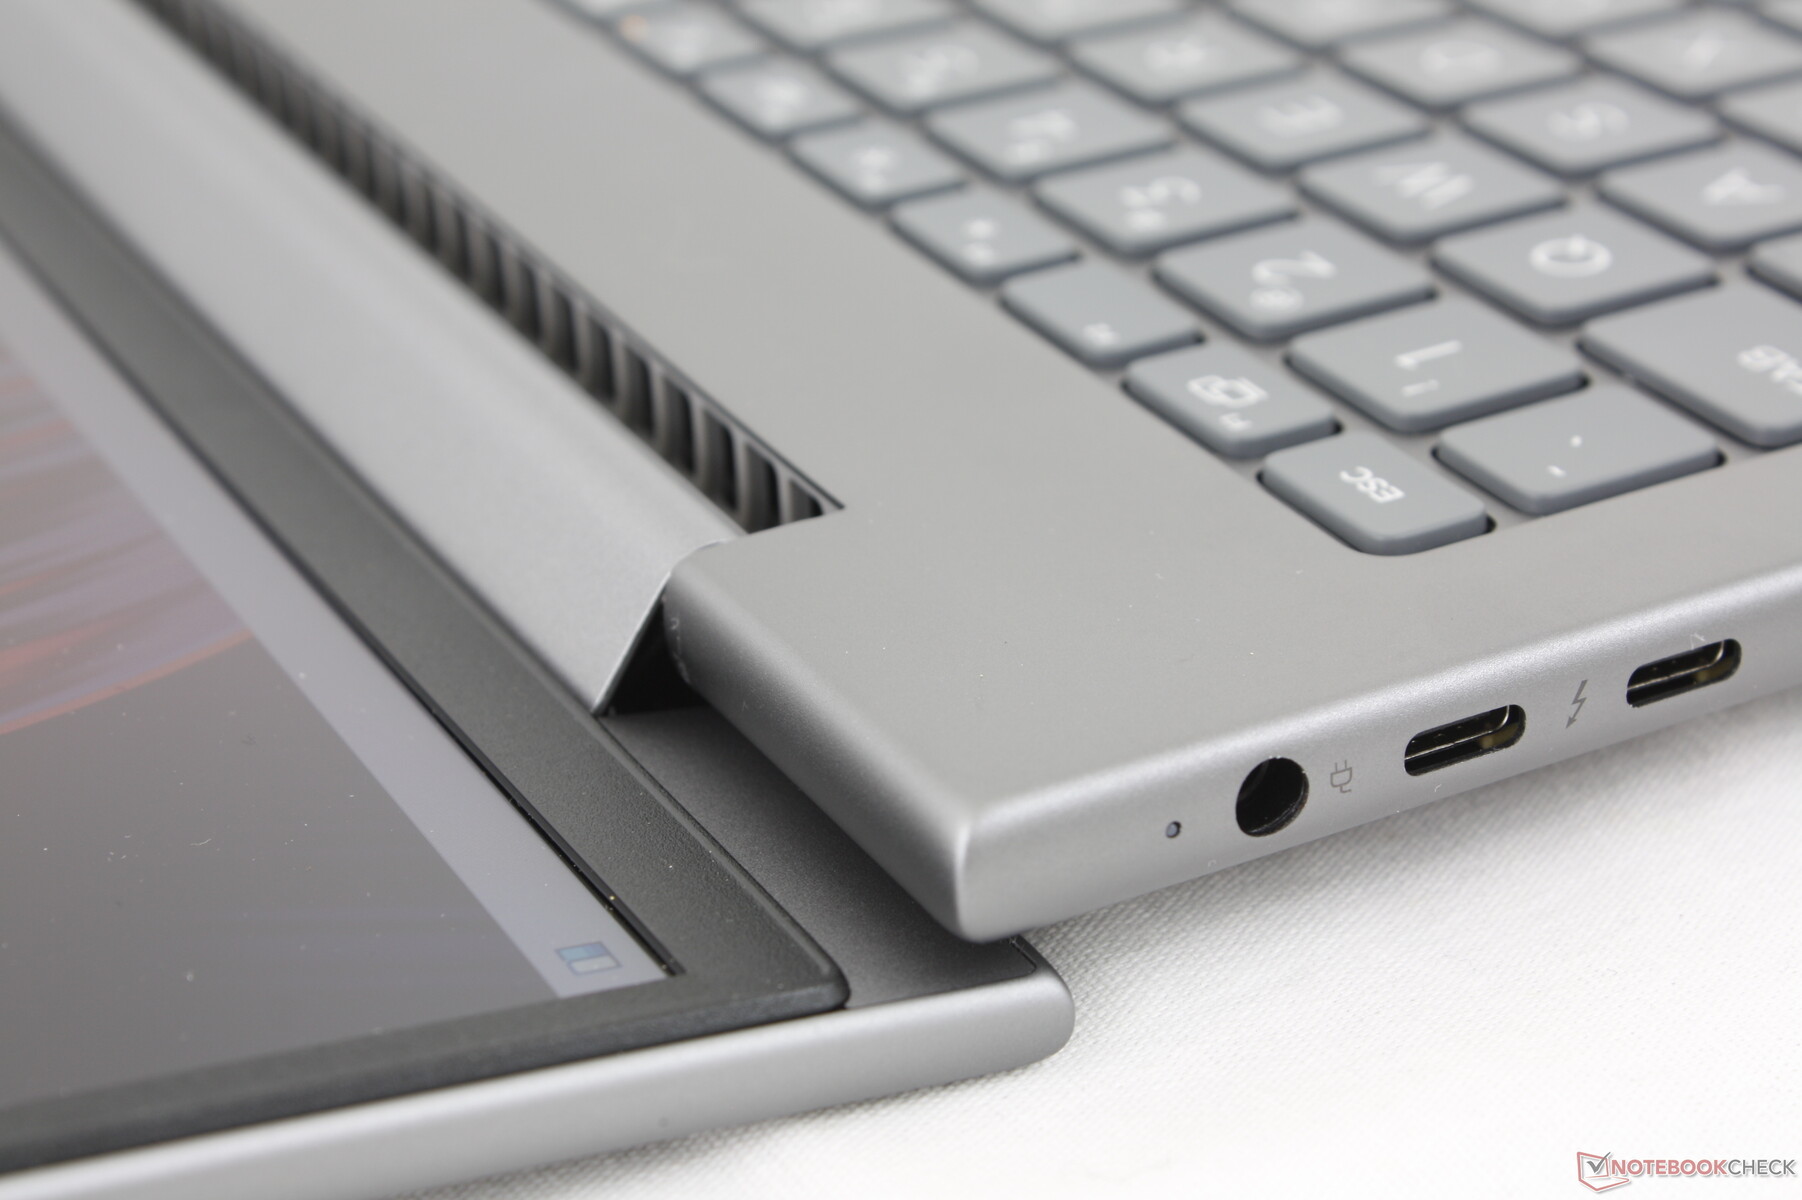
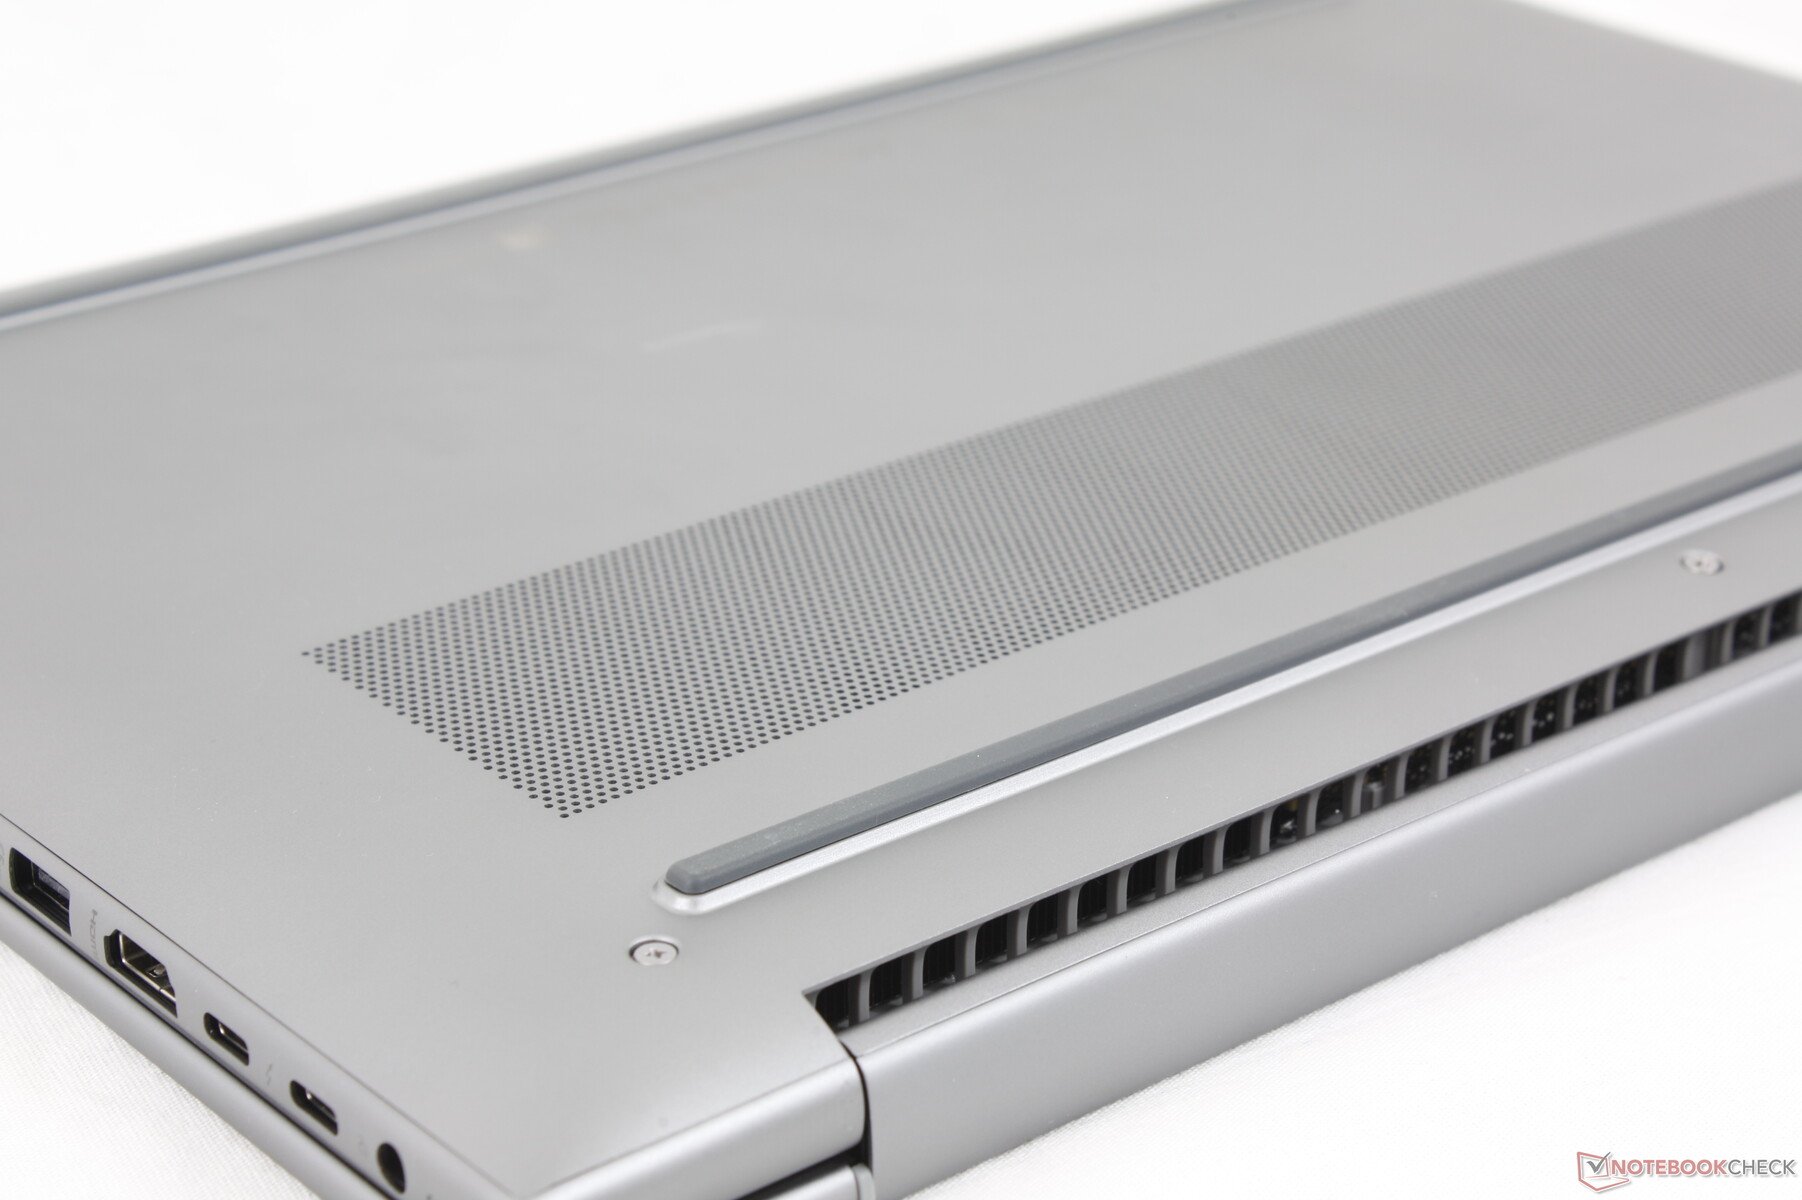
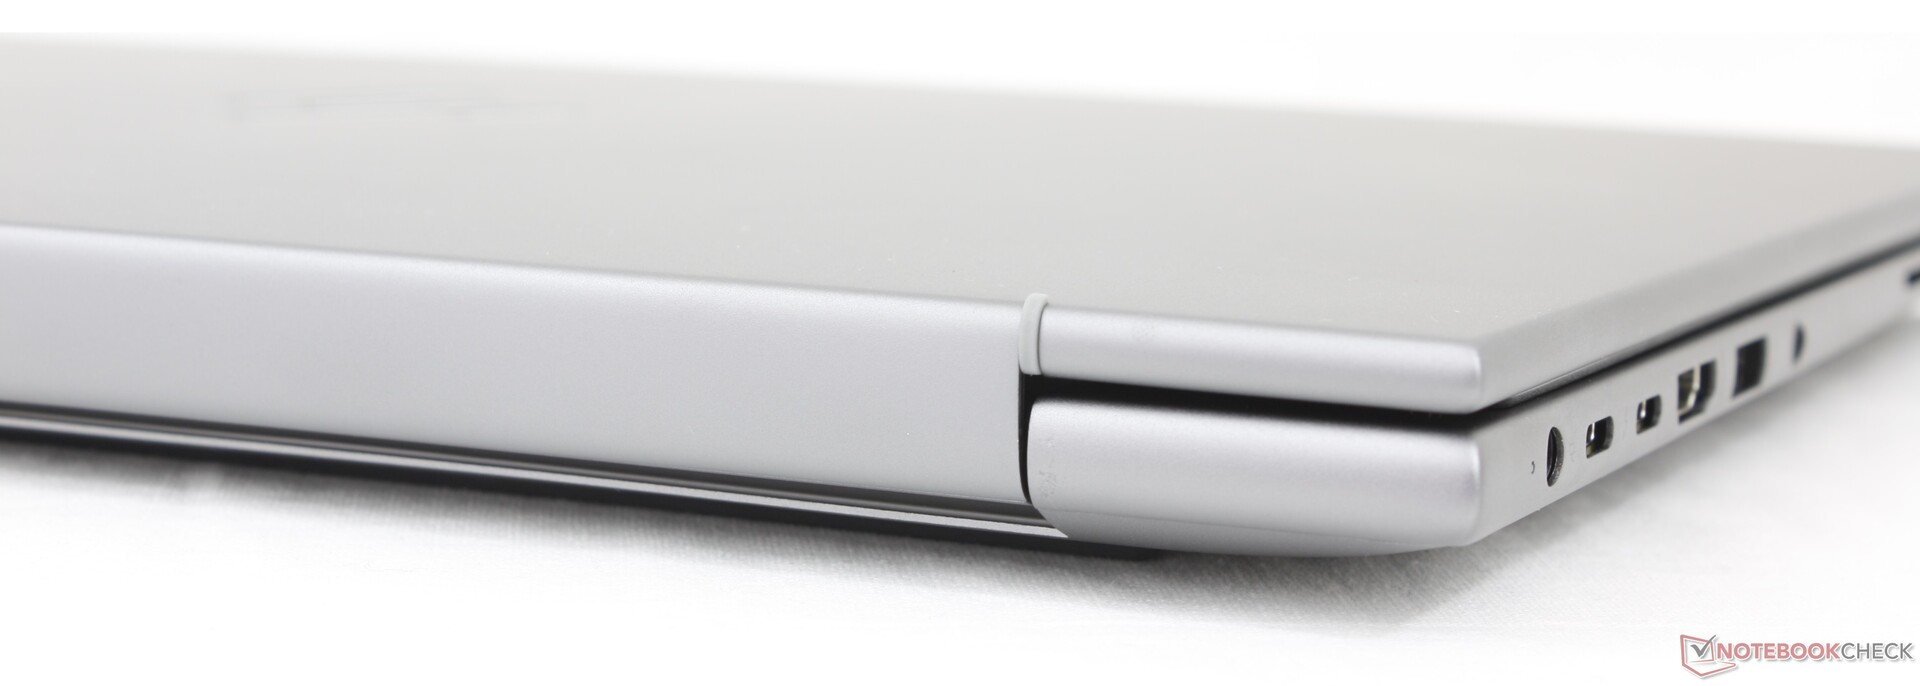
Оснащение - Порты Thunderbolt 4
В этой модели меньше портов USB-A, чем в прошлогоднем ZBook Power 15 G10. Все остальное вернулось, включая устройство чтения смарт-карт и два порта USB-C Thunderbolt 4, хотя и переставлено. В частности, порты вдоль левого края расположены слишком тесно, и их можно было бы распределить немного шире.
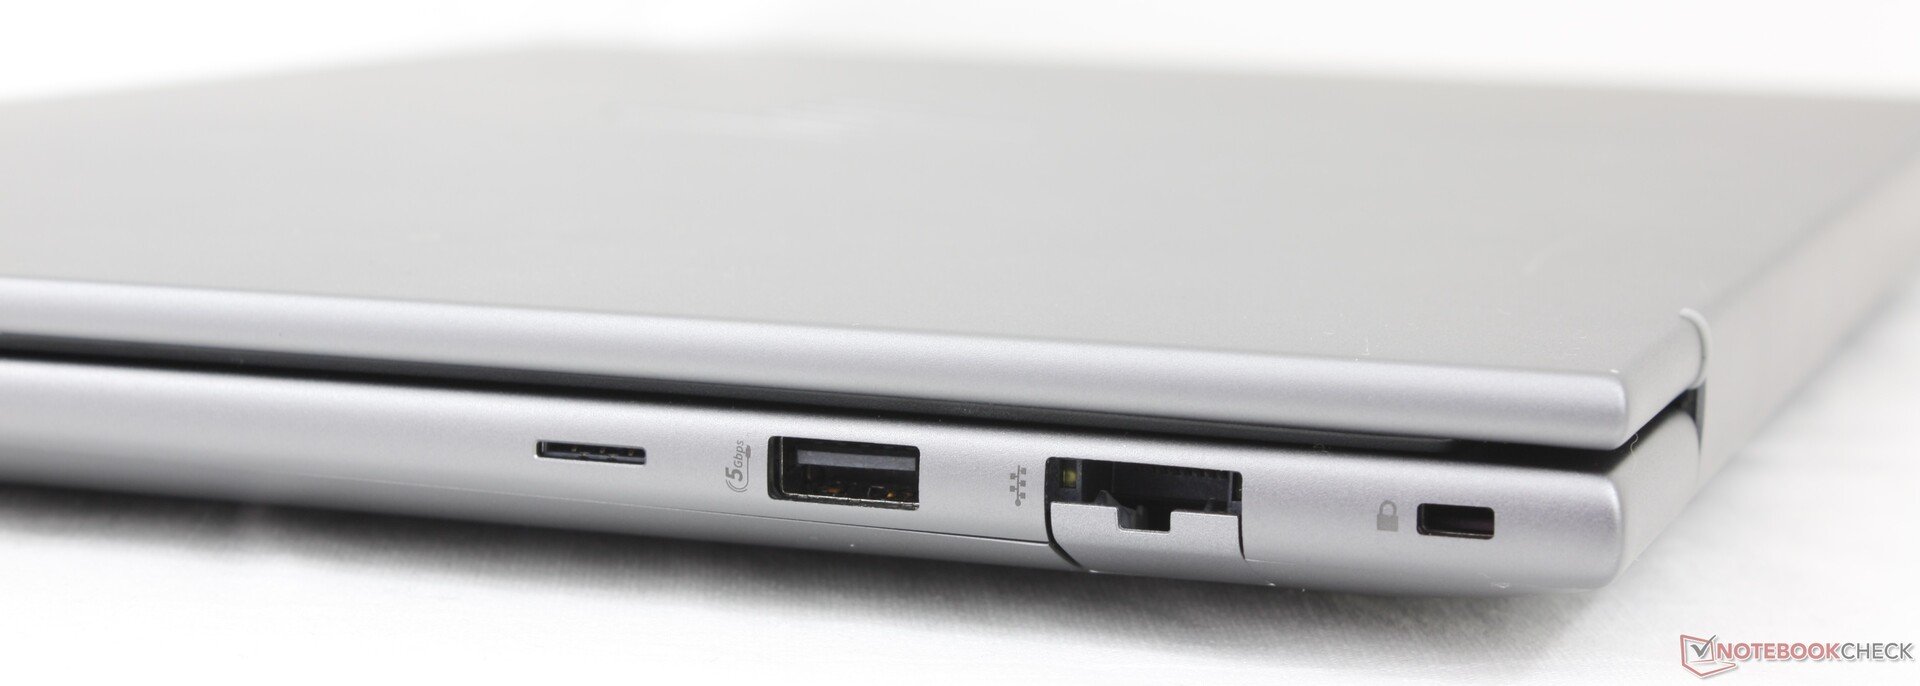

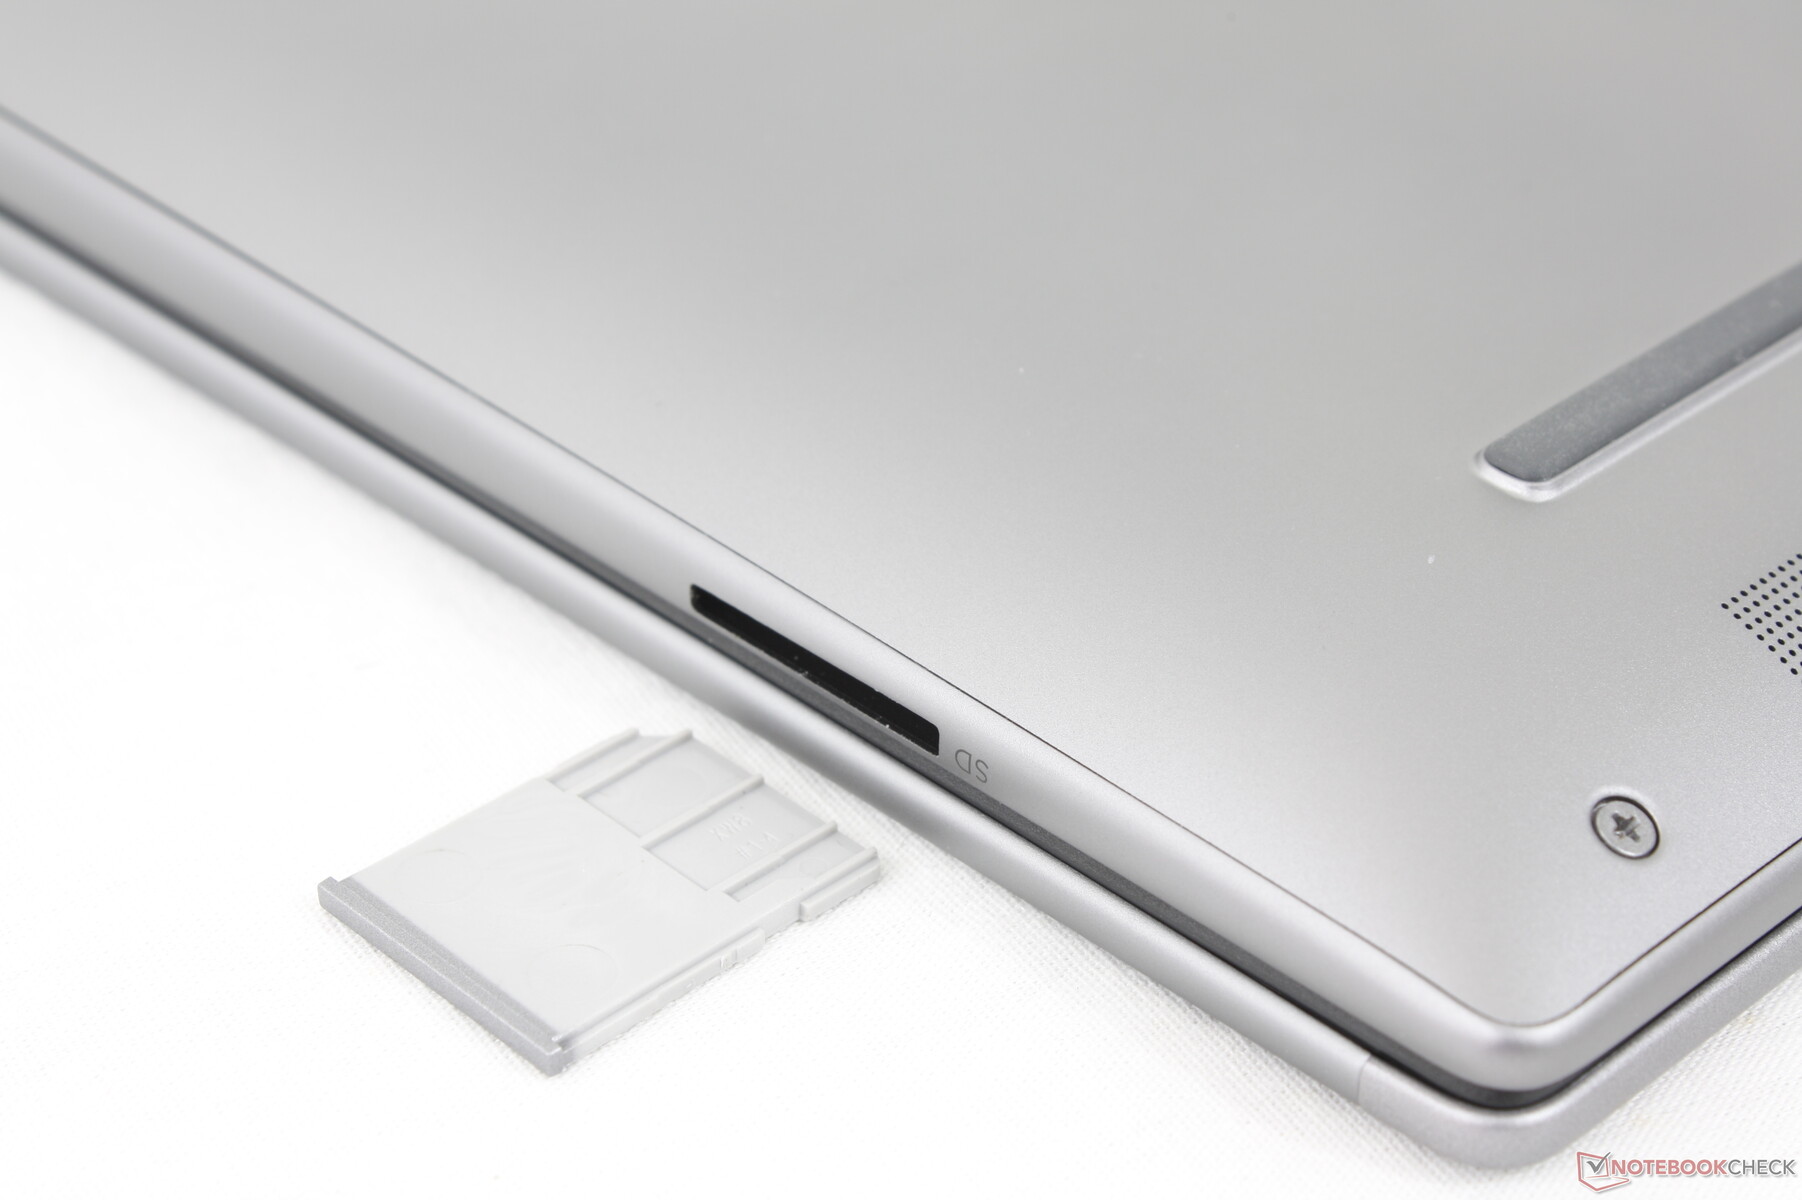
Картридер
В эту модель встроен кардридер MicroSD, тогда как в ZBook Power 15 G10 эта функция отсутствовала. Скорость передачи данных очень высока; перемещение 1 ГБ фотографий с нашей тестовой карты UHS-II занимает менее 6 секунд по сравнению с 12 секундами на ZBook Fury 16 G11 или ThinkPad P1 Gen 7.
| SD Card Reader | |
| average JPG Copy Test (av. of 3 runs) | |
| HP ZBook Power 16 G11 A (Toshiba Exceria Pro SDXC 64 GB UHS-II) | |
| HP ZBook Fury 16 G11 (Toshiba Exceria Pro SDXC 64 GB UHS-II) | |
| Lenovo ThinkPad P1 Gen 7 21KV001SGE (AV Pro V60) | |
| maximum AS SSD Seq Read Test (1GB) | |
| HP ZBook Power 16 G11 A (Toshiba Exceria Pro SDXC 64 GB UHS-II) | |
| HP ZBook Fury 16 G11 (Toshiba Exceria Pro SDXC 64 GB UHS-II) | |
| Lenovo ThinkPad P1 Gen 7 21KV001SGE (AV Pro V60) | |
Связь
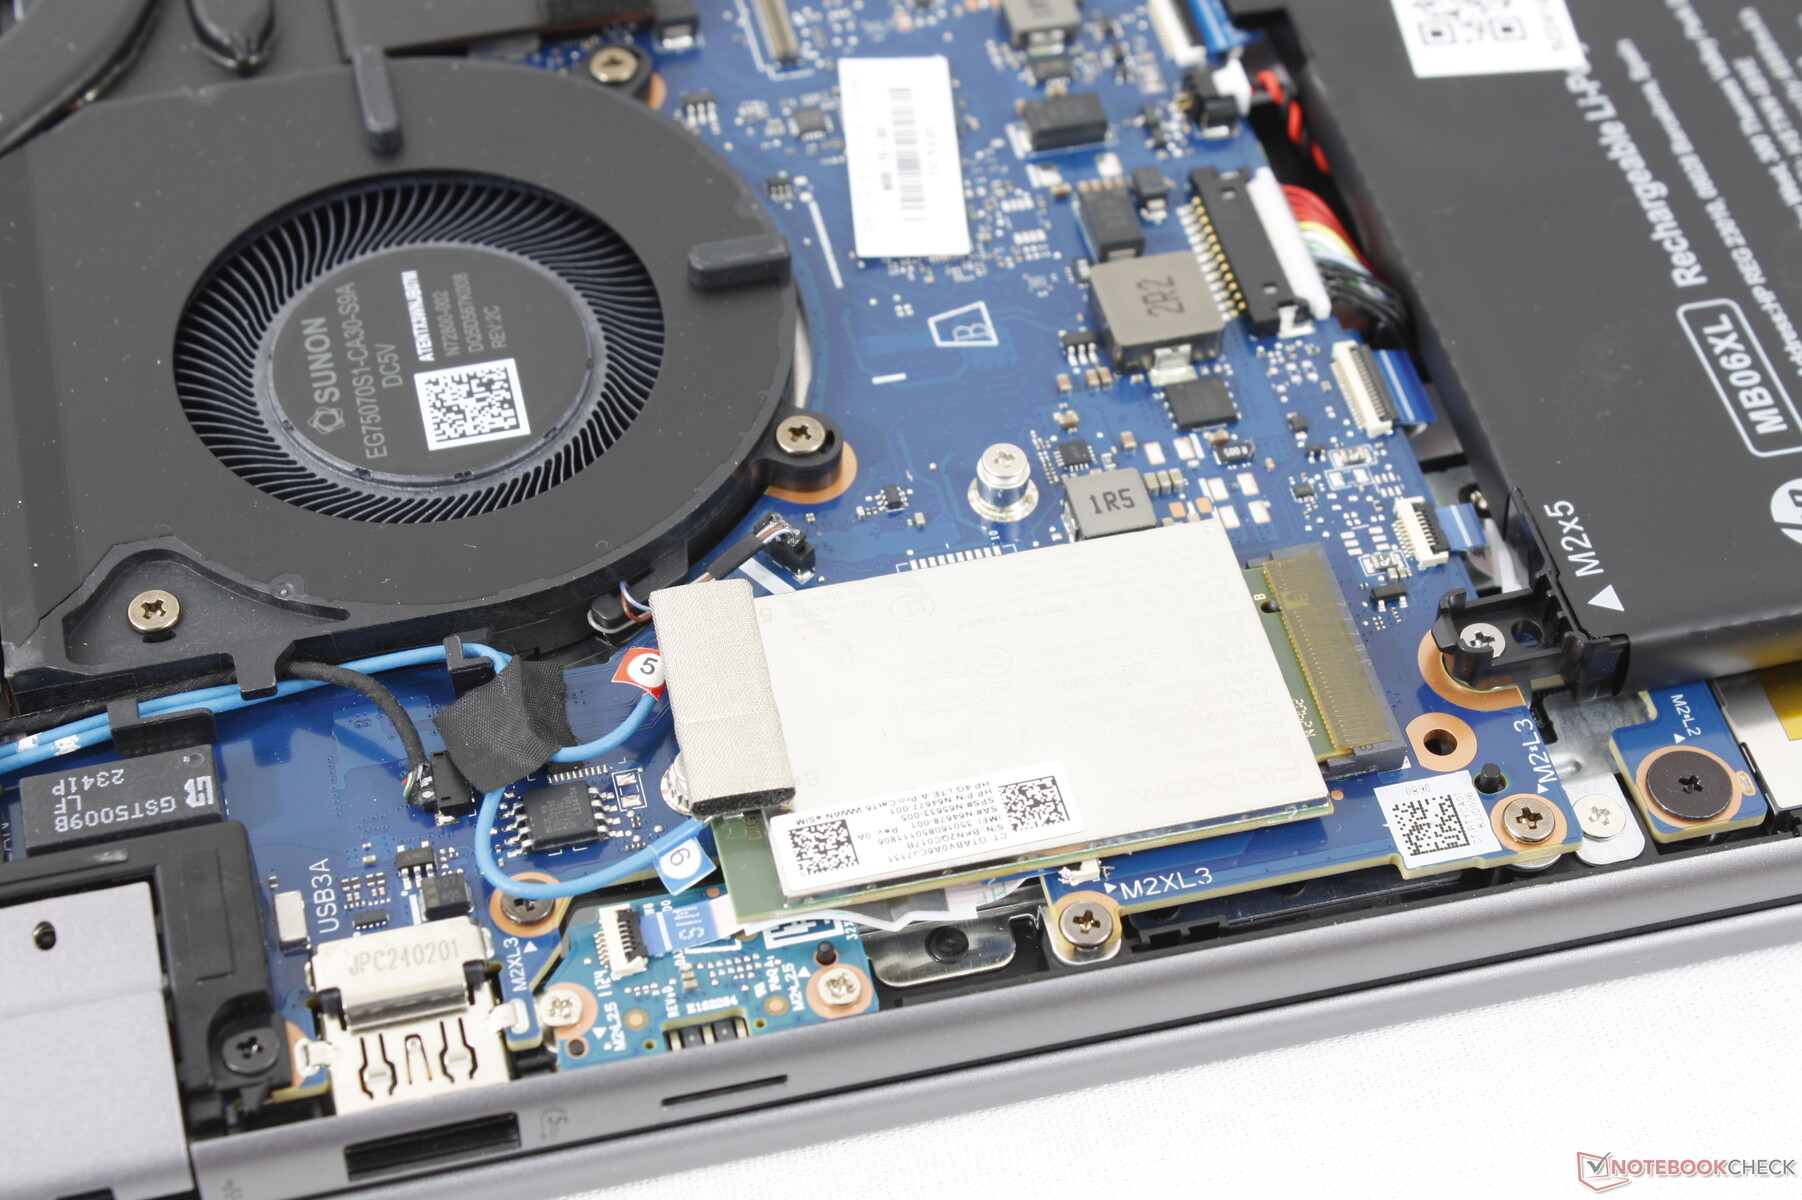
MediaTek MT7922 стандартно поддерживает Wi-Fi 6E и Bluetooth 5.2. Также доступны варианты Realtek, а также HP 4000 или Qualcomm 9205 для подключения к WAN.
| Networking | |
| iperf3 transmit AXE11000 | |
| HP ZBook Power 15 G10 | |
| Lenovo ThinkPad P1 Gen 7 21KV001SGE | |
| Dell Precision 5690 | |
| HP ZBook Power 16 G11 A | |
| HP ZBook Fury 16 G11 | |
| Lenovo ThinkPad P16s G2 21K9000CGE | |
| iperf3 receive AXE11000 | |
| Lenovo ThinkPad P1 Gen 7 21KV001SGE | |
| Lenovo ThinkPad P16s G2 21K9000CGE | |
| HP ZBook Power 15 G10 | |
| Dell Precision 5690 | |
| HP ZBook Power 16 G11 A | |
| HP ZBook Fury 16 G11 | |
| iperf3 transmit AXE11000 6GHz | |
| HP ZBook Power 15 G10 | |
| HP ZBook Fury 16 G11 | |
| Lenovo ThinkPad P1 Gen 7 21KV001SGE | |
| Dell Precision 5690 | |
| HP ZBook Power 16 G11 A | |
| Lenovo ThinkPad P16s G2 21K9000CGE | |
| iperf3 receive AXE11000 6GHz | |
| Lenovo ThinkPad P1 Gen 7 21KV001SGE | |
| Lenovo ThinkPad P16s G2 21K9000CGE | |
| HP ZBook Fury 16 G11 | |
| Dell Precision 5690 | |
| HP ZBook Power 16 G11 A | |
| HP ZBook Power 15 G10 | |
Веб-камера
В стандартную комплектацию входит 5 МП веб-камера, а также ИК-портрет и физический ползунок затвора, как у ThinkPad P16s G2. На сайте Precision 5690 поставляется с веб-камерой 2 МП с гораздо меньшим разрешением.


Обслуживание
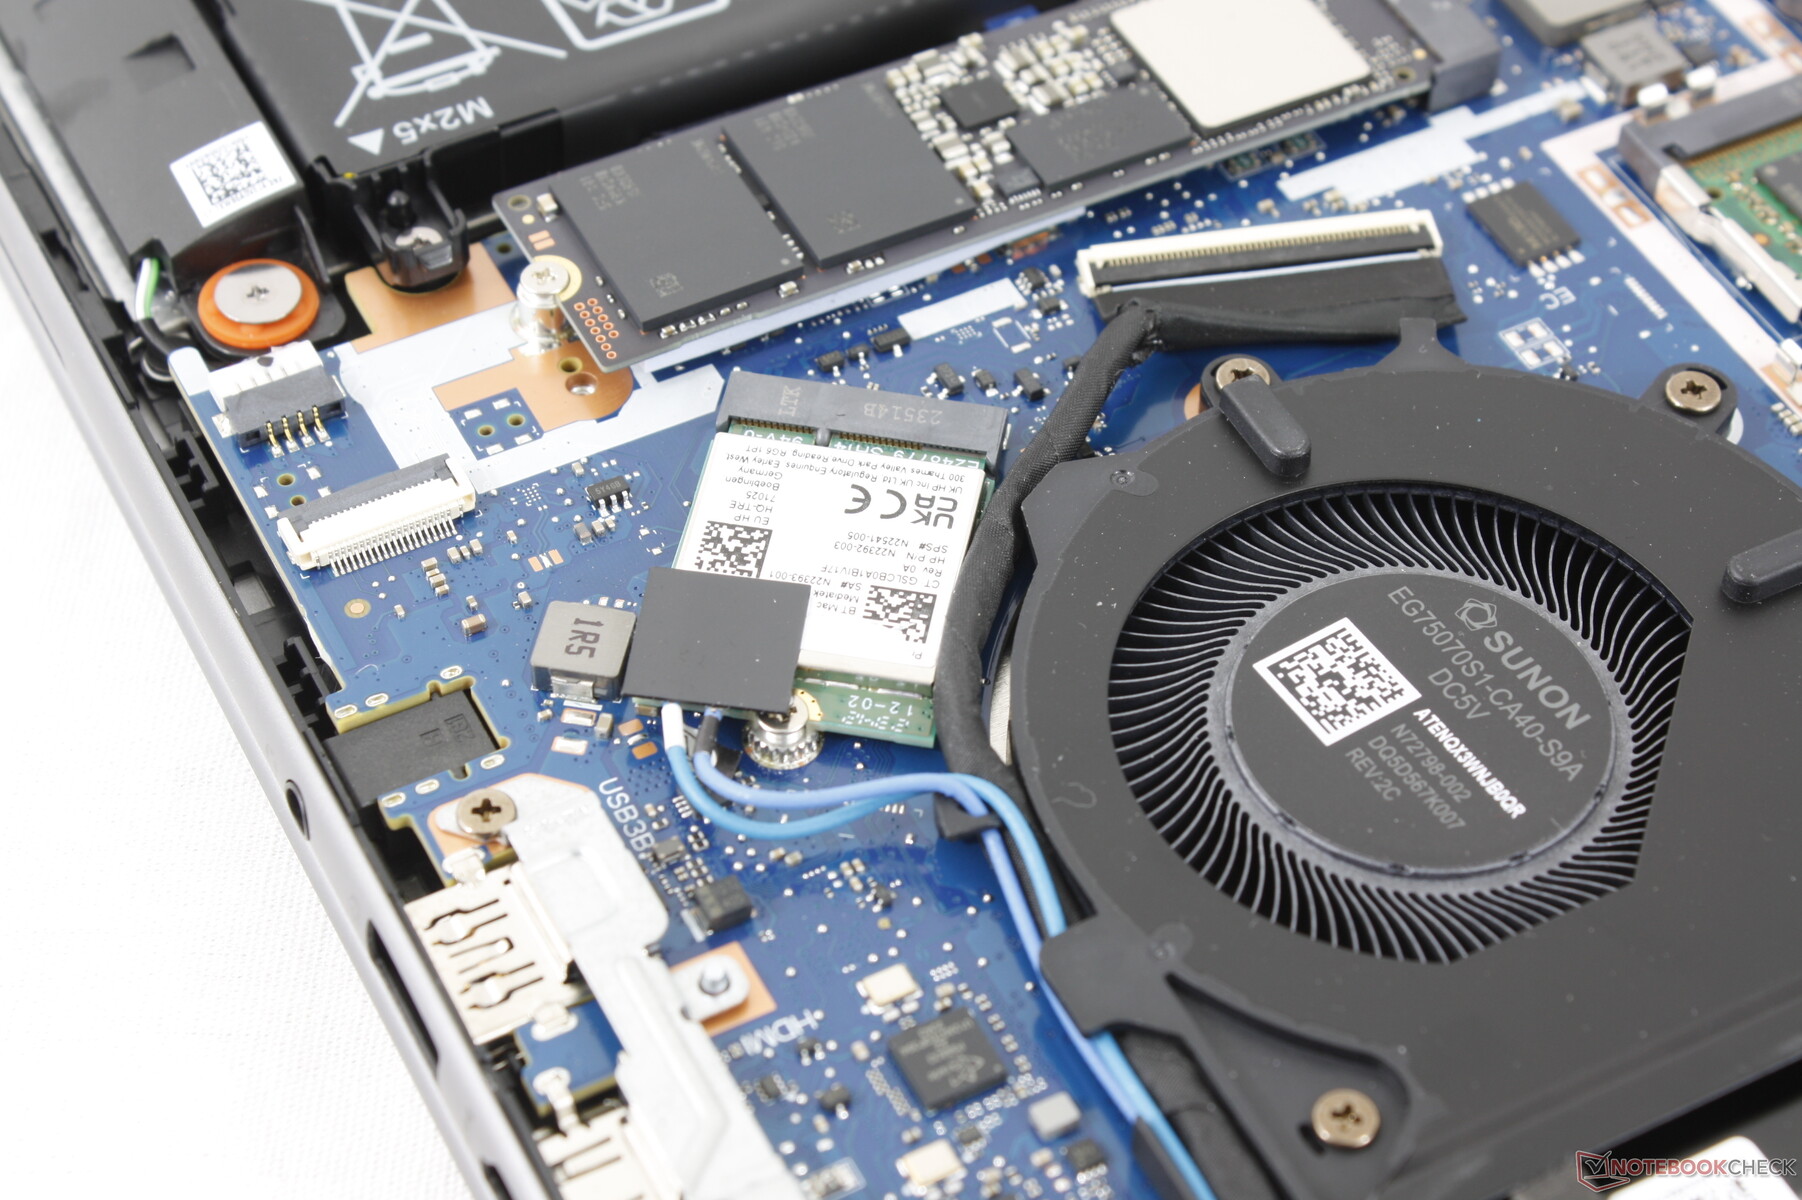
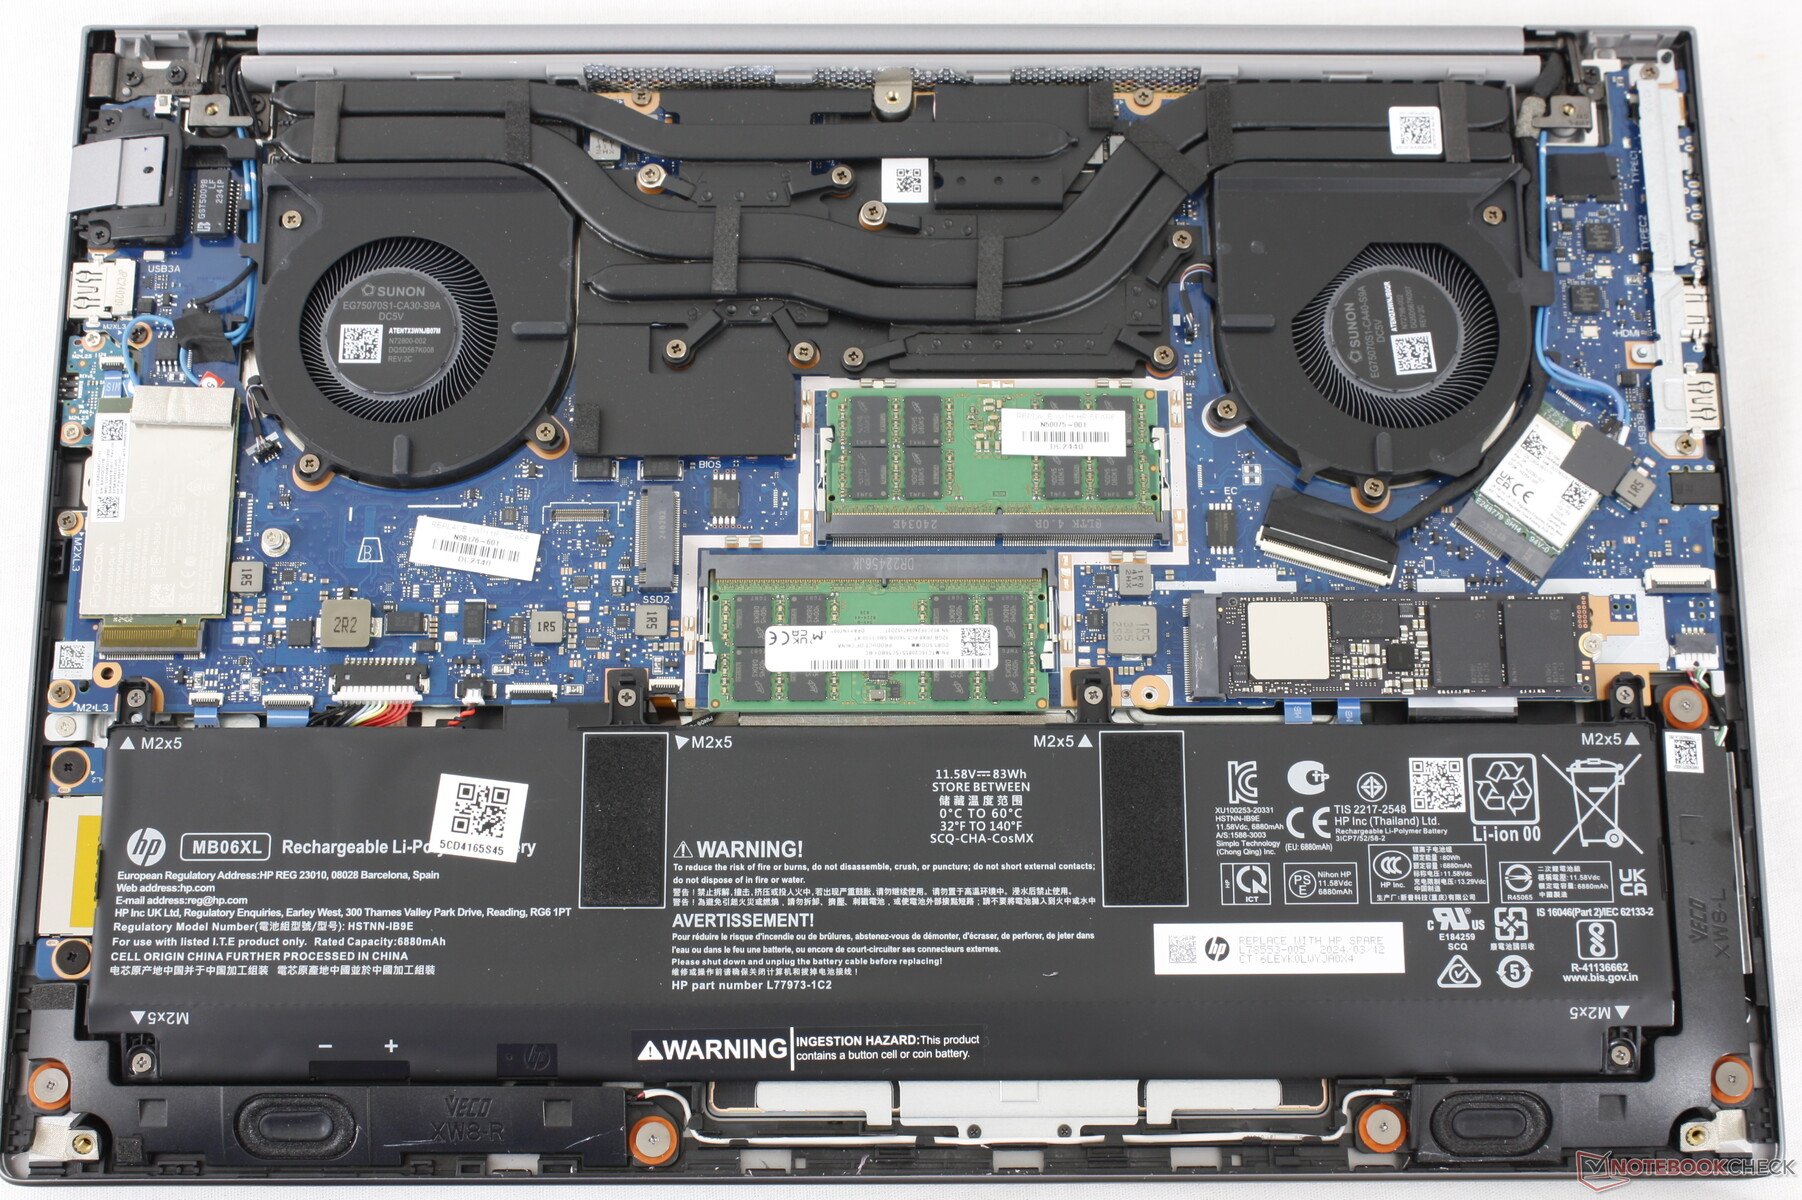
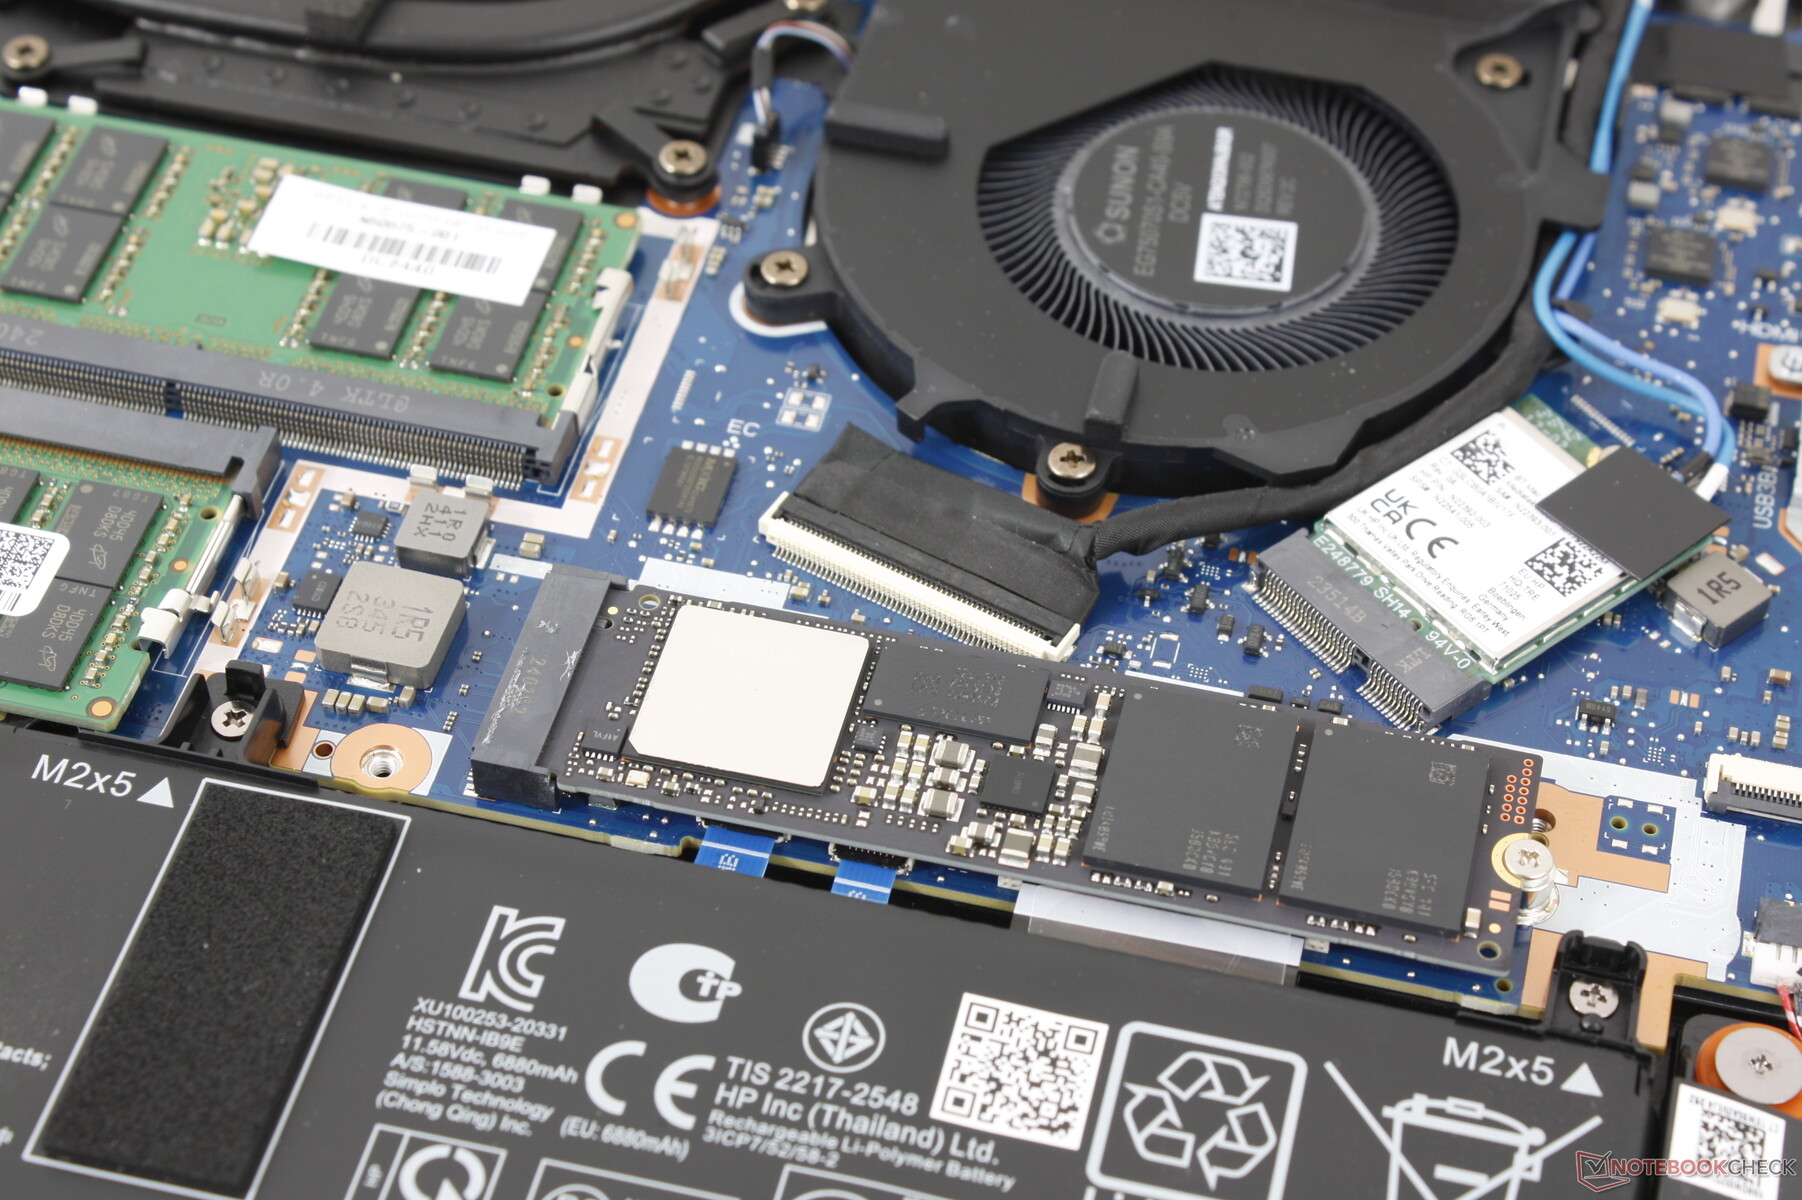
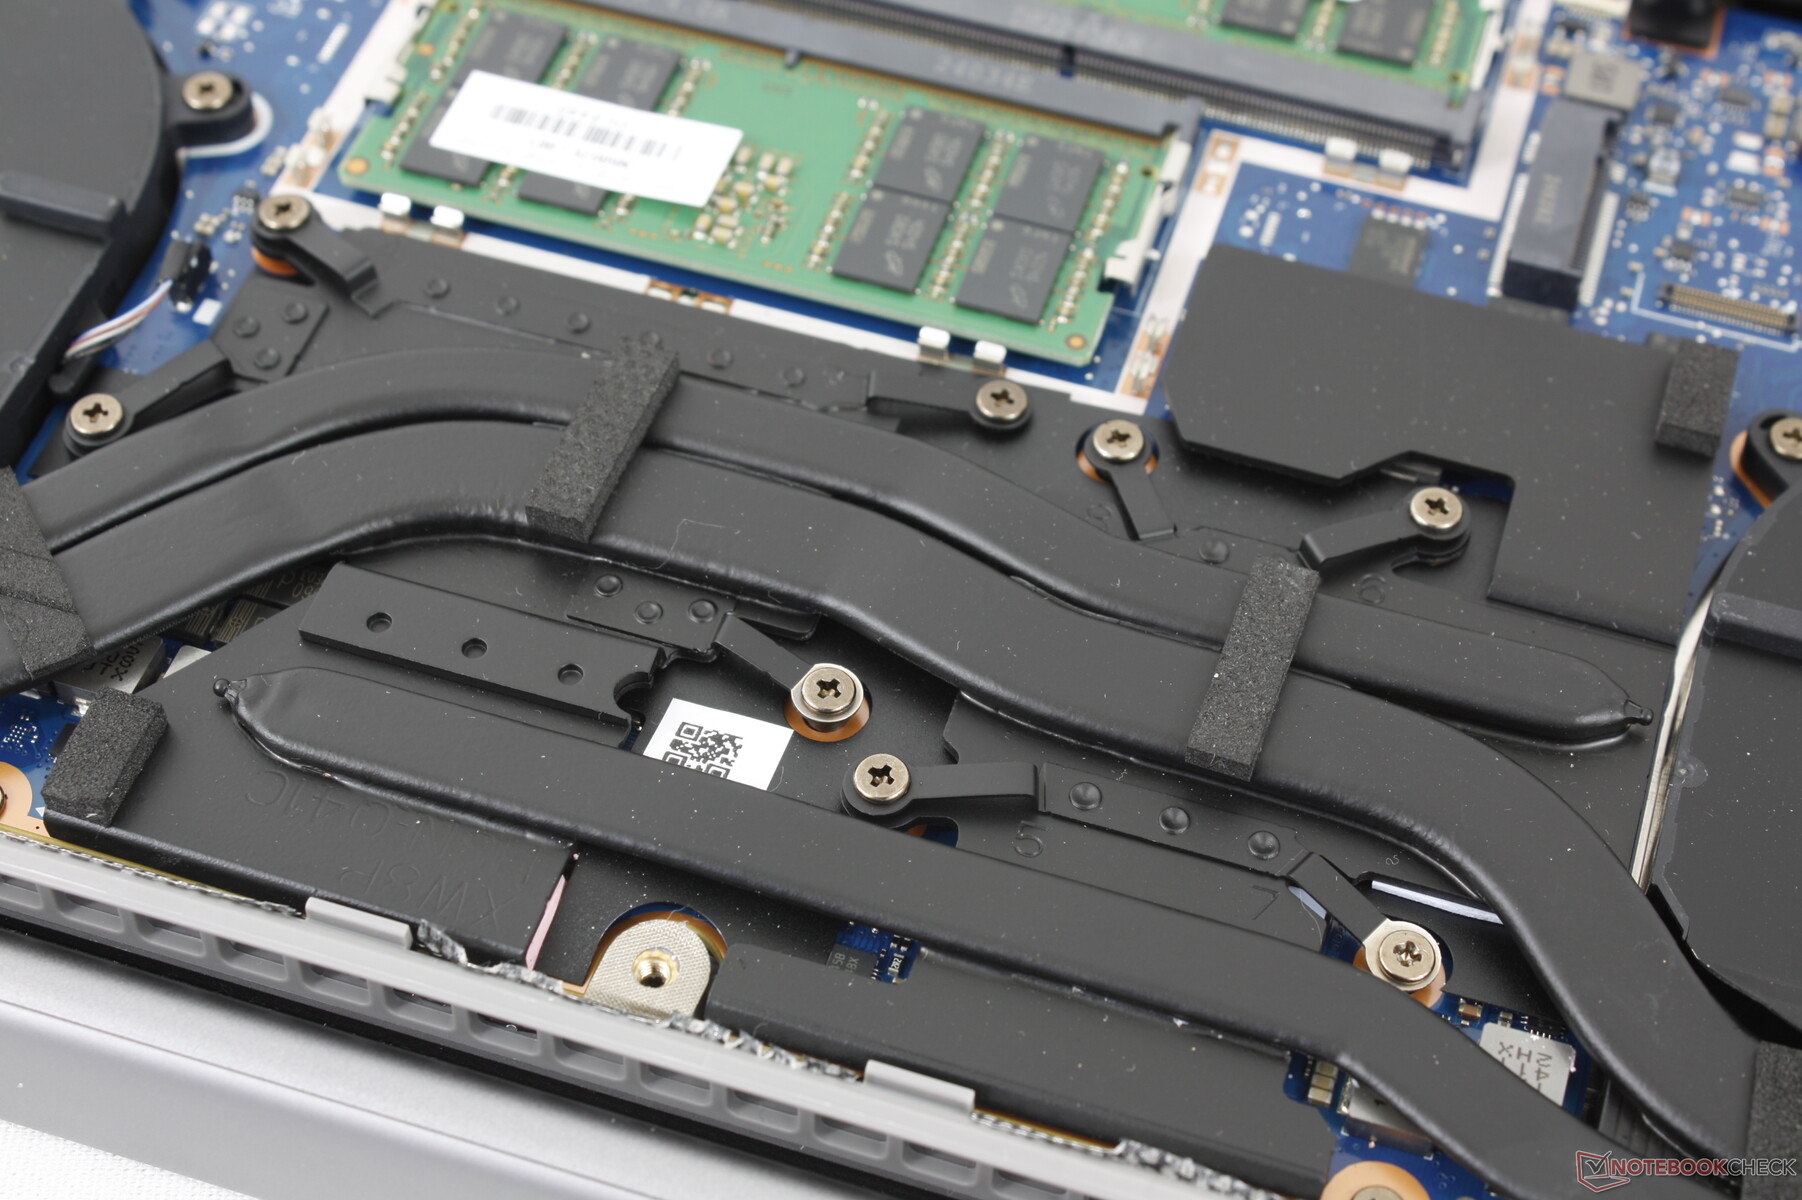
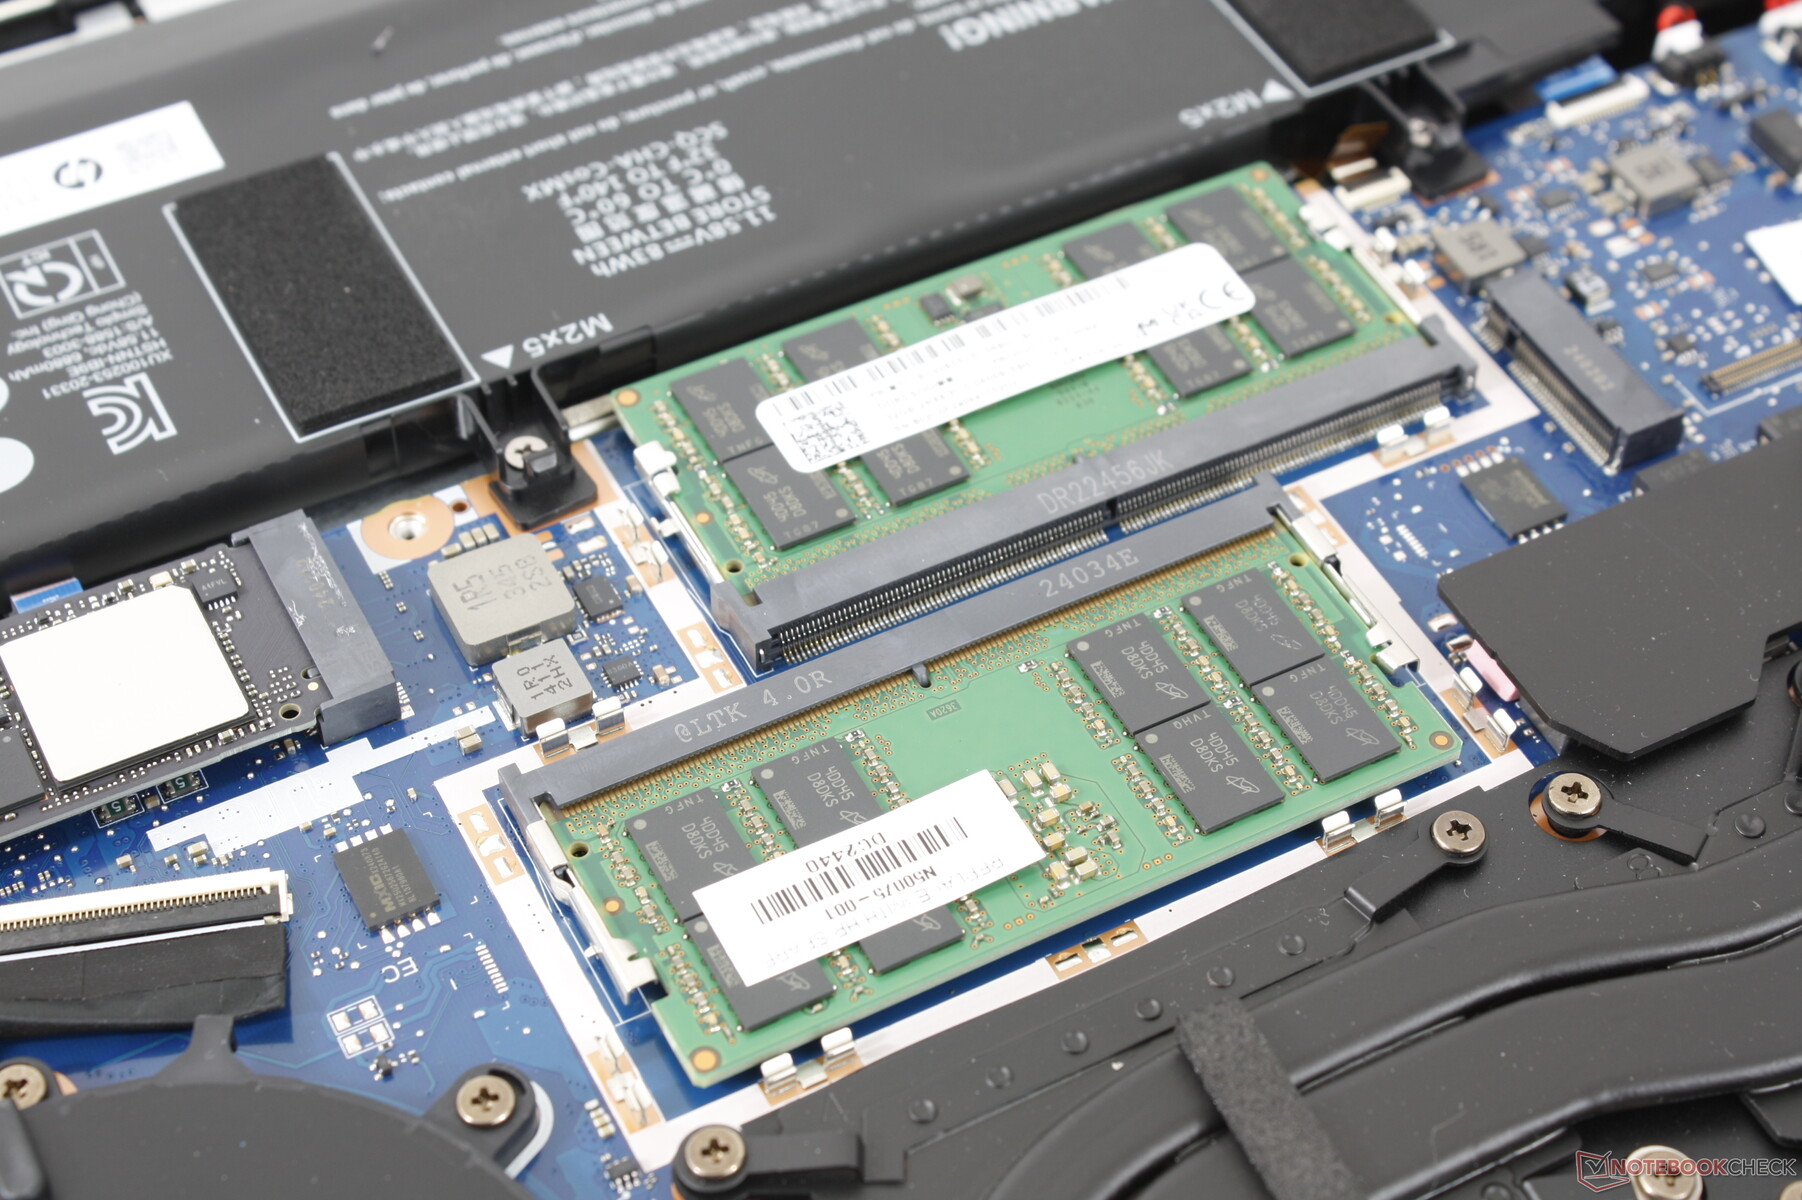
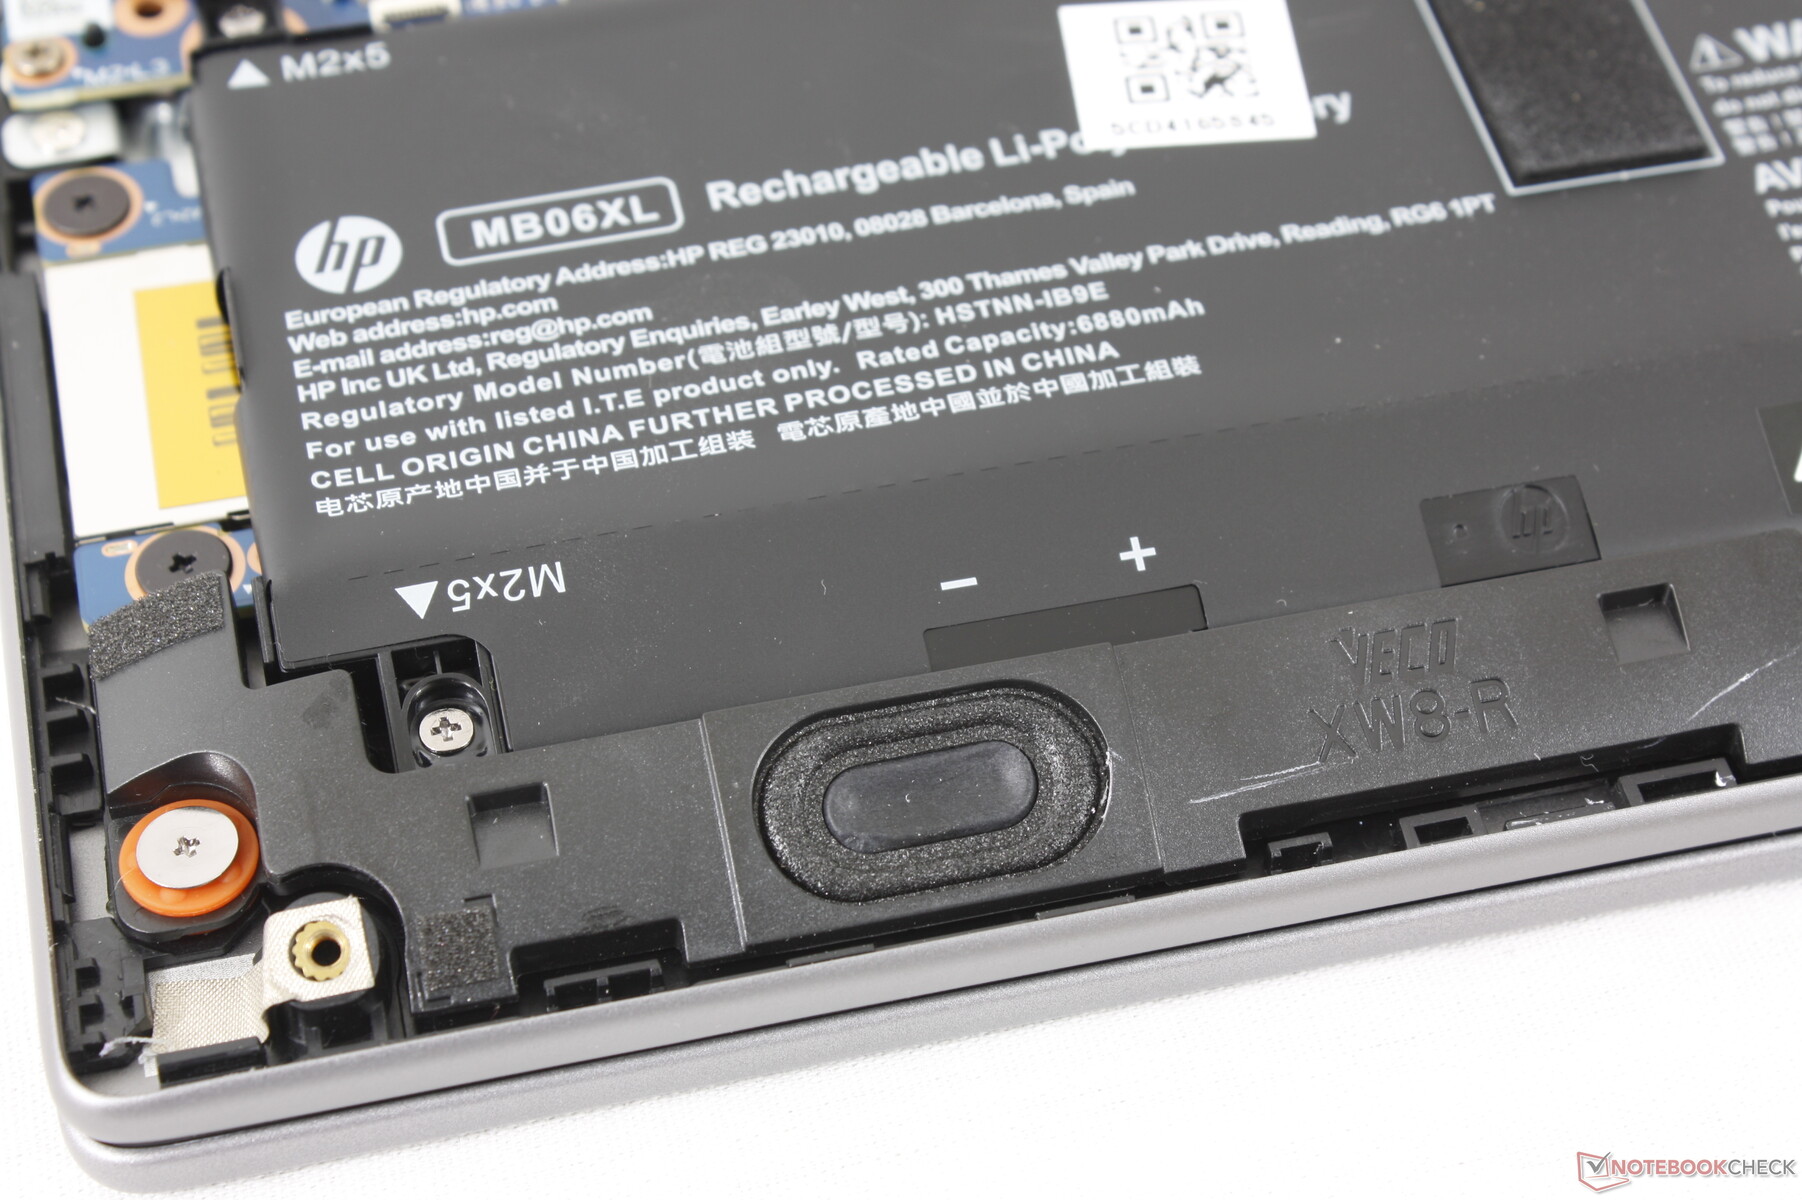
Нижняя панель снимается относительно легко, достаточно лишь крестообразной отвертки и острого края. Внутренние компоненты были полностью переработаны по сравнению с ZBook Power 15 G10, сохранив при этом те же возможности модернизации, такие как 2 слота SODIMM, 2 слота PCIe4 x4 NVMe SSD и съемный модуль WLAN. В этот раз WAN является дополнительной опцией.
Экологичность
В производстве используется низкое содержание галогенов, а упаковка состоит из формованной бумажной массы и переработанного пластика, изготовленного из 100% экологически чистых источников и 60% вторичного сырья, соответственно.
Аксессуары и гарантия
В коробке нет никаких дополнений к адаптеру переменного тока и документам. К сожалению, стандартная ограниченная гарантия составляет всего один год при покупке в США, в то время как ZBook Fury поставляется с тремя годами в стандартной комплектации.
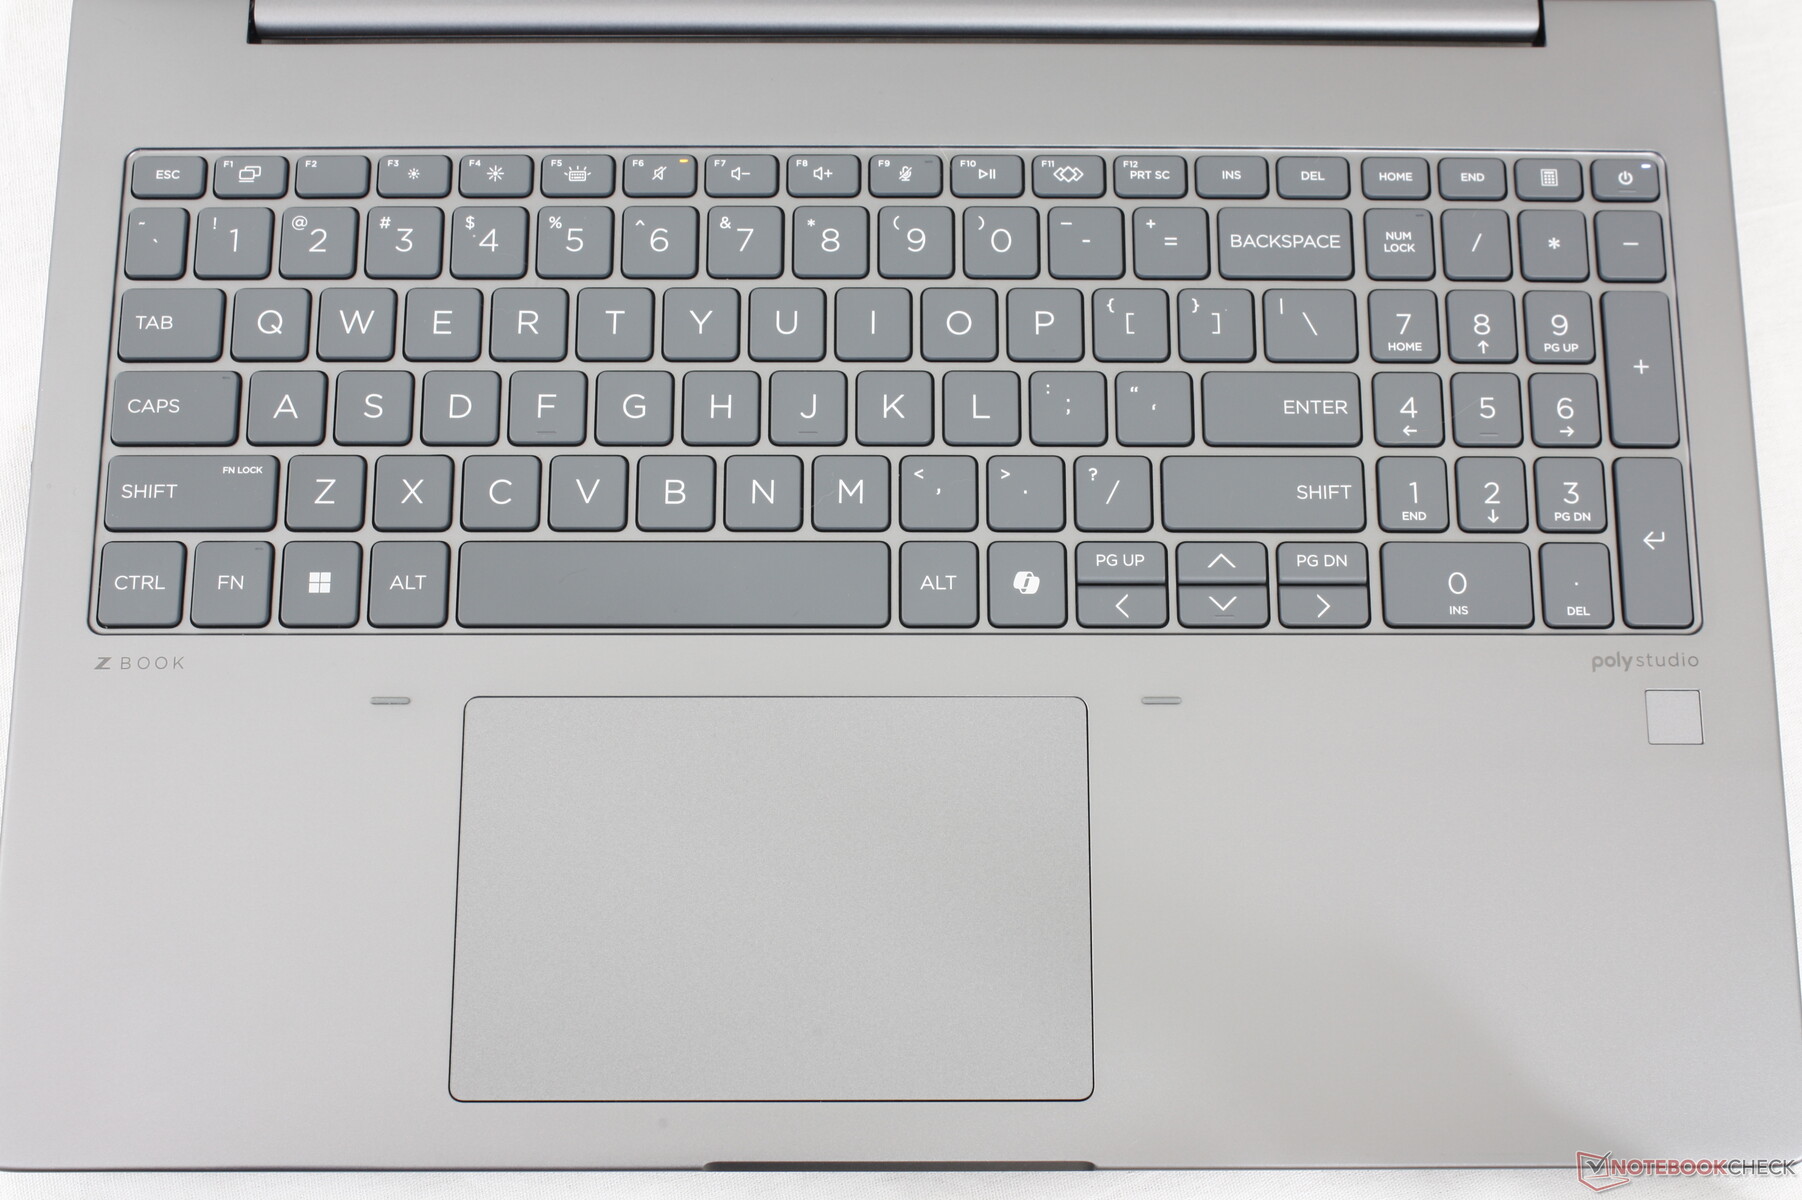
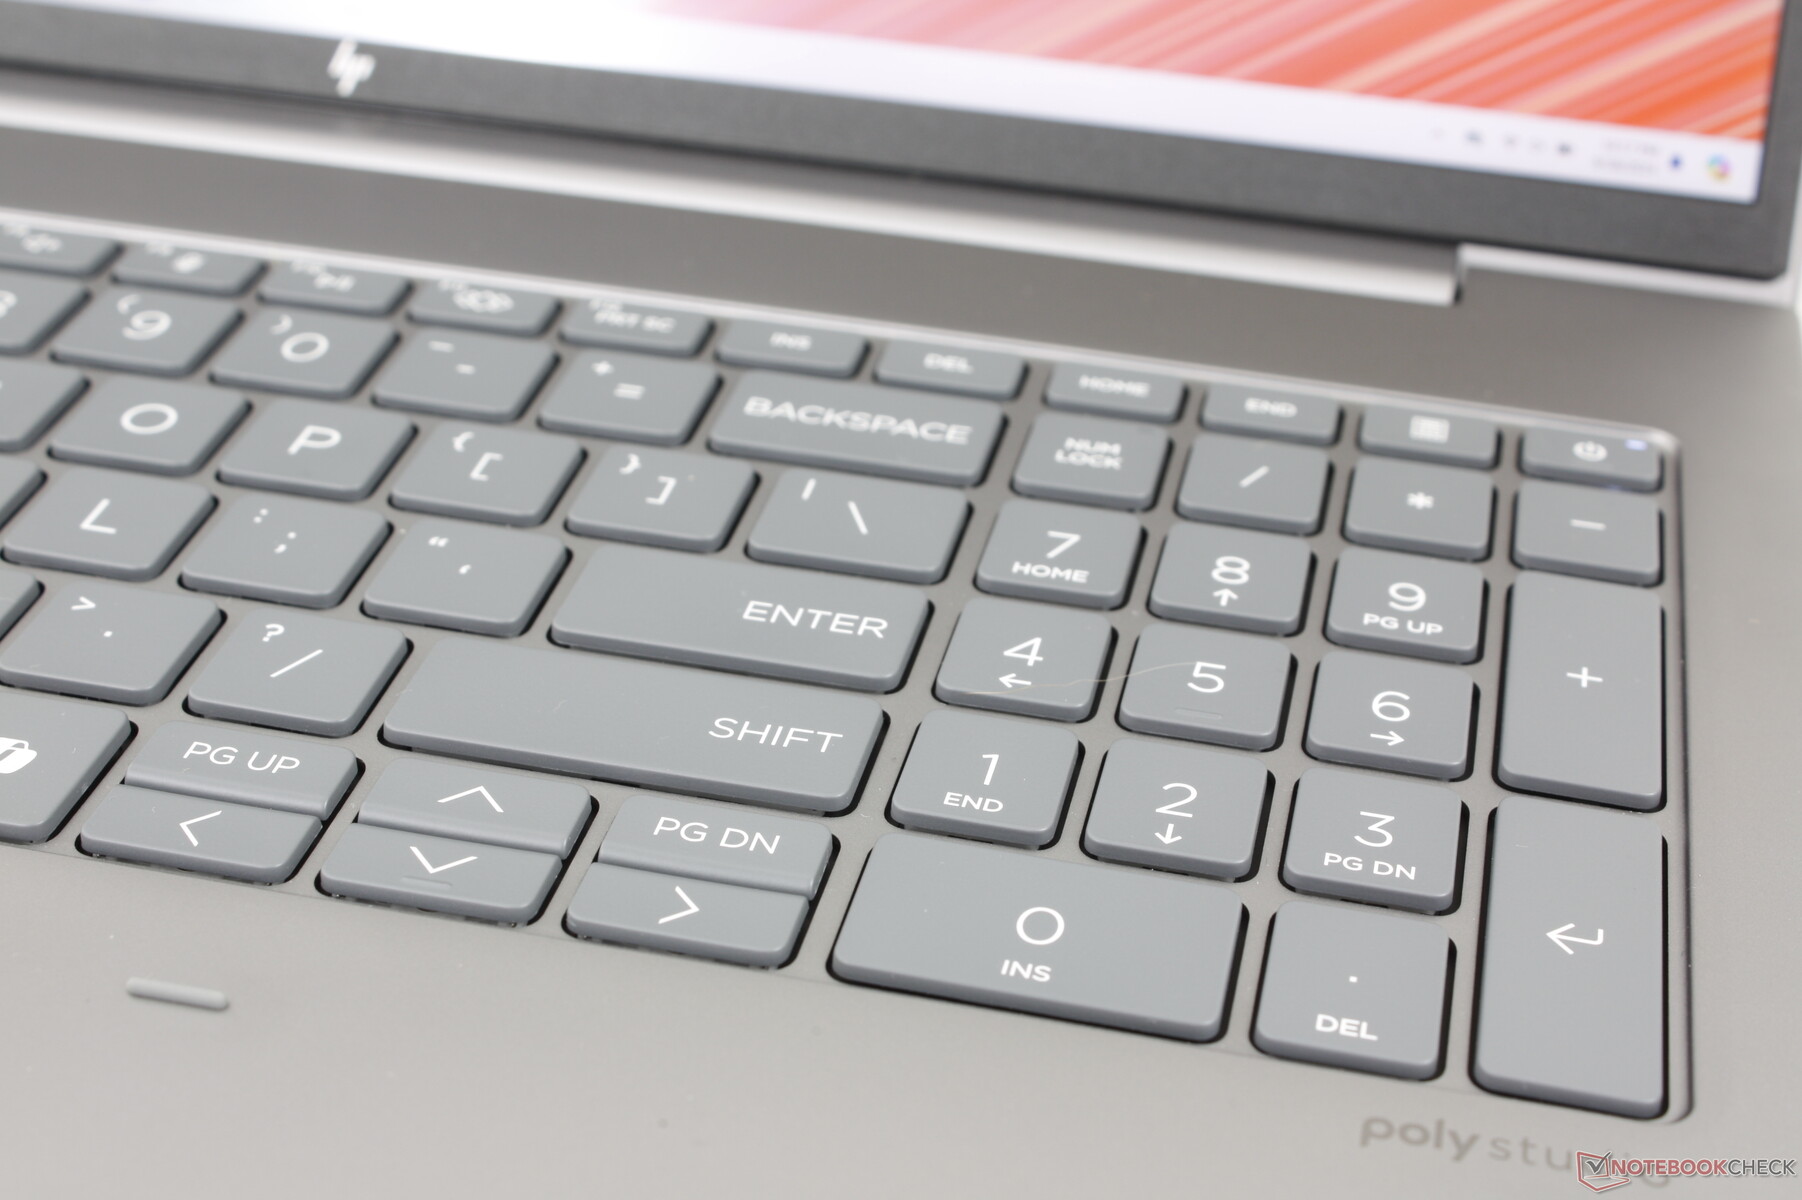
Устройства ввода - Удобные клавиши
Клавиатура
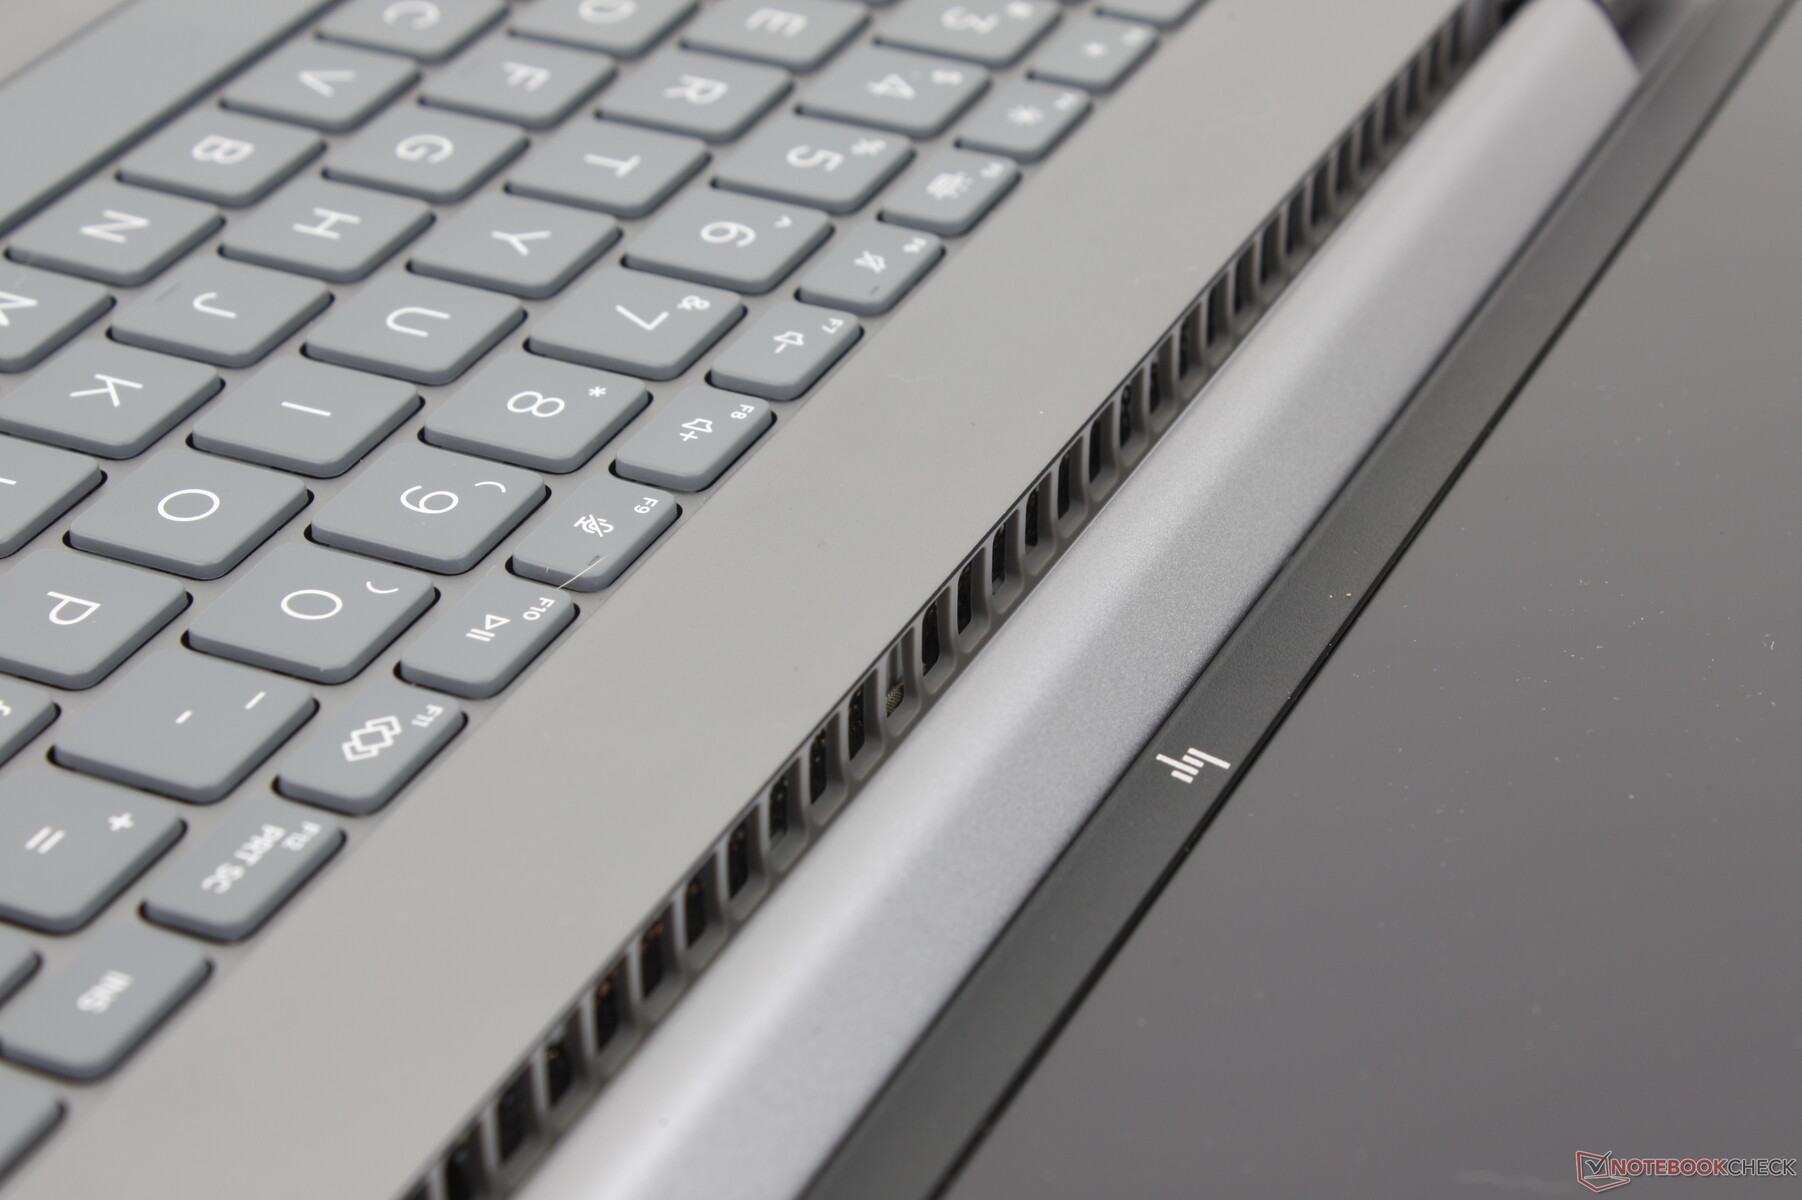
Ощущения при наборе текста похожи на Spectre x360 16 клавиши упругие, с относительно четкой обратной связью, что делает их удобными для набора текста. Ход клавиш, в частности, более глубокий, чем на большинстве ультрабуков, что позволяет избежать типичной неглубокой или губчатой отдачи.
Нумпад вернулся, тогда как на конкурирующих моделях он отсутствовал Precision 5690. Однако его клавиши немного уже, чем основные QWERTY-клавиши, и поэтому отдача при нажатии заметно мягче.
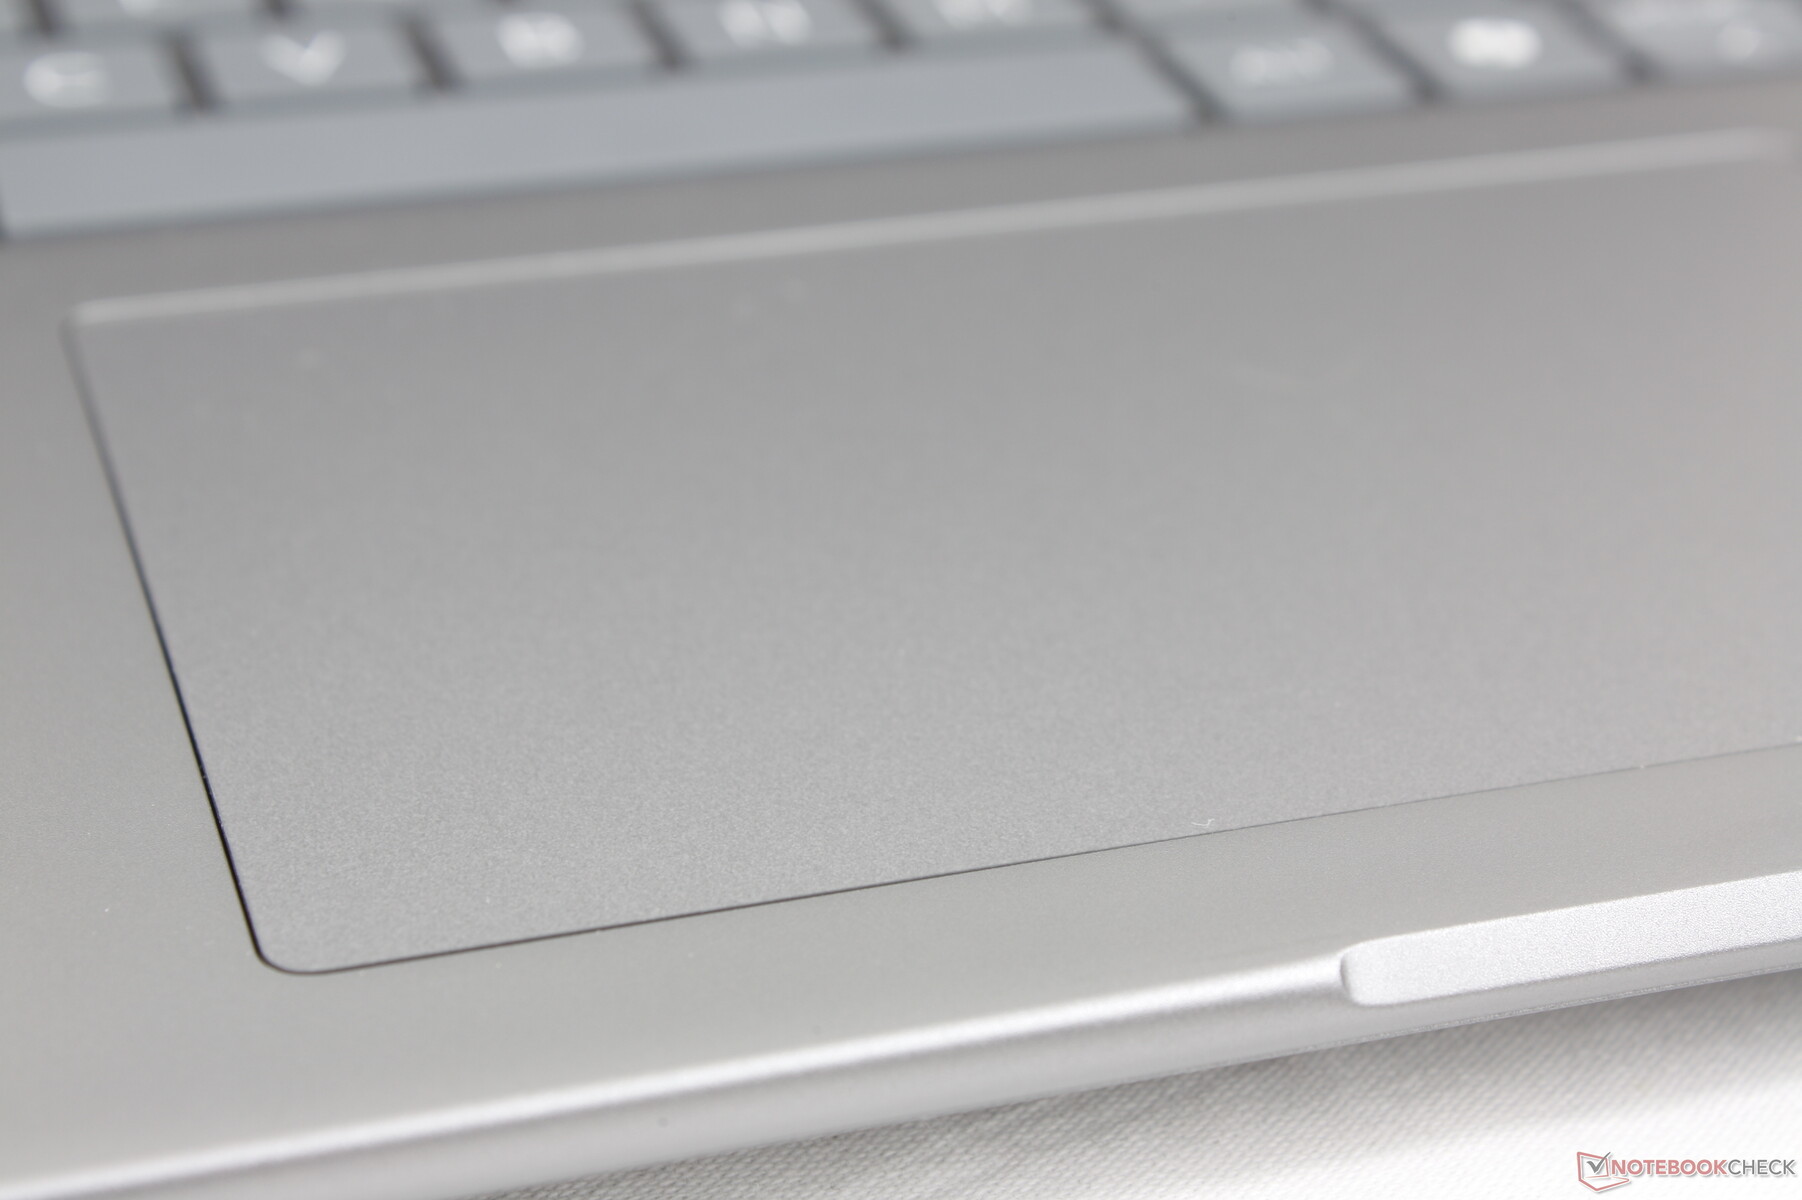
Тачпад
Кликпад стал больше, чем раньше (12,5 x 8 см против 11,5 x 7 см), чтобы использовать преимущества более крупного 16-дюймового форм-фактора. Выделенные клавиши по-прежнему отсутствуют, они имеются в более дорогой серии ZBook Fury. Тяга и обратная связь, тем не менее, гладкие и тугие, соответственно, что делает их более надежными, чем обычно более пористые кликпады на большинстве потребительских ноутбуков.

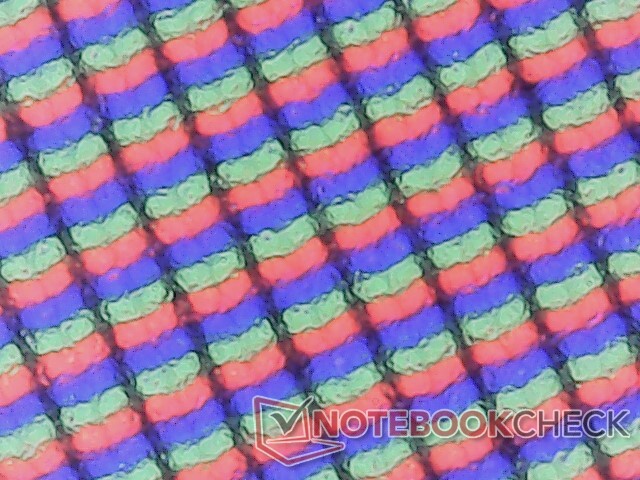
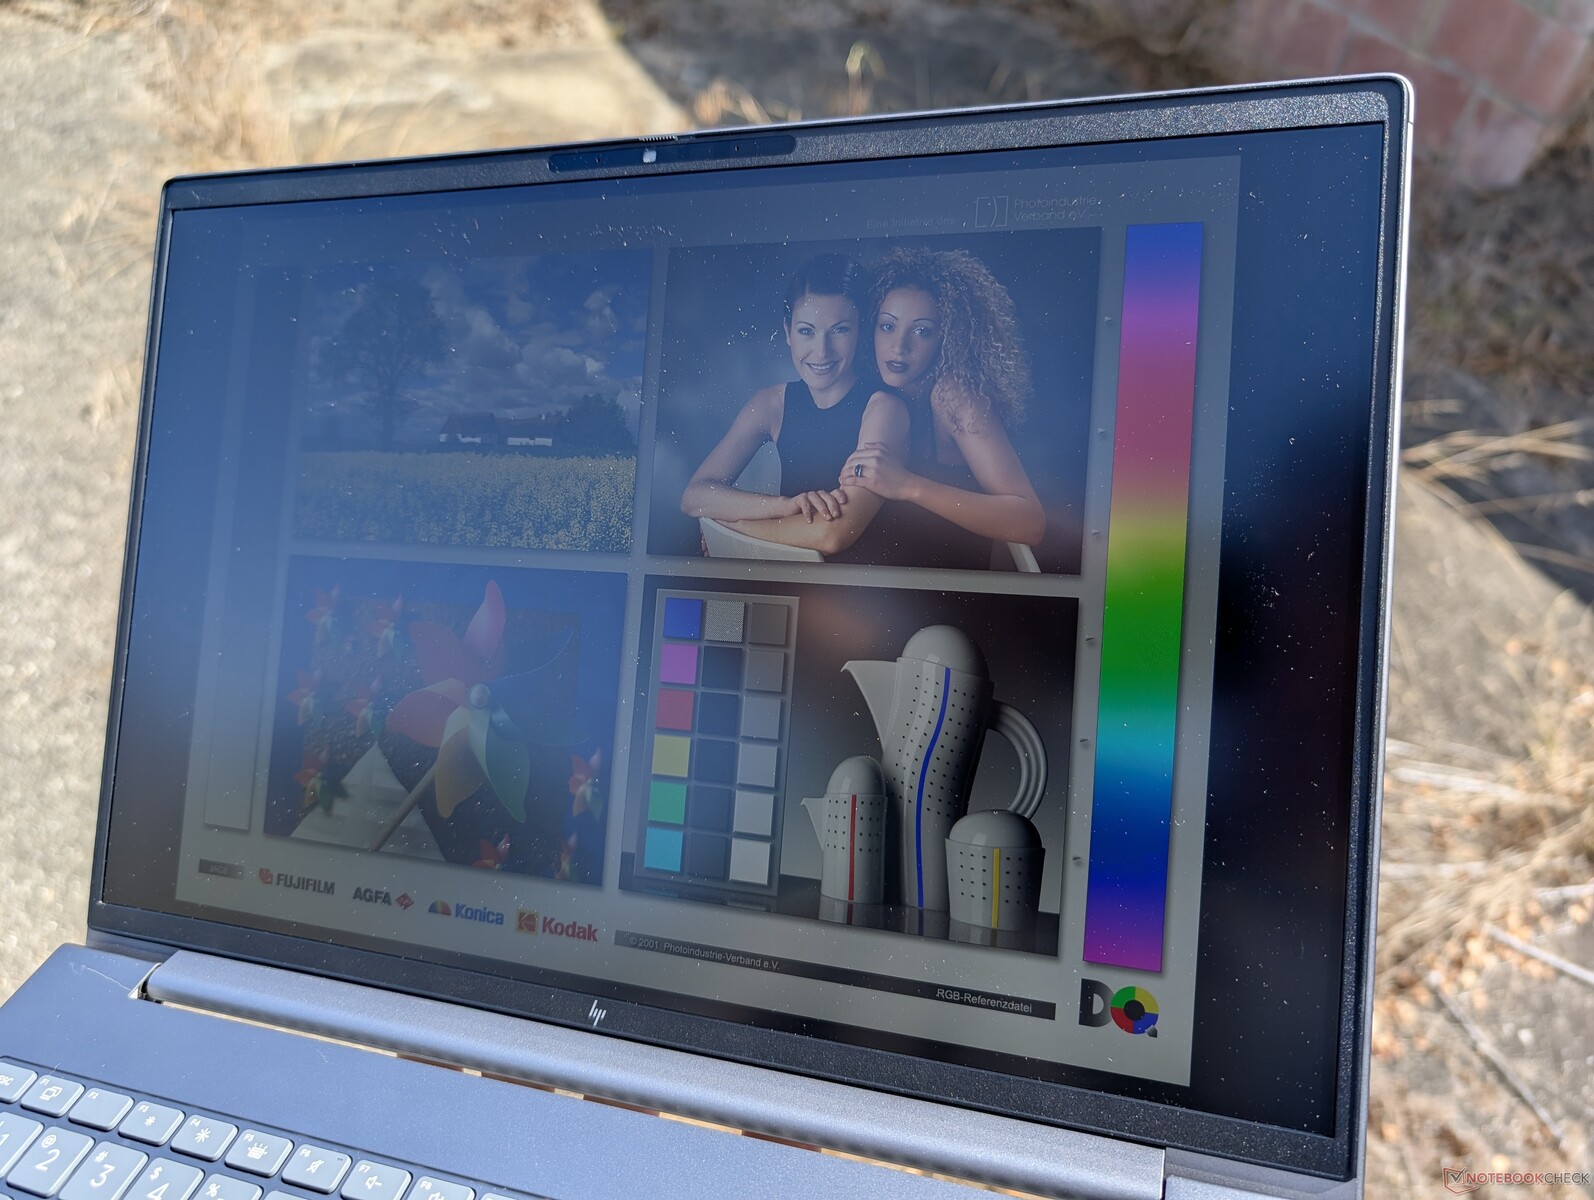
Дисплей - IPS по всему периметру
Всего доступно пять следующих вариантов дисплеев, все из которых только IPS. Наша конфигурация поставляется с выделенным жирным шрифтом вариантом.
- 1920 x 1200, несенсорный, матовый, 250 нит, 45% NTSC, 60 Гц
- 1920 x 1200, сенсорный, матовый, 250 нит, 45% NTSC, 60 Гц
- 1920 x 1200, несенсорный, матовый, 400 нит, 100 процентов sRGB, 60 Гц
- 1920 x 1200, несенсорный, матовый, 1000 нит, 100 процентов sRGB, HP Sure View, 60 Гц
- 2560 x 1600, несенсорный, матовый, 400 нит, 100% sRGB, 120 Гц
Если Вас беспокоит качество изображения, то первые два варианта лучше пропустить, так как цветовой охват будет составлять всего 60% от sRGB. Сверхъяркая панель с яркостью 1000 нит заслуживает внимания, поскольку многие другие рабочие станции не предлагают такой возможности, но эта опция, к сожалению, привязана к Sure View, которая сильно ограничивает углы обзора для повышения конфиденциальности. Нет никаких опций OLED, HDR или P3, что несколько разочаровывает для производительной рабочей станции. Пользователям придется перейти на HP ZBook Fury 16 G11 или рассмотреть модель ThinkPad P16s G2 для получения таких возможностей.

| |||||||||||||||||||||||||
Равномерность подсветки: 88 %
От батареи: 470.7 cd/m²
Контрастность: 826:1 (Уровень чёрного: 0.57 cd/m²)
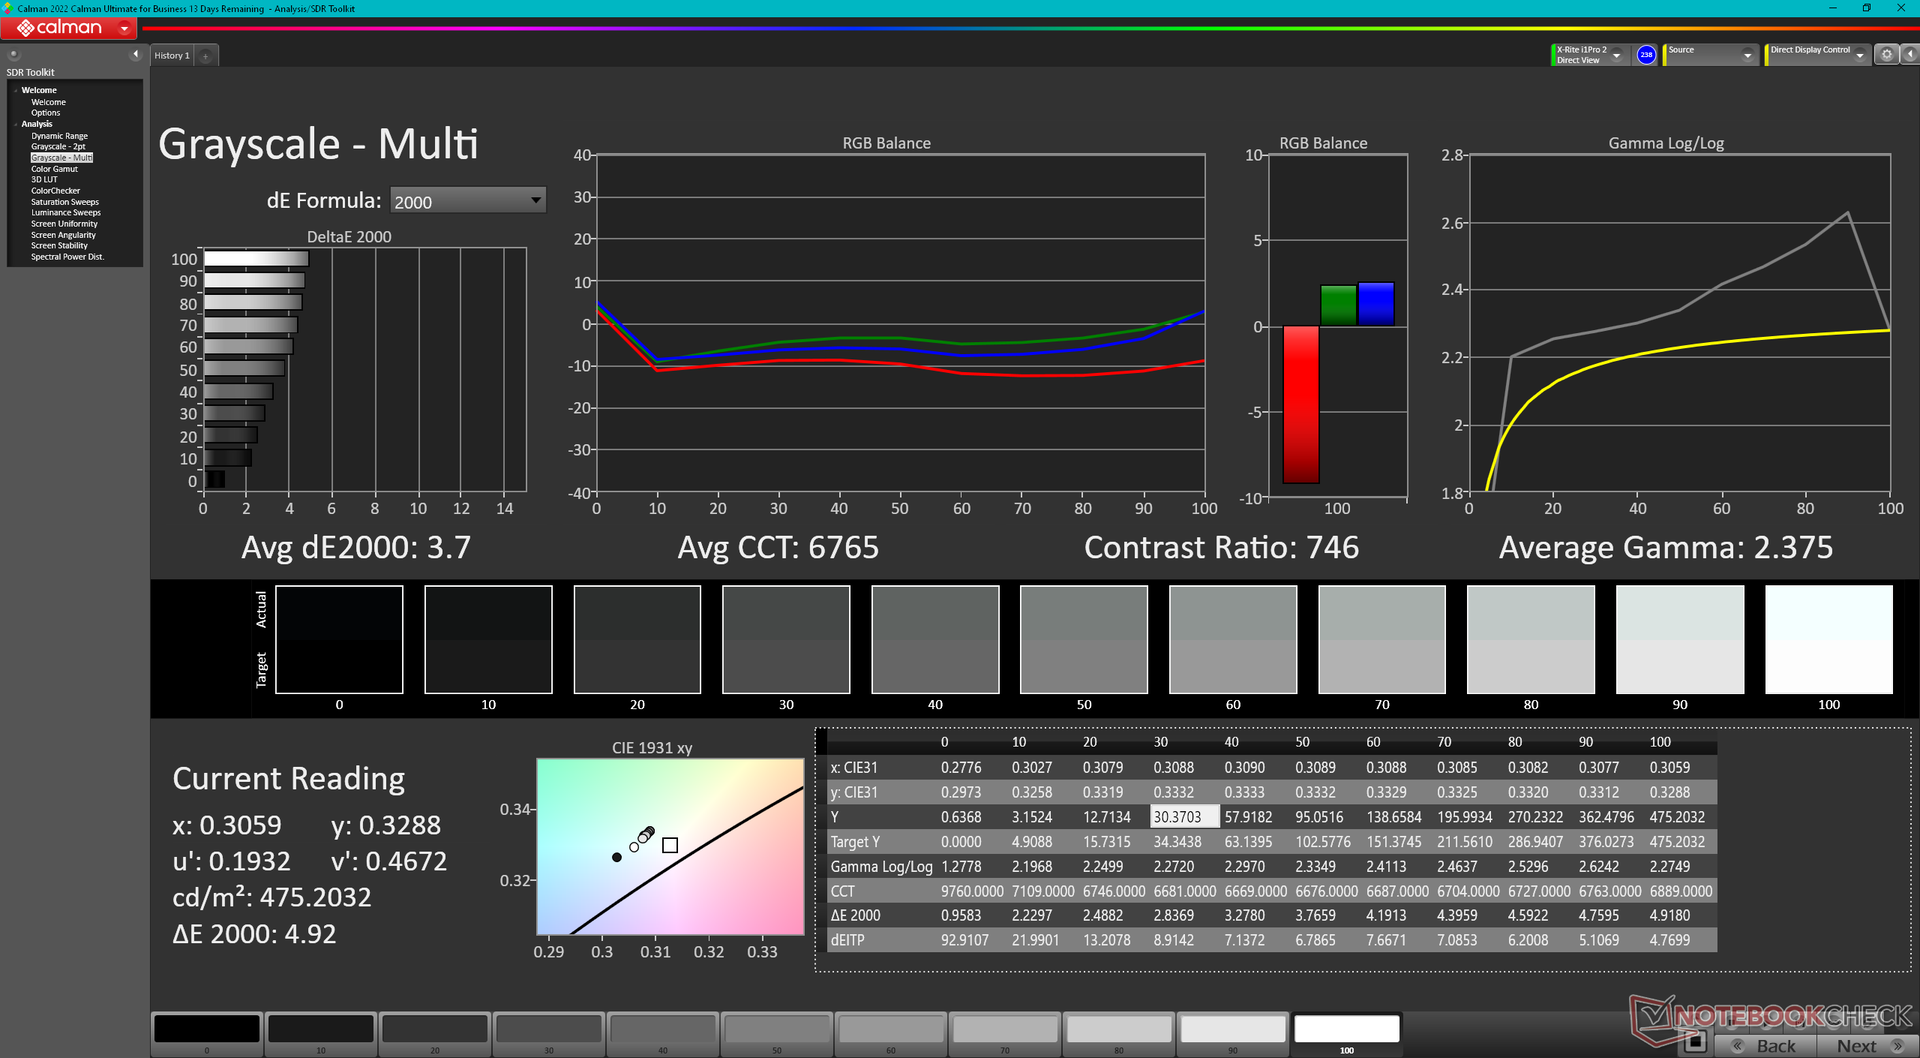
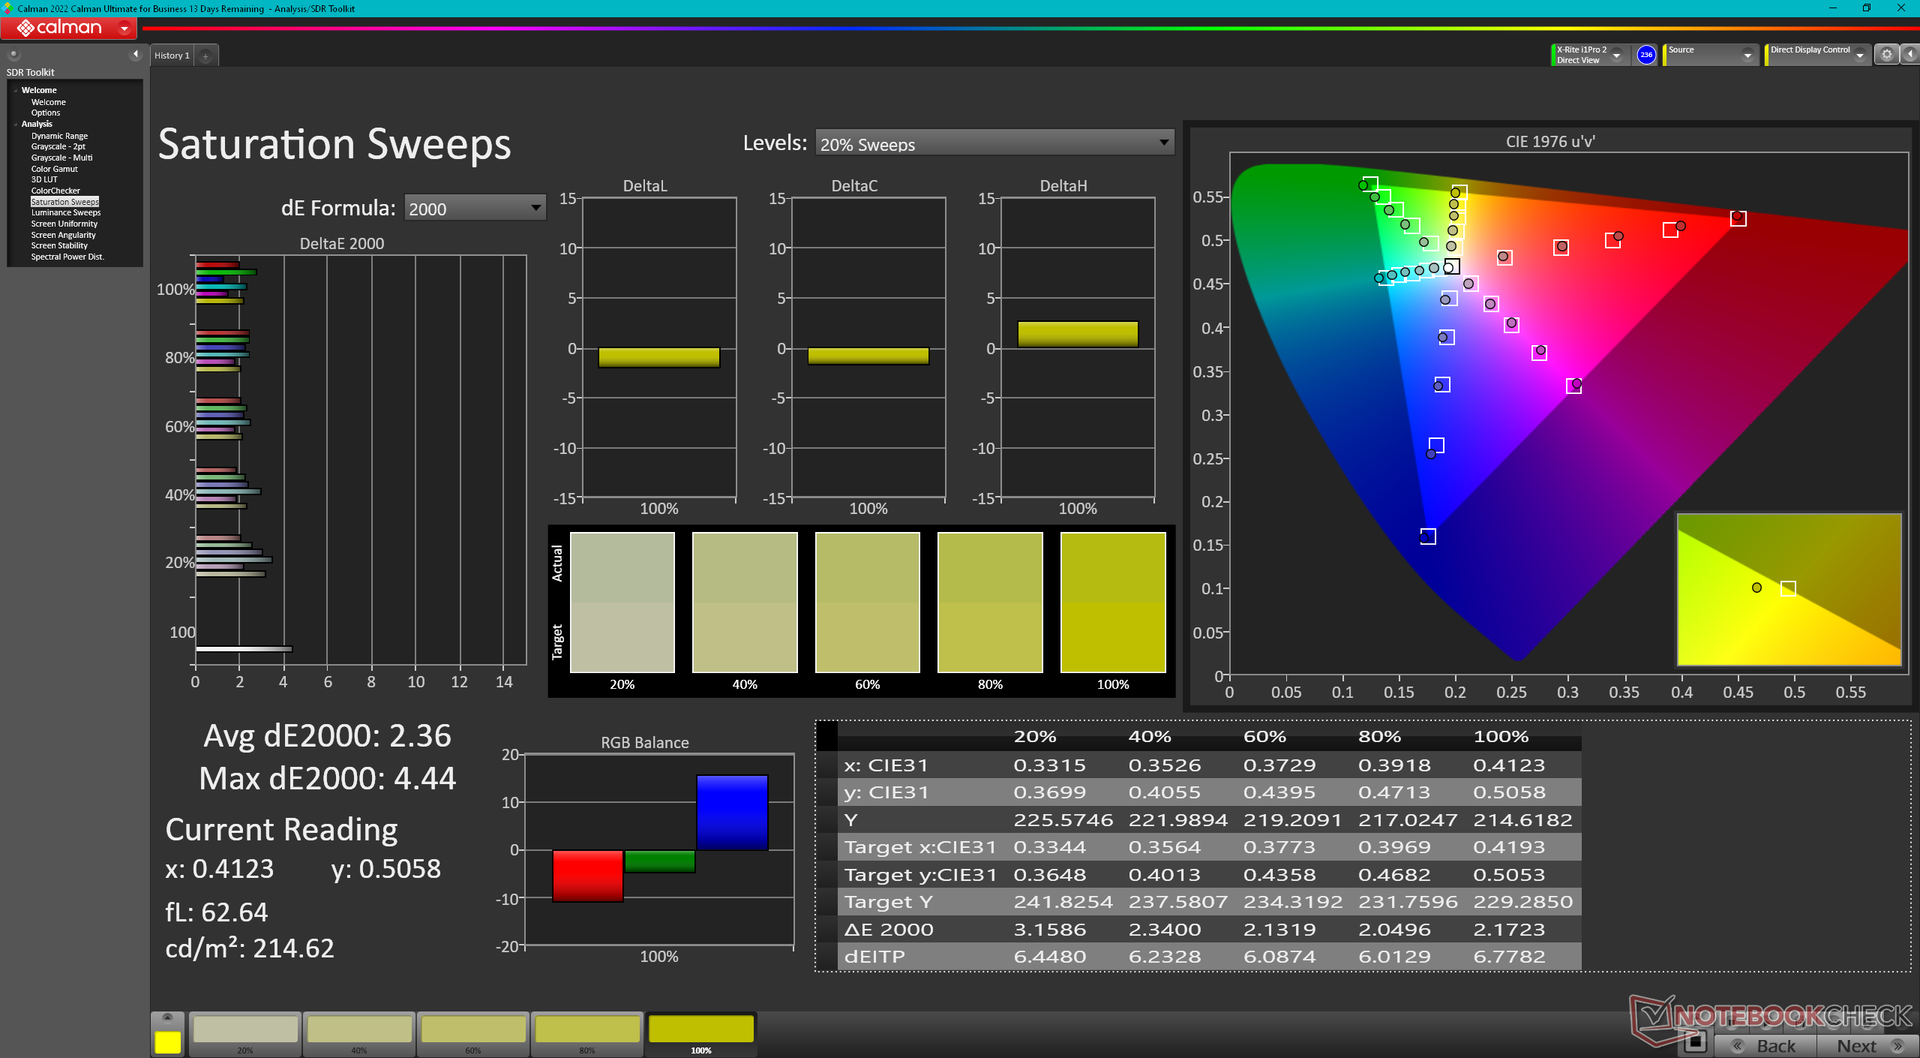
ΔE Color 2.16 | 0.5-29.43 Ø4.87, calibrated: 1.37
ΔE Greyscale 3.7 | 0.5-98 Ø5.1
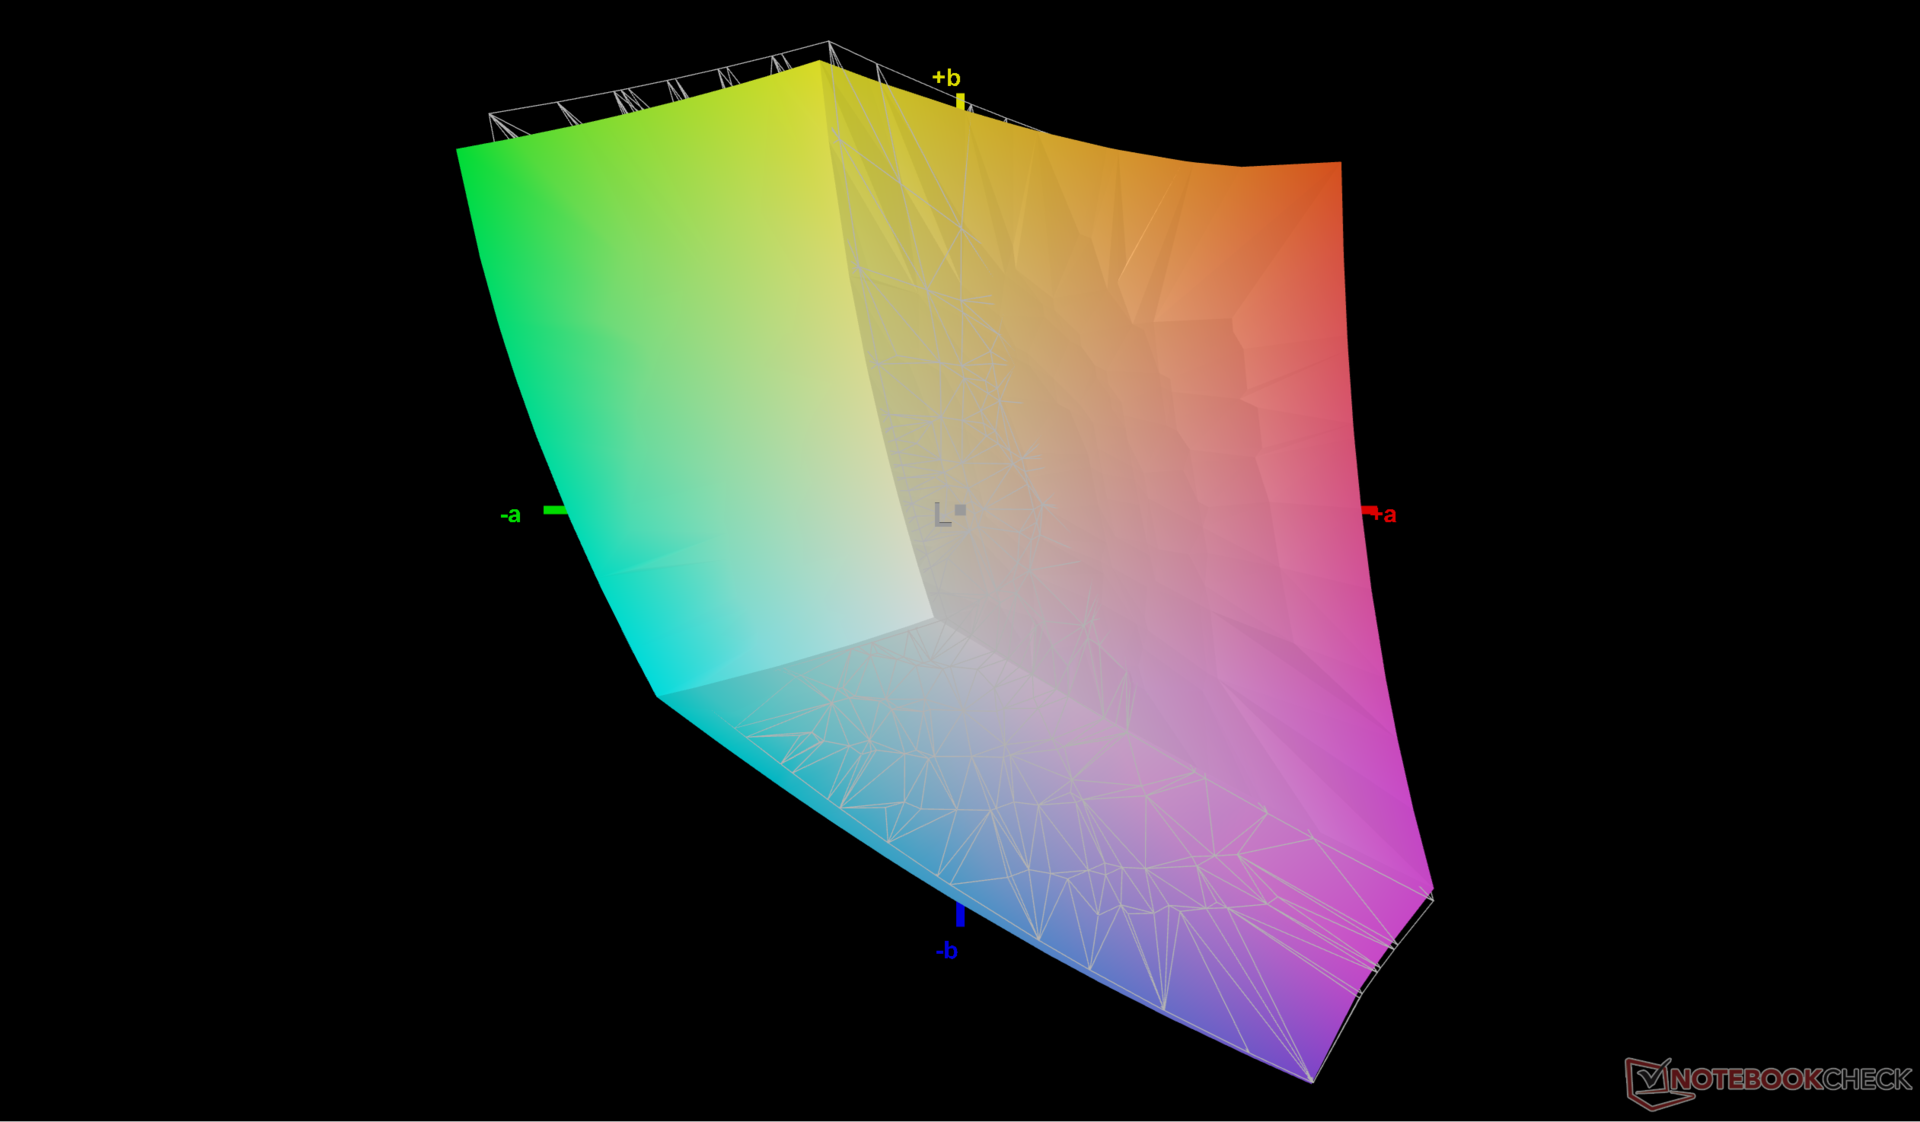
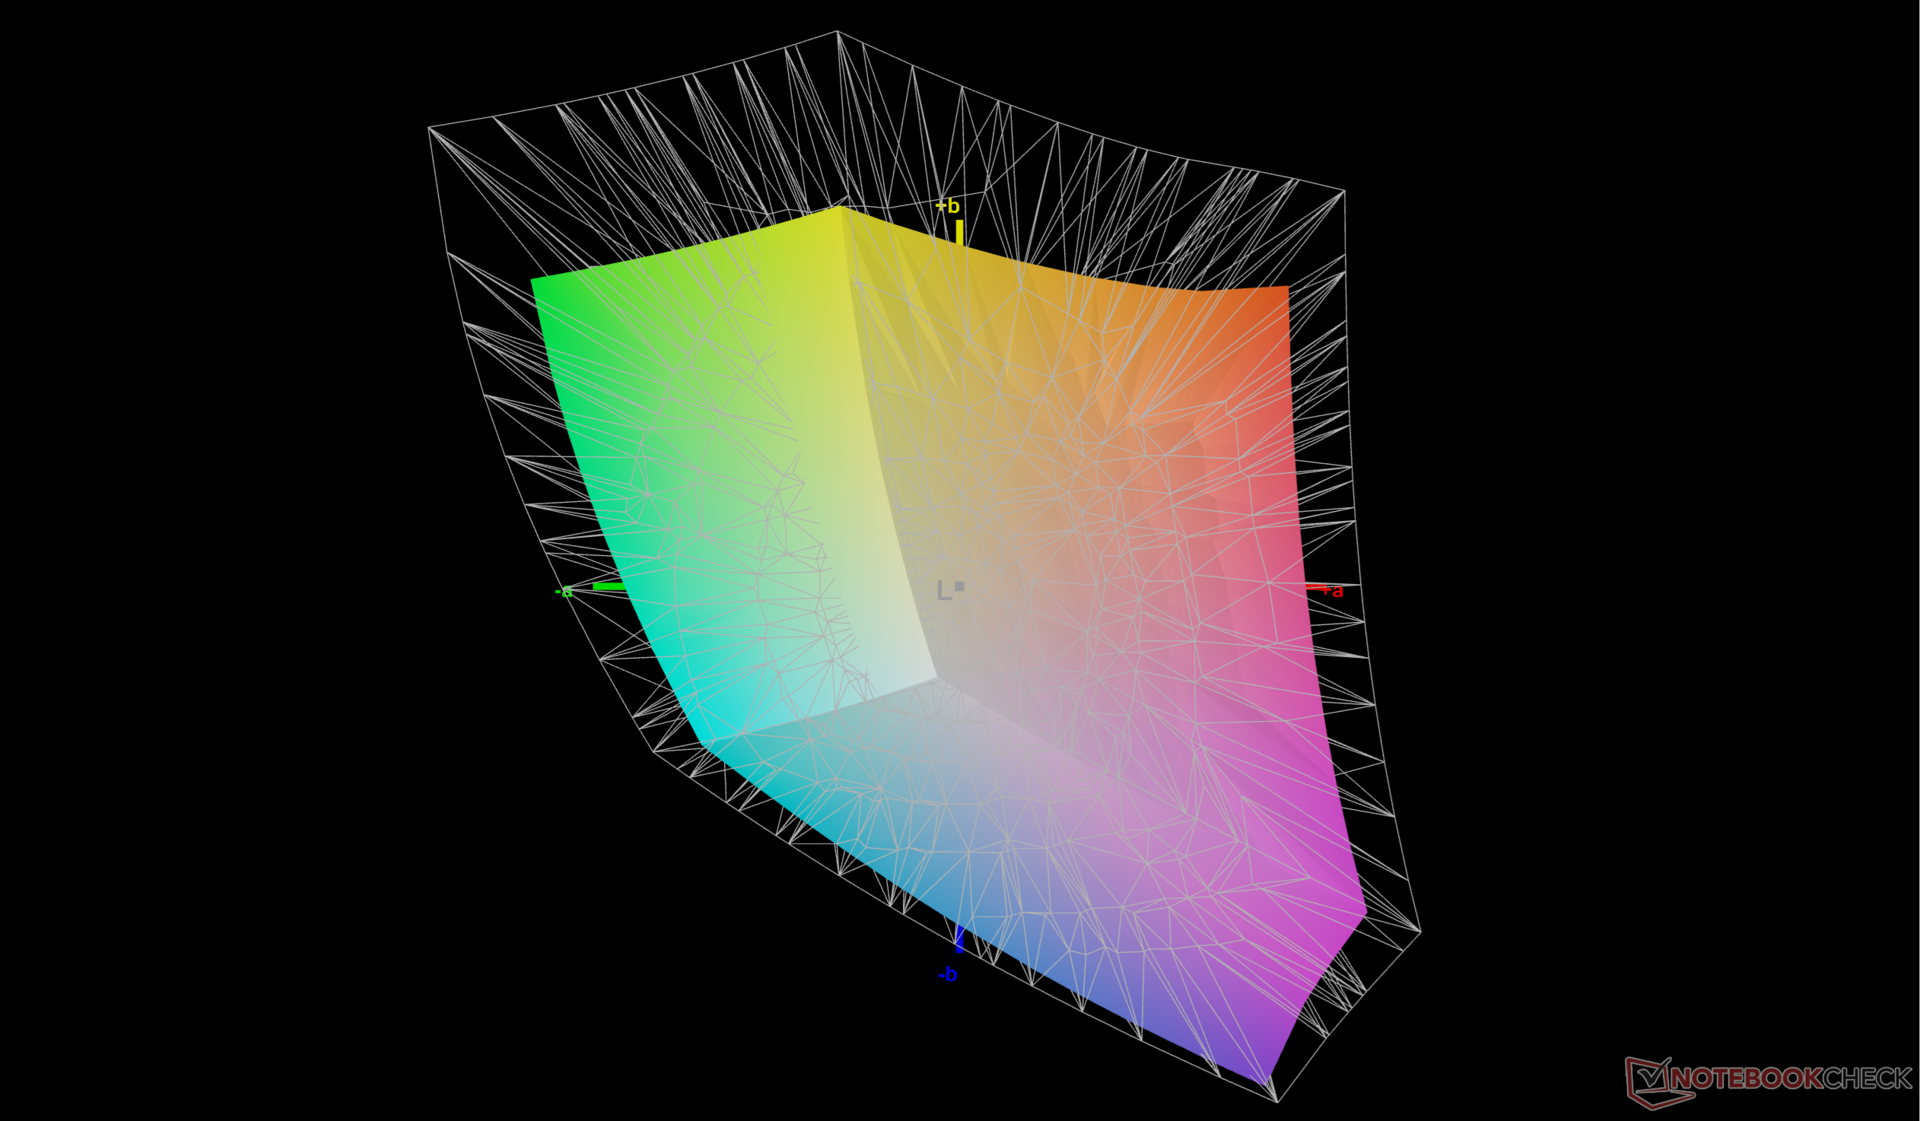
71% AdobeRGB 1998 (Argyll 2.2.0 3D)
97.7% sRGB (Argyll 2.2.0 3D)
69.1% Display P3 (Argyll 2.2.0 3D)
Gamma: 2.38
| HP ZBook Power 16 G11 A AUOA0A9, IPS, 2560x1600, 16", 120 Hz | HP ZBook Power 15 G10 BOE0B6A, IPS, 2560x1440, 15.6", 120 Hz | HP ZBook Fury 16 G11 AUO87A8, IPS, 3840x2400, 16", 120 Hz | Lenovo ThinkPad P1 Gen 7 21KV001SGE MNG007DA1-9 , IPS LED, 2560x1600, 16", 165 Hz | Lenovo ThinkPad P16s G2 21K9000CGE ATNA60YV04-0, OLED, 3840x2400, 16", 60 Hz | Dell Precision 5690 Samsung 160YV03, OLED, 3840x2400, 16", 60 Hz | |
|---|---|---|---|---|---|---|
| Display | -1% | 22% | 0% | 28% | 27% | |
| Display P3 Coverage | 69.1 | 68.2 -1% | 98.4 42% | 69.4 0% | 99.9 45% | 99.8 44% |
| sRGB Coverage | 97.7 | 95.6 -2% | 99.9 2% | 97.6 0% | 100 2% | 100 2% |
| AdobeRGB 1998 Coverage | 71 | 70.5 -1% | 86 21% | 71.8 1% | 96.9 36% | 96.6 36% |
| Response Times | -10% | 8% | -4% | 87% | 84% | |
| Response Time Grey 50% / Grey 80% * | 13.6 ? | 13 ? 4% | 11.4 ? 16% | 11.2 ? 18% | 1.5 ? 89% | 1.7 ? 87% |
| Response Time Black / White * | 8.4 ? | 10.4 ? -24% | 8.4 ? -0% | 10.6 ? -26% | 1.3 ? 85% | 1.7 ? 80% |
| PWM Frequency | 60 | 60 ? | ||||
| Параметры экрана | -13% | 5% | -10% | 2% | -14% | |
| Яркость в центре | 470.7 | 313.8 -33% | 457.6 -3% | 516 10% | 416 -12% | 348.1 -26% |
| Brightness | 431 | 302 -30% | 466 8% | 505 17% | 421 -2% | 351 -19% |
| Brightness Distribution | 88 | 83 -6% | 83 -6% | 89 1% | 98 11% | 97 10% |
| Уровень чёрного * | 0.57 | 0.29 49% | 0.43 25% | 0.41 28% | ||
| Контрастность | 826 | 1082 31% | 1064 29% | 1259 52% | ||
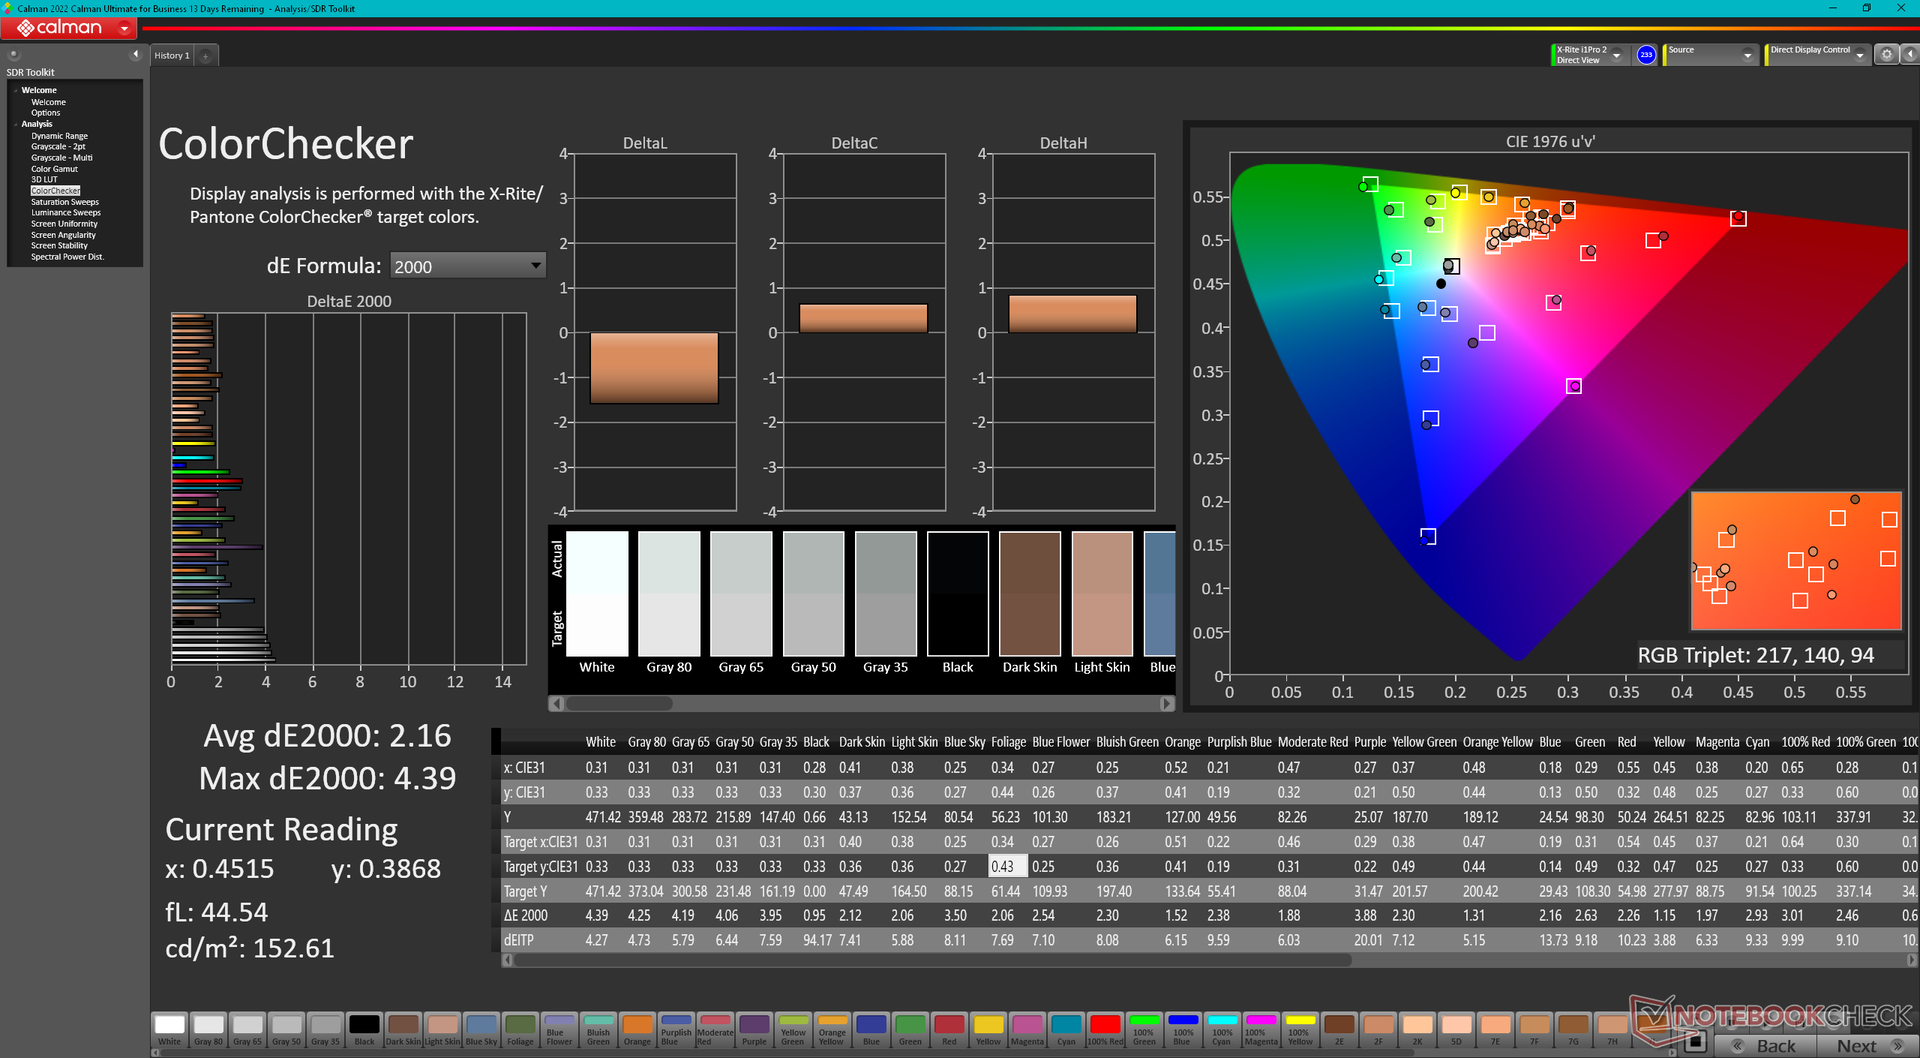
| Colorchecker Delta E * | 2.16 | 3.27 -51% | 2.78 -29% | 3.5 -62% | 1.3 40% | 4.18 -94% |
| Colorchecker dE 2000 max. * | 4.39 | 7.81 -78% | 5.53 -26% | 8.8 -100% | 2.8 36% | 6.68 -52% |
| Colorchecker dE 2000 calibrated * | 1.37 | 0.56 59% | 1.37 -0% | 1.2 12% | 2.9 -112% | 0.97 29% |
| Delta E для серого * | 3.7 | 5.9 -59% | 2 46% | 5.6 -51% | 1.8 51% | 1.7 54% |
| Гамма | 2.38 92% | 2.18 101% | 2.28 96% | 2.27 97% | 2.25 98% | 2.2 100% |
| CCT | 6765 96% | 6323 103% | 6806 96% | 6071 107% | 6574 99% | 6198 105% |
| Среднее значение | -8% /
-10% | 12% /
9% | -5% /
-7% | 39% /
22% | 32% /
13% |
* ... меньше = лучше
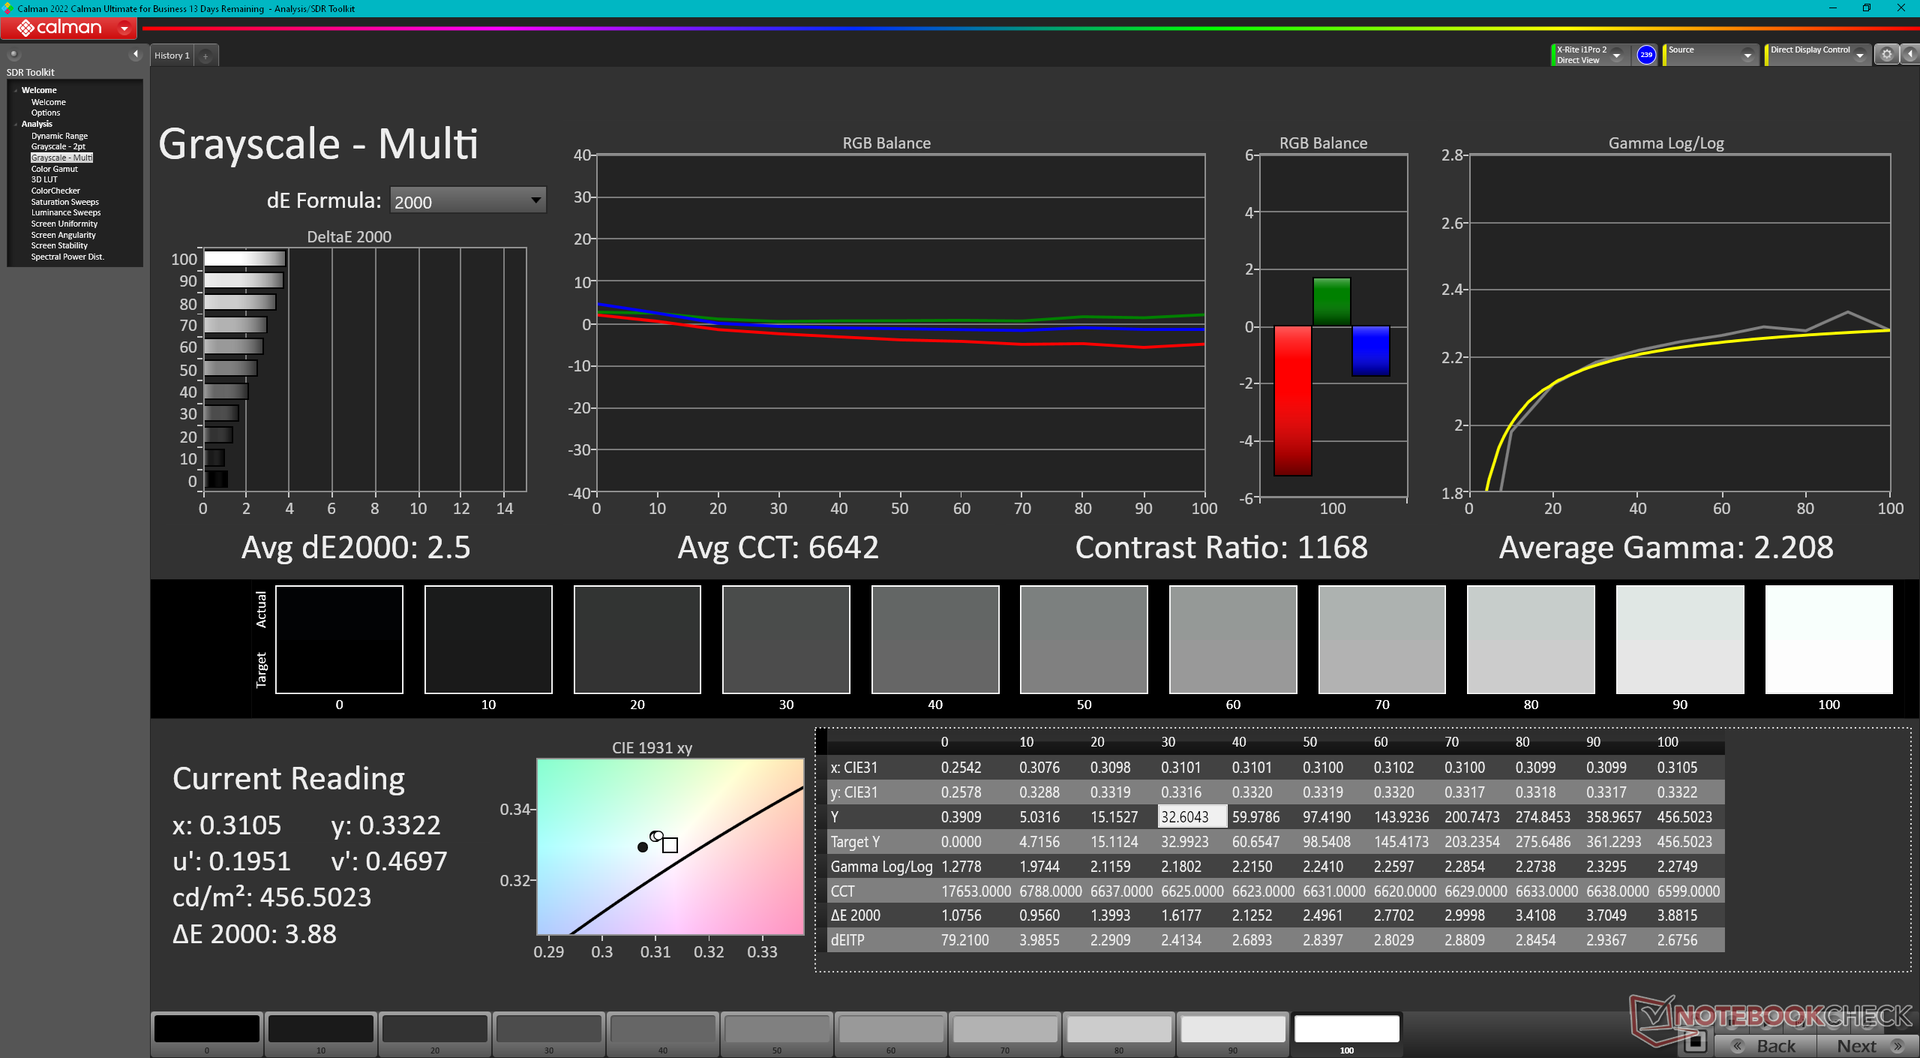
Из коробки дисплей хорошо откалиброван по стандарту sRGB. Калибровка панели с помощью нашего колориметра X-Rite еще больше улучшит средние значения дельтаЕ серого и цвета с 3,7 и 2,16 до 2,5 и 1,37, соответственно. Наш калиброванный профиль ICM доступен для бесплатной загрузки выше.

Дисплей: тест на время отклика
| ↔ Перемена цвета пикселей, чёрный - белый (1) и белый - чёрный (2) | ||
|---|---|---|
| 8.4 ms ... стадия 1 ↗ и стадия 2 ↘ в сумме | ↗ 4.5 ms стадия 1 | 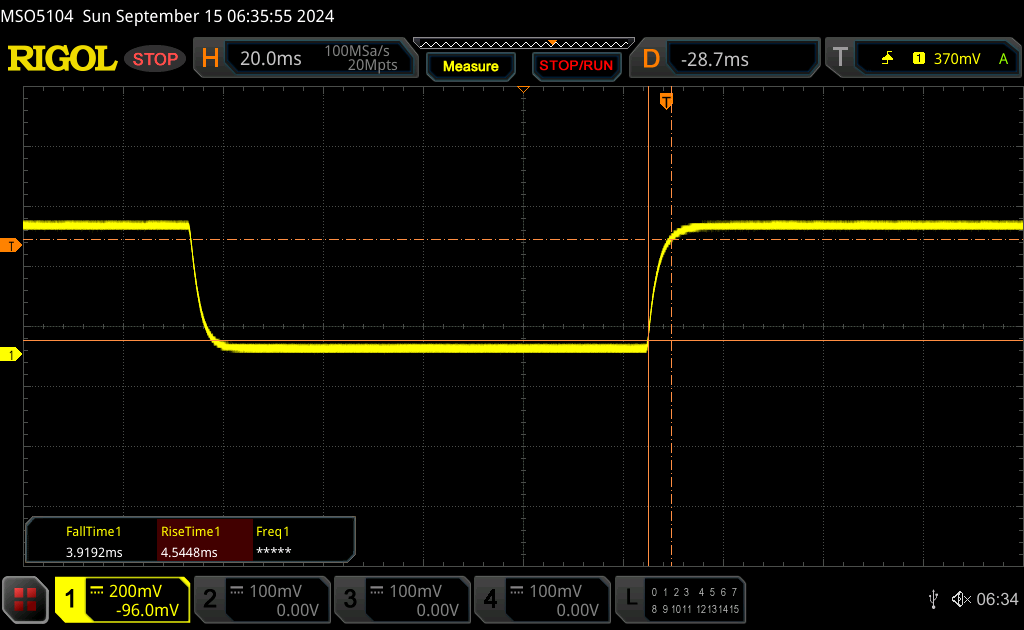 |
| ↘ 3.9 ms стадия 2 | ||
| Это хорошее время отклика. Экран полностью подходит для игр и подобных применений. Для сравнения, самый лучший результат среди всех известных нам устройств равен 0.1 миллисек., самый худший - 240 миллисек. » 21% экранов из нашей базы данных показали более хороший результат. Таким образом, тестируемое устройство находится в верхней половине рейтинга (оно опережает средний результат, равный 20.8 миллисек.) | ||
| ↔ Перемена цвета пикселей, серый 50% - серый 80% (1) и серый 80% - серый 50% (2) | ||
| 13.6 ms ... стадия 1 ↗ и стадия 2 ↘ в сумме | ↗ 7.2 ms стадия 1 | 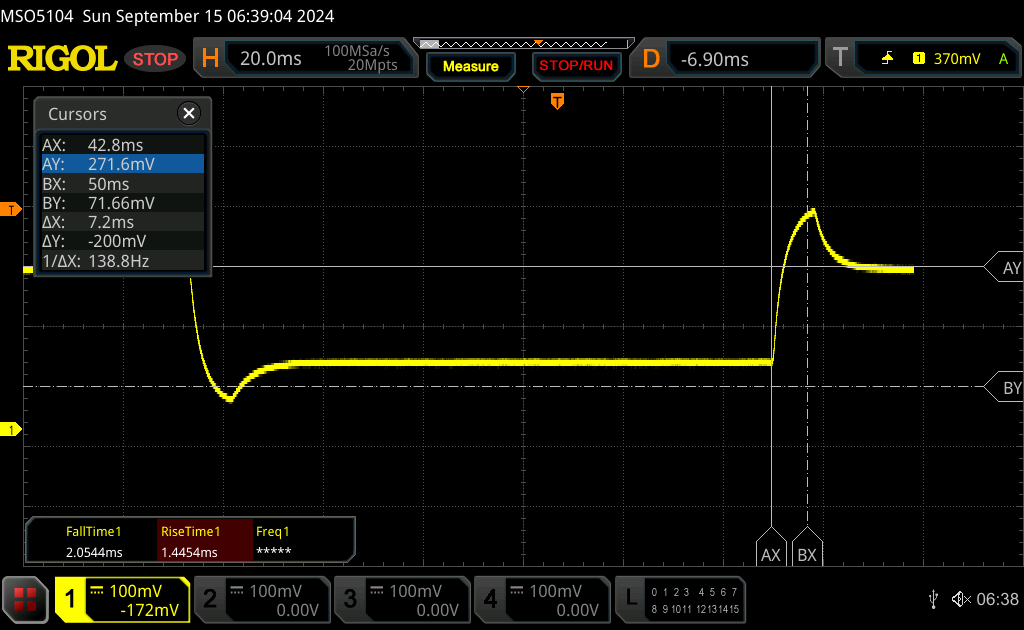 |
| ↘ 6.4 ms стадия 2 | ||
| Это неплохое время отклика. Оно подходит для игр и подобных применений, хоть и не идеально. Для сравнения, самый лучший результат среди всех известных нам устройств равен 0.165 миллисек., самый худший - 636 миллисек. » 24% экранов из нашей базы данных показали более хороший результат. Таким образом, тестируемое устройство находится в верхней половине рейтинга (оно опережает средний результат, равный 32.5 миллисек.) | ||
Тест на мерцание
| Ура! ШИМ не обнаружено | 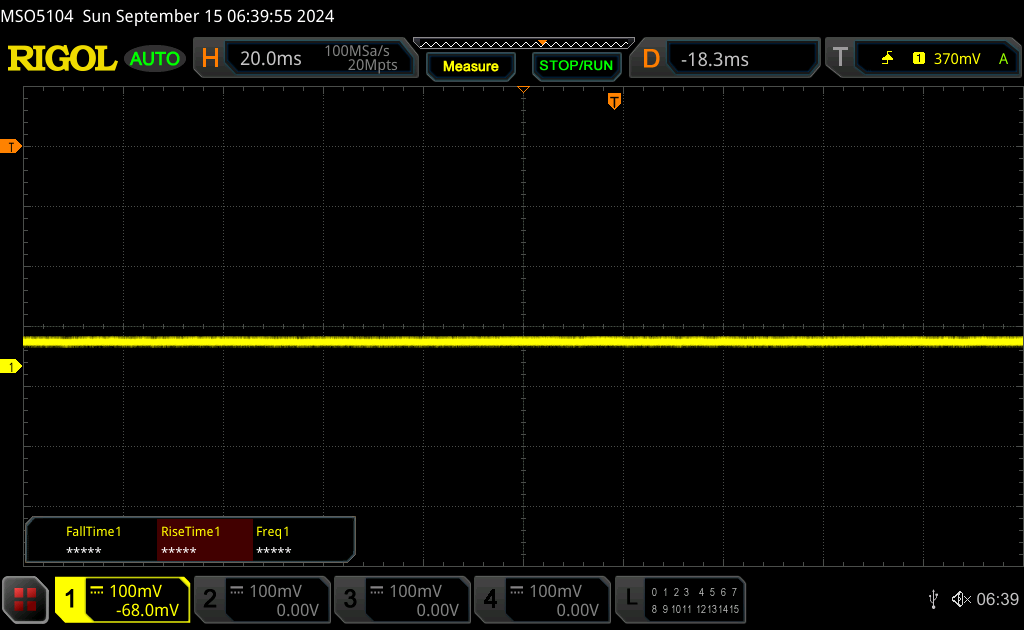 | ||
Для сравнения, 53 % известных нам устройств не применяют PWM для изменения яркости, а среди тех, где PWM используется, типичная частота модуляции составляет 8516 Гц (мин. 5 Гц, макс. 343500 Гц). | |||
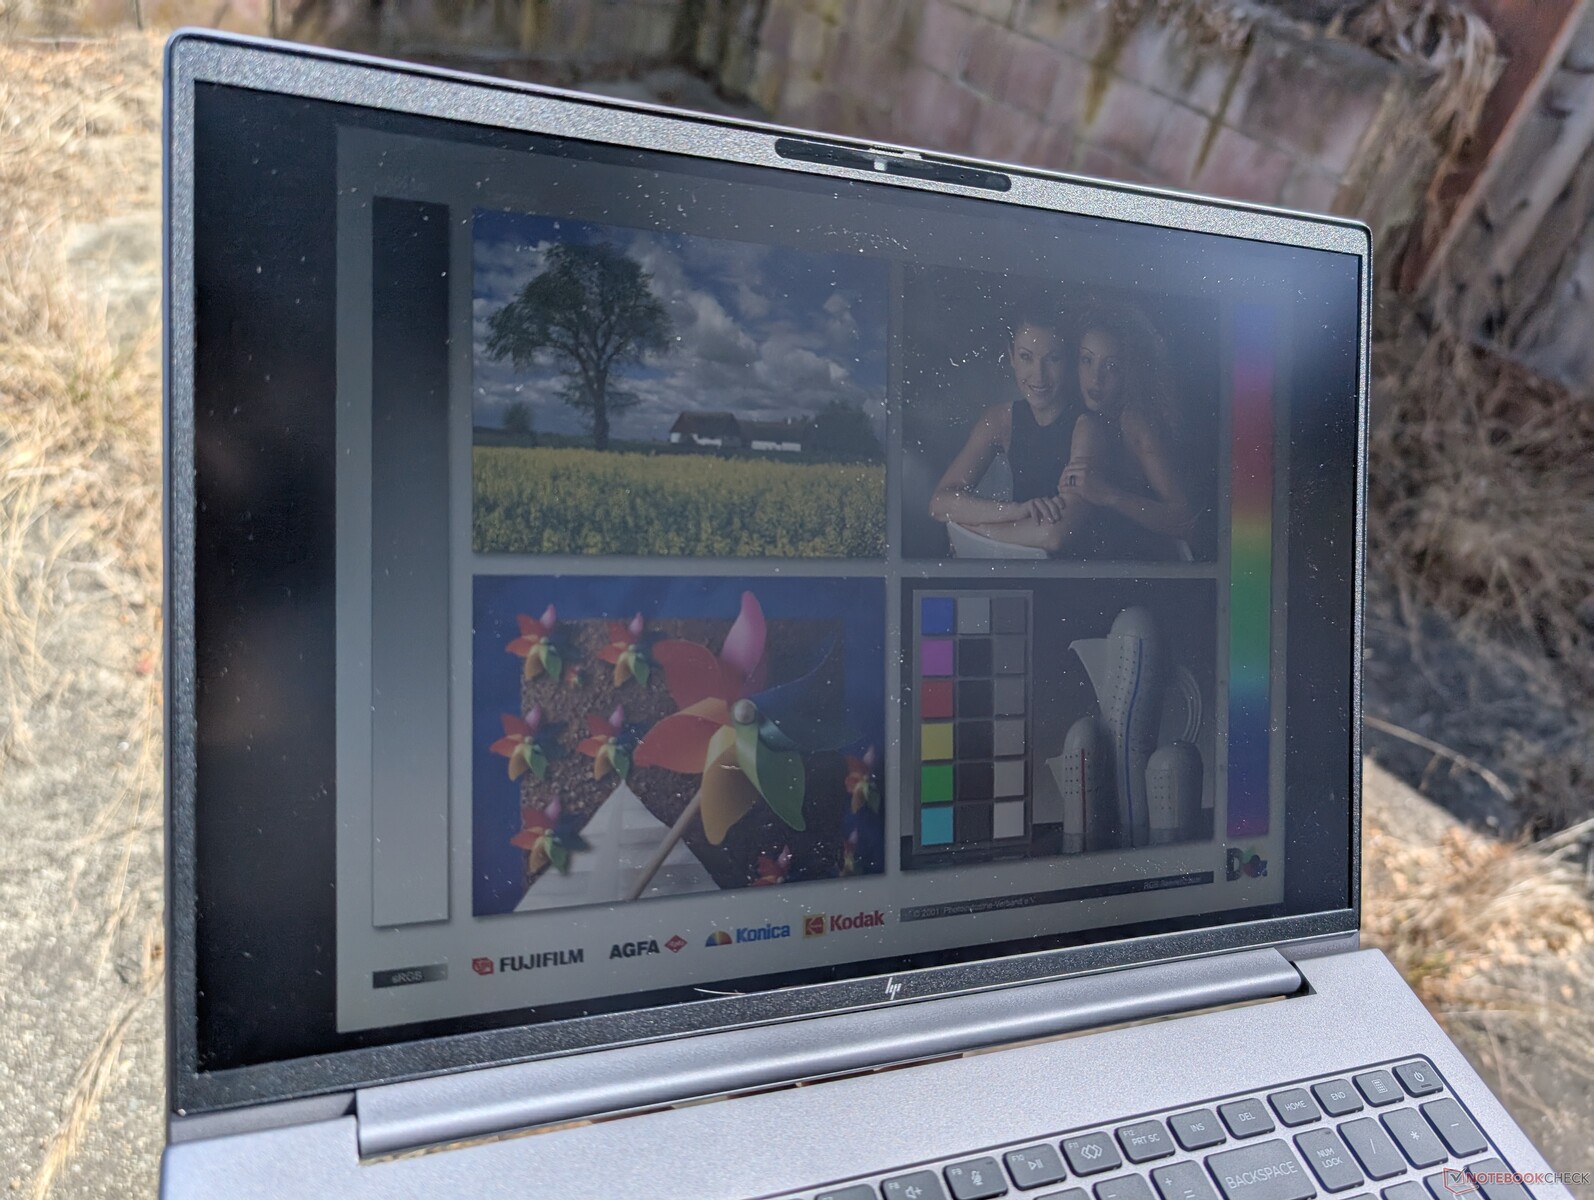
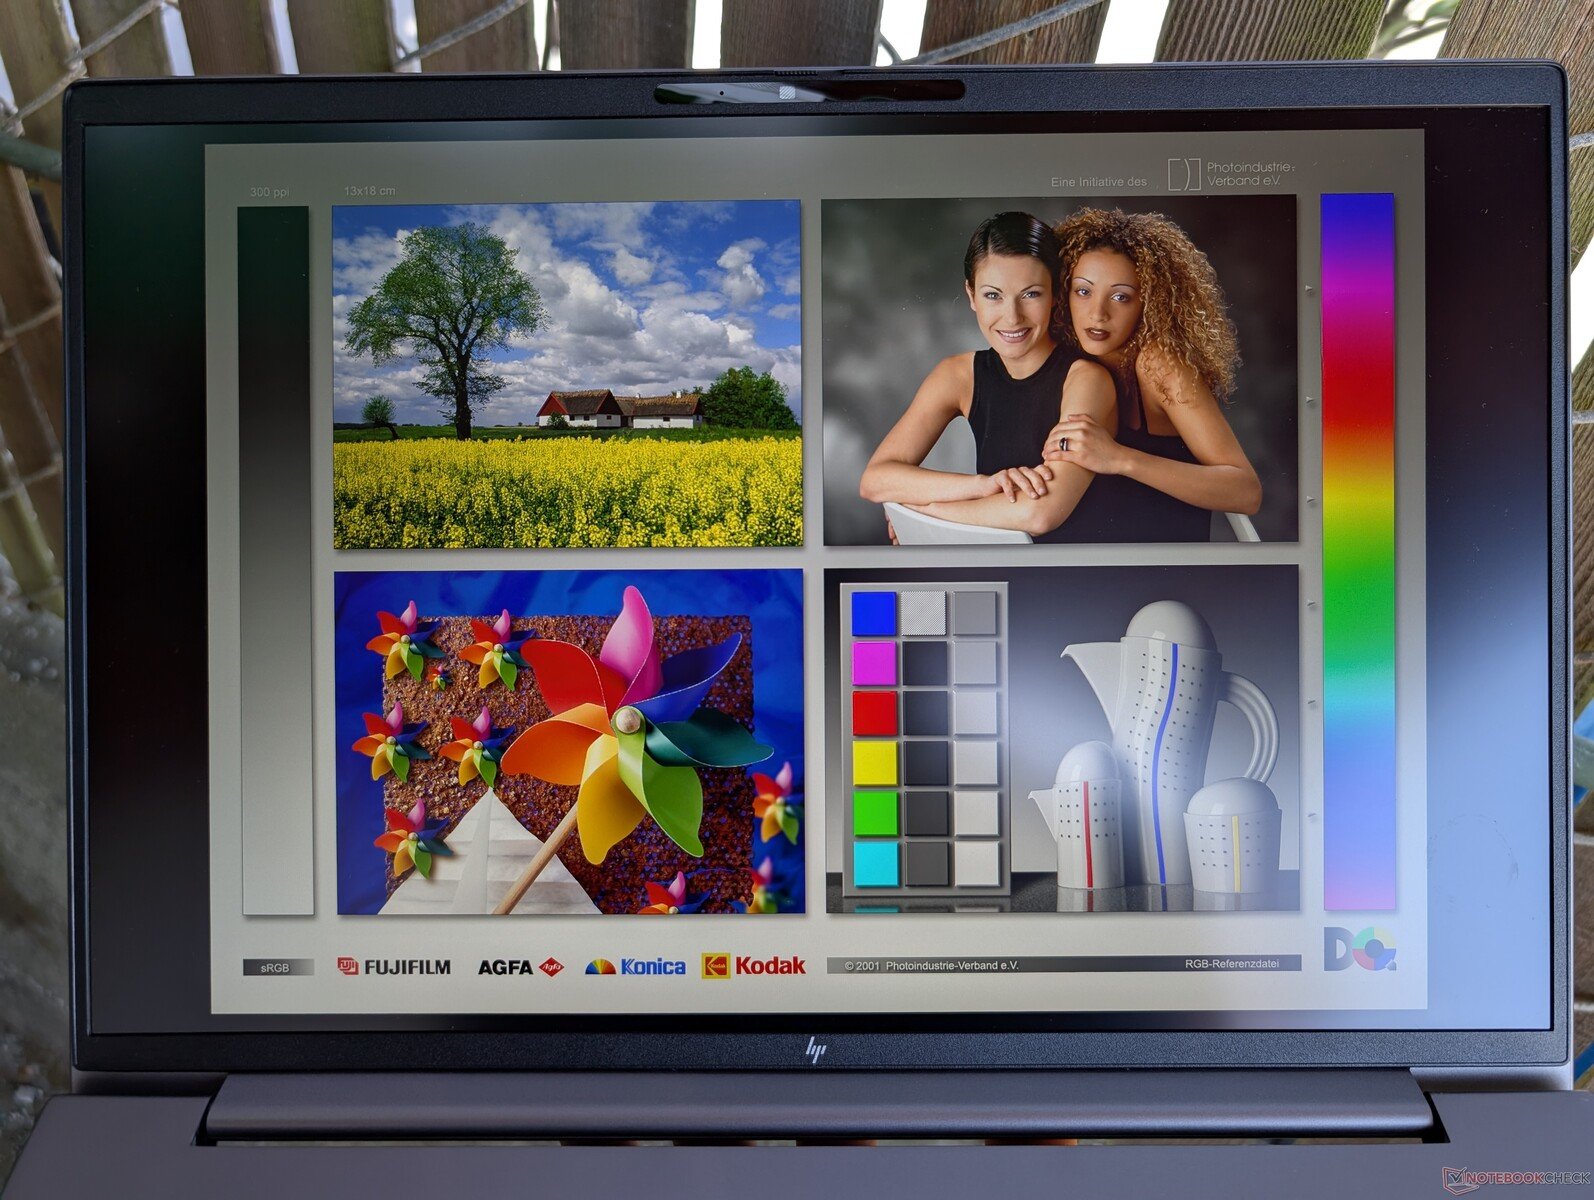
С нашей панелью 1600p видимость на улице в тени вполне приличная, но более дешевые варианты будут более тусклыми и склонными к бликам. Если Вы часто находитесь на открытом воздухе, следует рассмотреть вариант с яркостью 1000 нит.
Производительность - Новый Zen 4, та же производительность
Условия тестирования
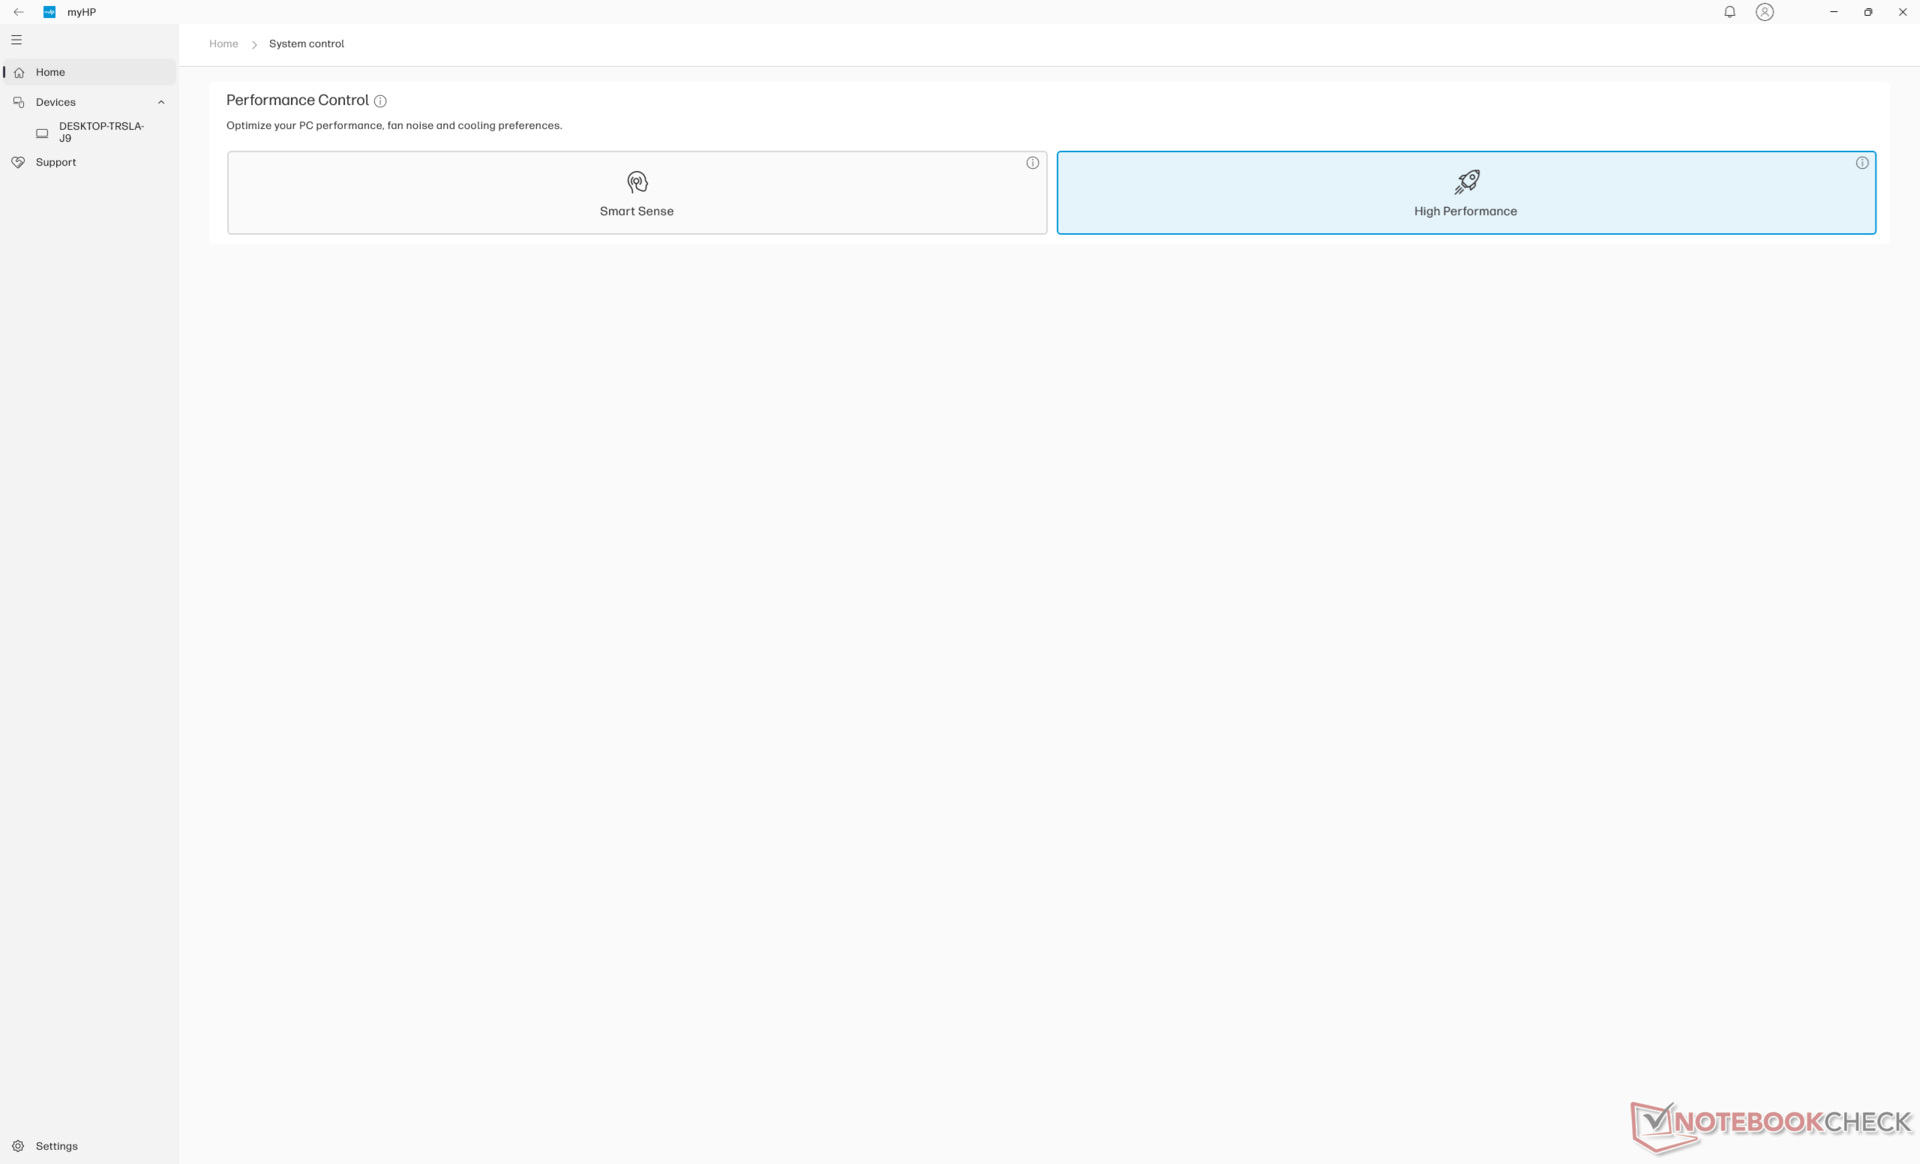
Мы перевели Windows и MyHP в режим производительности перед тем, как запустить приведенные ниже бенчмарки. Поддерживается Optimus 1.0.
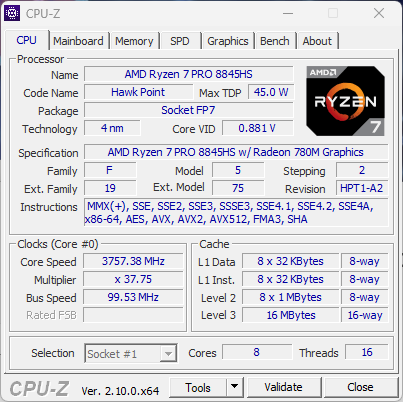
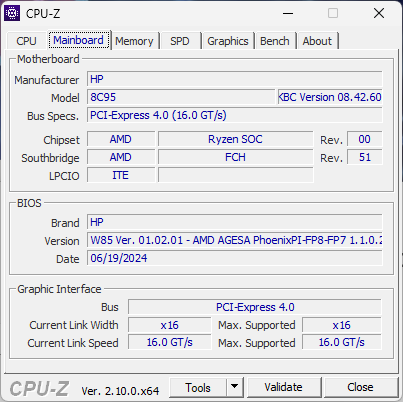
Процессор
Ryzen 7 8845HS не сильно превосходит Ryzen 7 7840HS который он заменил в прошлогодней модели ZBook Power 15 G10. Фактически, в бенчмарках оба процессора сравнялись всего на несколько процентных пунктов, став практически идентичными. Это может разочаровать опытных пользователей, которые ожидали более значительного повышения производительности при переходе от 15-дюймового к 16-дюймовому ноутбуку. Более быстрые варианты Raptor Lake-HX доступны только в более толстой серии ZBook Fury от HP.
Главное преимущество Ryzen 7 8845HS перед Ryzen 7 7840HS - ускорение искусственного интеллекта благодаря встроенному NPU. Однако Co-Pilot+ несовместим с процессорами Hawk Point, поэтому практическая польза от NPU на этой машине весьма ограничена.
Переход на Ryzen 5 8645HS как ожидается, снизит производительность на 25-30%, в то время как обновление до Ryzen 9 8945HS повысит производительность всего на 5 процентов.
Многопоточный тест CB15
Cinebench R23: Multi Core | Single Core
Cinebench R20: CPU (Multi Core) | CPU (Single Core)
Cinebench R15: CPU Multi 64Bit | CPU Single 64Bit
Blender: v2.79 BMW27 CPU
7-Zip 18.03: 7z b 4 | 7z b 4 -mmt1
Geekbench 6.4: Multi-Core | Single-Core
Geekbench 5.5: Multi-Core | Single-Core
HWBOT x265 Benchmark v2.2: 4k Preset
LibreOffice : 20 Documents To PDF
R Benchmark 2.5: Overall mean
| CPU Performance Rating | |
| HP ZBook Fury 16 G11 | |
| Asus ExpertBook B6 Flip B6602FC2 -2! | |
| Dell Precision 5690 | |
| HP ZBook Fury 16 G9 -2! | |
| HP ZBook Power 15 G10 | |
| Усредн. модель с AMD Ryzen 7 8845HS | |
| HP ZBook Power 16 G11 A | |
| Dell Precision 5000 5490 | |
| MSI CreatorPro Z16P B12UKST -2! | |
| Lenovo ThinkPad P16v G1 AMD | |
| Lenovo ThinkPad P16s G2 21K9000CGE | |
| Lenovo ThinkPad P1 G4-20Y4Z9DVUS -2! | |
| HP ZBook Firefly 16 G9-6B897EA -2! | |
| Cinebench R23 / Multi Core | |
| HP ZBook Fury 16 G11 | |
| Asus ExpertBook B6 Flip B6602FC2 | |
| Dell Precision 5690 | |
| HP ZBook Fury 16 G9 | |
| MSI CreatorPro Z16P B12UKST | |
| Dell Precision 5000 5490 | |
| Усредн. модель с AMD Ryzen 7 8845HS (14895 - 18037, n=12) | |
| HP ZBook Power 16 G11 A | |
| HP ZBook Power 15 G10 | |
| Lenovo ThinkPad P16s G2 21K9000CGE | |
| Lenovo ThinkPad P16v G1 AMD | |
| Lenovo ThinkPad P1 G4-20Y4Z9DVUS | |
| HP ZBook Firefly 16 G9-6B897EA | |
| Cinebench R23 / Single Core | |
| HP ZBook Fury 16 G11 | |
| HP ZBook Fury 16 G9 | |
| Asus ExpertBook B6 Flip B6602FC2 | |
| Dell Precision 5690 | |
| HP ZBook Power 15 G10 | |
| Dell Precision 5000 5490 | |
| HP ZBook Power 16 G11 A | |
| Усредн. модель с AMD Ryzen 7 8845HS (1623 - 1783, n=12) | |
| MSI CreatorPro Z16P B12UKST | |
| Lenovo ThinkPad P16s G2 21K9000CGE | |
| Lenovo ThinkPad P16v G1 AMD | |
| Lenovo ThinkPad P1 G4-20Y4Z9DVUS | |
| HP ZBook Firefly 16 G9-6B897EA | |
| Cinebench R20 / CPU (Multi Core) | |
| HP ZBook Fury 16 G11 | |
| Asus ExpertBook B6 Flip B6602FC2 | |
| Dell Precision 5690 | |
| HP ZBook Fury 16 G9 | |
| MSI CreatorPro Z16P B12UKST | |
| Dell Precision 5000 5490 | |
| HP ZBook Power 16 G11 A | |
| Усредн. модель с AMD Ryzen 7 8845HS (5808 - 7026, n=12) | |
| HP ZBook Power 15 G10 | |
| Lenovo ThinkPad P16s G2 21K9000CGE | |
| Lenovo ThinkPad P16v G1 AMD | |
| Lenovo ThinkPad P1 G4-20Y4Z9DVUS | |
| HP ZBook Firefly 16 G9-6B897EA | |
| Cinebench R20 / CPU (Single Core) | |
| HP ZBook Fury 16 G11 | |
| HP ZBook Fury 16 G9 | |
| Asus ExpertBook B6 Flip B6602FC2 | |
| Dell Precision 5690 | |
| HP ZBook Power 15 G10 | |
| Усредн. модель с AMD Ryzen 7 8845HS (673 - 698, n=12) | |
| HP ZBook Power 16 G11 A | |
| Dell Precision 5000 5490 | |
| MSI CreatorPro Z16P B12UKST | |
| Lenovo ThinkPad P16s G2 21K9000CGE | |
| Lenovo ThinkPad P16v G1 AMD | |
| Lenovo ThinkPad P1 G4-20Y4Z9DVUS | |
| HP ZBook Firefly 16 G9-6B897EA | |
| Cinebench R15 / CPU Multi 64Bit | |
| HP ZBook Fury 16 G11 | |
| Asus ExpertBook B6 Flip B6602FC2 | |
| Dell Precision 5690 | |
| Dell Precision 5000 5490 | |
| HP ZBook Power 16 G11 A | |
| Усредн. модель с AMD Ryzen 7 8845HS (2342 - 2908, n=12) | |
| HP ZBook Power 15 G10 | |
| HP ZBook Fury 16 G9 | |
| Lenovo ThinkPad P16s G2 21K9000CGE | |
| Lenovo ThinkPad P16v G1 AMD | |
| MSI CreatorPro Z16P B12UKST | |
| Lenovo ThinkPad P1 G4-20Y4Z9DVUS | |
| HP ZBook Firefly 16 G9-6B897EA | |
| Cinebench R15 / CPU Single 64Bit | |
| HP ZBook Fury 16 G11 | |
| HP ZBook Power 15 G10 | |
| Усредн. модель с AMD Ryzen 7 8845HS (269 - 283, n=12) | |
| HP ZBook Power 16 G11 A | |
| Asus ExpertBook B6 Flip B6602FC2 | |
| Dell Precision 5690 | |
| Lenovo ThinkPad P16s G2 21K9000CGE | |
| Lenovo ThinkPad P16v G1 AMD | |
| Dell Precision 5000 5490 | |
| MSI CreatorPro Z16P B12UKST | |
| Lenovo ThinkPad P1 G4-20Y4Z9DVUS | |
| HP ZBook Firefly 16 G9-6B897EA | |
| HP ZBook Fury 16 G9 | |
| Blender / v2.79 BMW27 CPU | |
| HP ZBook Firefly 16 G9-6B897EA | |
| Lenovo ThinkPad P1 G4-20Y4Z9DVUS | |
| Lenovo ThinkPad P16s G2 21K9000CGE | |
| Dell Precision 5690 | |
| HP ZBook Power 16 G11 A | |
| Lenovo ThinkPad P16v G1 AMD | |
| Dell Precision 5000 5490 | |
| Усредн. модель с AMD Ryzen 7 8845HS (179 - 216, n=12) | |
| MSI CreatorPro Z16P B12UKST | |
| HP ZBook Power 15 G10 | |
| Asus ExpertBook B6 Flip B6602FC2 | |
| HP ZBook Fury 16 G9 | |
| HP ZBook Fury 16 G11 | |
| 7-Zip 18.03 / 7z b 4 | |
| HP ZBook Fury 16 G11 | |
| HP ZBook Fury 16 G9 | |
| Dell Precision 5690 | |
| Asus ExpertBook B6 Flip B6602FC2 | |
| HP ZBook Power 15 G10 | |
| Усредн. модель с AMD Ryzen 7 8845HS (62669 - 74664, n=12) | |
| Dell Precision 5000 5490 | |
| HP ZBook Power 16 G11 A | |
| MSI CreatorPro Z16P B12UKST | |
| Lenovo ThinkPad P16v G1 AMD | |
| Lenovo ThinkPad P16s G2 21K9000CGE | |
| Lenovo ThinkPad P1 G4-20Y4Z9DVUS | |
| HP ZBook Firefly 16 G9-6B897EA | |
| 7-Zip 18.03 / 7z b 4 -mmt1 | |
| HP ZBook Fury 16 G11 | |
| Lenovo ThinkPad P16v G1 AMD | |
| HP ZBook Power 15 G10 | |
| HP ZBook Power 16 G11 A | |
| Усредн. модель с AMD Ryzen 7 8845HS (5197 - 6714, n=12) | |
| Asus ExpertBook B6 Flip B6602FC2 | |
| HP ZBook Fury 16 G9 | |
| Lenovo ThinkPad P16s G2 21K9000CGE | |
| MSI CreatorPro Z16P B12UKST | |
| Lenovo ThinkPad P1 G4-20Y4Z9DVUS | |
| Dell Precision 5000 5490 | |
| Dell Precision 5690 | |
| HP ZBook Firefly 16 G9-6B897EA | |
| Geekbench 6.4 / Multi-Core | |
| HP ZBook Fury 16 G11 | |
| Dell Precision 5690 | |
| Dell Precision 5000 5490 | |
| HP ZBook Power 15 G10 | |
| Усредн. модель с AMD Ryzen 7 8845HS (11073 - 14014, n=16) | |
| HP ZBook Power 16 G11 A | |
| Lenovo ThinkPad P16s G2 21K9000CGE | |
| Lenovo ThinkPad P16v G1 AMD | |
| Geekbench 6.4 / Single-Core | |
| HP ZBook Fury 16 G11 | |
| HP ZBook Power 15 G10 | |
| Усредн. модель с AMD Ryzen 7 8845HS (2510 - 2698, n=14) | |
| HP ZBook Power 16 G11 A | |
| Lenovo ThinkPad P16v G1 AMD | |
| Dell Precision 5690 | |
| Lenovo ThinkPad P16s G2 21K9000CGE | |
| Dell Precision 5000 5490 | |
| Geekbench 5.5 / Multi-Core | |
| HP ZBook Fury 16 G11 | |
| Asus ExpertBook B6 Flip B6602FC2 | |
| Dell Precision 5690 | |
| HP ZBook Fury 16 G9 | |
| Dell Precision 5000 5490 | |
| MSI CreatorPro Z16P B12UKST | |
| HP ZBook Power 15 G10 | |
| Усредн. модель с AMD Ryzen 7 8845HS (11256 - 12726, n=13) | |
| HP ZBook Power 16 G11 A | |
| Lenovo ThinkPad P16s G2 21K9000CGE | |
| Lenovo ThinkPad P16v G1 AMD | |
| Lenovo ThinkPad P1 G4-20Y4Z9DVUS | |
| HP ZBook Firefly 16 G9-6B897EA | |
| Geekbench 5.5 / Single-Core | |
| HP ZBook Fury 16 G11 | |
| HP ZBook Power 15 G10 | |
| HP ZBook Fury 16 G9 | |
| Усредн. модель с AMD Ryzen 7 8845HS (1765 - 2004, n=13) | |
| HP ZBook Power 16 G11 A | |
| Asus ExpertBook B6 Flip B6602FC2 | |
| Dell Precision 5690 | |
| Lenovo ThinkPad P16v G1 AMD | |
| HP ZBook Firefly 16 G9-6B897EA | |
| MSI CreatorPro Z16P B12UKST | |
| Dell Precision 5000 5490 | |
| Lenovo ThinkPad P16s G2 21K9000CGE | |
| Lenovo ThinkPad P1 G4-20Y4Z9DVUS | |
| HWBOT x265 Benchmark v2.2 / 4k Preset | |
| HP ZBook Fury 16 G11 | |
| Dell Precision 5690 | |
| Asus ExpertBook B6 Flip B6602FC2 | |
| Усредн. модель с AMD Ryzen 7 8845HS (18.6 - 22.7, n=12) | |
| HP ZBook Power 15 G10 | |
| HP ZBook Fury 16 G9 | |
| HP ZBook Power 16 G11 A | |
| MSI CreatorPro Z16P B12UKST | |
| Lenovo ThinkPad P16v G1 AMD | |
| Lenovo ThinkPad P16s G2 21K9000CGE | |
| Dell Precision 5000 5490 | |
| Lenovo ThinkPad P1 G4-20Y4Z9DVUS | |
| HP ZBook Firefly 16 G9-6B897EA | |
| LibreOffice / 20 Documents To PDF | |
| HP ZBook Power 15 G10 | |
| HP ZBook Firefly 16 G9-6B897EA | |
| Lenovo ThinkPad P16s G2 21K9000CGE | |
| HP ZBook Power 16 G11 A | |
| Усредн. модель с AMD Ryzen 7 8845HS (44.4 - 77, n=12) | |
| Lenovo ThinkPad P1 G4-20Y4Z9DVUS | |
| HP ZBook Fury 16 G11 | |
| Lenovo ThinkPad P16v G1 AMD | |
| Dell Precision 5000 5490 | |
| Asus ExpertBook B6 Flip B6602FC2 | |
| Dell Precision 5690 | |
| MSI CreatorPro Z16P B12UKST | |
| HP ZBook Fury 16 G9 | |
| R Benchmark 2.5 / Overall mean | |
| Lenovo ThinkPad P1 G4-20Y4Z9DVUS | |
| HP ZBook Firefly 16 G9-6B897EA | |
| Dell Precision 5000 5490 | |
| Lenovo ThinkPad P16s G2 21K9000CGE | |
| Dell Precision 5690 | |
| MSI CreatorPro Z16P B12UKST | |
| Усредн. модель с AMD Ryzen 7 8845HS (0.4304 - 0.4935, n=12) | |
| Asus ExpertBook B6 Flip B6602FC2 | |
| HP ZBook Power 15 G10 | |
| HP ZBook Power 16 G11 A | |
| Lenovo ThinkPad P16v G1 AMD | |
| HP ZBook Fury 16 G9 | |
| HP ZBook Fury 16 G11 | |
Cinebench R23: Multi Core | Single Core
Cinebench R20: CPU (Multi Core) | CPU (Single Core)
Cinebench R15: CPU Multi 64Bit | CPU Single 64Bit
Blender: v2.79 BMW27 CPU
7-Zip 18.03: 7z b 4 | 7z b 4 -mmt1
Geekbench 6.4: Multi-Core | Single-Core
Geekbench 5.5: Multi-Core | Single-Core
HWBOT x265 Benchmark v2.2: 4k Preset
LibreOffice : 20 Documents To PDF
R Benchmark 2.5: Overall mean
* ... меньше = лучше
AIDA64: FP32 Ray-Trace | FPU Julia | CPU SHA3 | CPU Queen | FPU SinJulia | FPU Mandel | CPU AES | CPU ZLib | FP64 Ray-Trace | CPU PhotoWorxx
| Performance Rating | |
| Усредн. модель с AMD Ryzen 7 8845HS | |
| HP ZBook Power 15 G10 | |
| HP ZBook Power 16 G11 A | |
| HP ZBook Fury 16 G11 | |
| Lenovo ThinkPad P16s G2 21K9000CGE | |
| Dell Precision 5690 | |
| Lenovo ThinkPad P1 Gen 7 21KV001SGE | |
| AIDA64 / FP32 Ray-Trace | |
| Усредн. модель с AMD Ryzen 7 8845HS (23708 - 29544, n=12) | |
| HP ZBook Power 15 G10 | |
| HP ZBook Power 16 G11 A | |
| Lenovo ThinkPad P16s G2 21K9000CGE | |
| HP ZBook Fury 16 G11 | |
| Dell Precision 5690 | |
| Lenovo ThinkPad P1 Gen 7 21KV001SGE | |
| AIDA64 / FPU Julia | |
| HP ZBook Power 16 G11 A | |
| Усредн. модель с AMD Ryzen 7 8845HS (99659 - 125873, n=12) | |
| HP ZBook Power 15 G10 | |
| HP ZBook Fury 16 G11 | |
| Lenovo ThinkPad P16s G2 21K9000CGE | |
| Dell Precision 5690 | |
| Lenovo ThinkPad P1 Gen 7 21KV001SGE | |
| AIDA64 / CPU SHA3 | |
| HP ZBook Fury 16 G11 | |
| HP ZBook Power 16 G11 A | |
| Усредн. модель с AMD Ryzen 7 8845HS (4332 - 5180, n=12) | |
| HP ZBook Power 15 G10 | |
| Lenovo ThinkPad P16s G2 21K9000CGE | |
| Dell Precision 5690 | |
| Lenovo ThinkPad P1 Gen 7 21KV001SGE | |
| AIDA64 / CPU Queen | |
| HP ZBook Fury 16 G11 | |
| HP ZBook Power 16 G11 A | |
| Усредн. модель с AMD Ryzen 7 8845HS (109458 - 124695, n=12) | |
| HP ZBook Power 15 G10 | |
| Lenovo ThinkPad P16s G2 21K9000CGE | |
| Dell Precision 5690 | |
| Lenovo ThinkPad P1 Gen 7 21KV001SGE | |
| AIDA64 / FPU SinJulia | |
| Усредн. модель с AMD Ryzen 7 8845HS (14062 - 15519, n=12) | |
| HP ZBook Power 15 G10 | |
| HP ZBook Power 16 G11 A | |
| Lenovo ThinkPad P16s G2 21K9000CGE | |
| HP ZBook Fury 16 G11 | |
| Dell Precision 5690 | |
| Lenovo ThinkPad P1 Gen 7 21KV001SGE | |
| AIDA64 / FPU Mandel | |
| Усредн. модель с AMD Ryzen 7 8845HS (53436 - 67367, n=12) | |
| HP ZBook Power 15 G10 | |
| HP ZBook Power 16 G11 A | |
| Lenovo ThinkPad P16s G2 21K9000CGE | |
| HP ZBook Fury 16 G11 | |
| Dell Precision 5690 | |
| Lenovo ThinkPad P1 Gen 7 21KV001SGE | |
| AIDA64 / CPU AES | |
| HP ZBook Fury 16 G11 | |
| Усредн. модель с AMD Ryzen 7 8845HS (64515 - 172642, n=12) | |
| Dell Precision 5690 | |
| HP ZBook Power 15 G10 | |
| Lenovo ThinkPad P1 Gen 7 21KV001SGE | |
| HP ZBook Power 16 G11 A | |
| Lenovo ThinkPad P16s G2 21K9000CGE | |
| AIDA64 / CPU ZLib | |
| HP ZBook Fury 16 G11 | |
| Dell Precision 5690 | |
| Lenovo ThinkPad P1 Gen 7 21KV001SGE | |
| HP ZBook Power 16 G11 A | |
| HP ZBook Power 15 G10 | |
| Lenovo ThinkPad P16s G2 21K9000CGE | |
| Усредн. модель с AMD Ryzen 7 8845HS (627 - 1080, n=12) | |
| AIDA64 / FP64 Ray-Trace | |
| HP ZBook Power 15 G10 | |
| Усредн. модель с AMD Ryzen 7 8845HS (12361 - 15911, n=12) | |
| HP ZBook Power 16 G11 A | |
| Lenovo ThinkPad P16s G2 21K9000CGE | |
| HP ZBook Fury 16 G11 | |
| Dell Precision 5690 | |
| Lenovo ThinkPad P1 Gen 7 21KV001SGE | |
| AIDA64 / CPU PhotoWorxx | |
| Dell Precision 5690 | |
| HP ZBook Power 15 G10 | |
| Lenovo ThinkPad P1 Gen 7 21KV001SGE | |
| HP ZBook Power 16 G11 A | |
| Усредн. модель с AMD Ryzen 7 8845HS (33192 - 41668, n=12) | |
| Lenovo ThinkPad P16s G2 21K9000CGE | |
| HP ZBook Fury 16 G11 | |
Стресс-тест
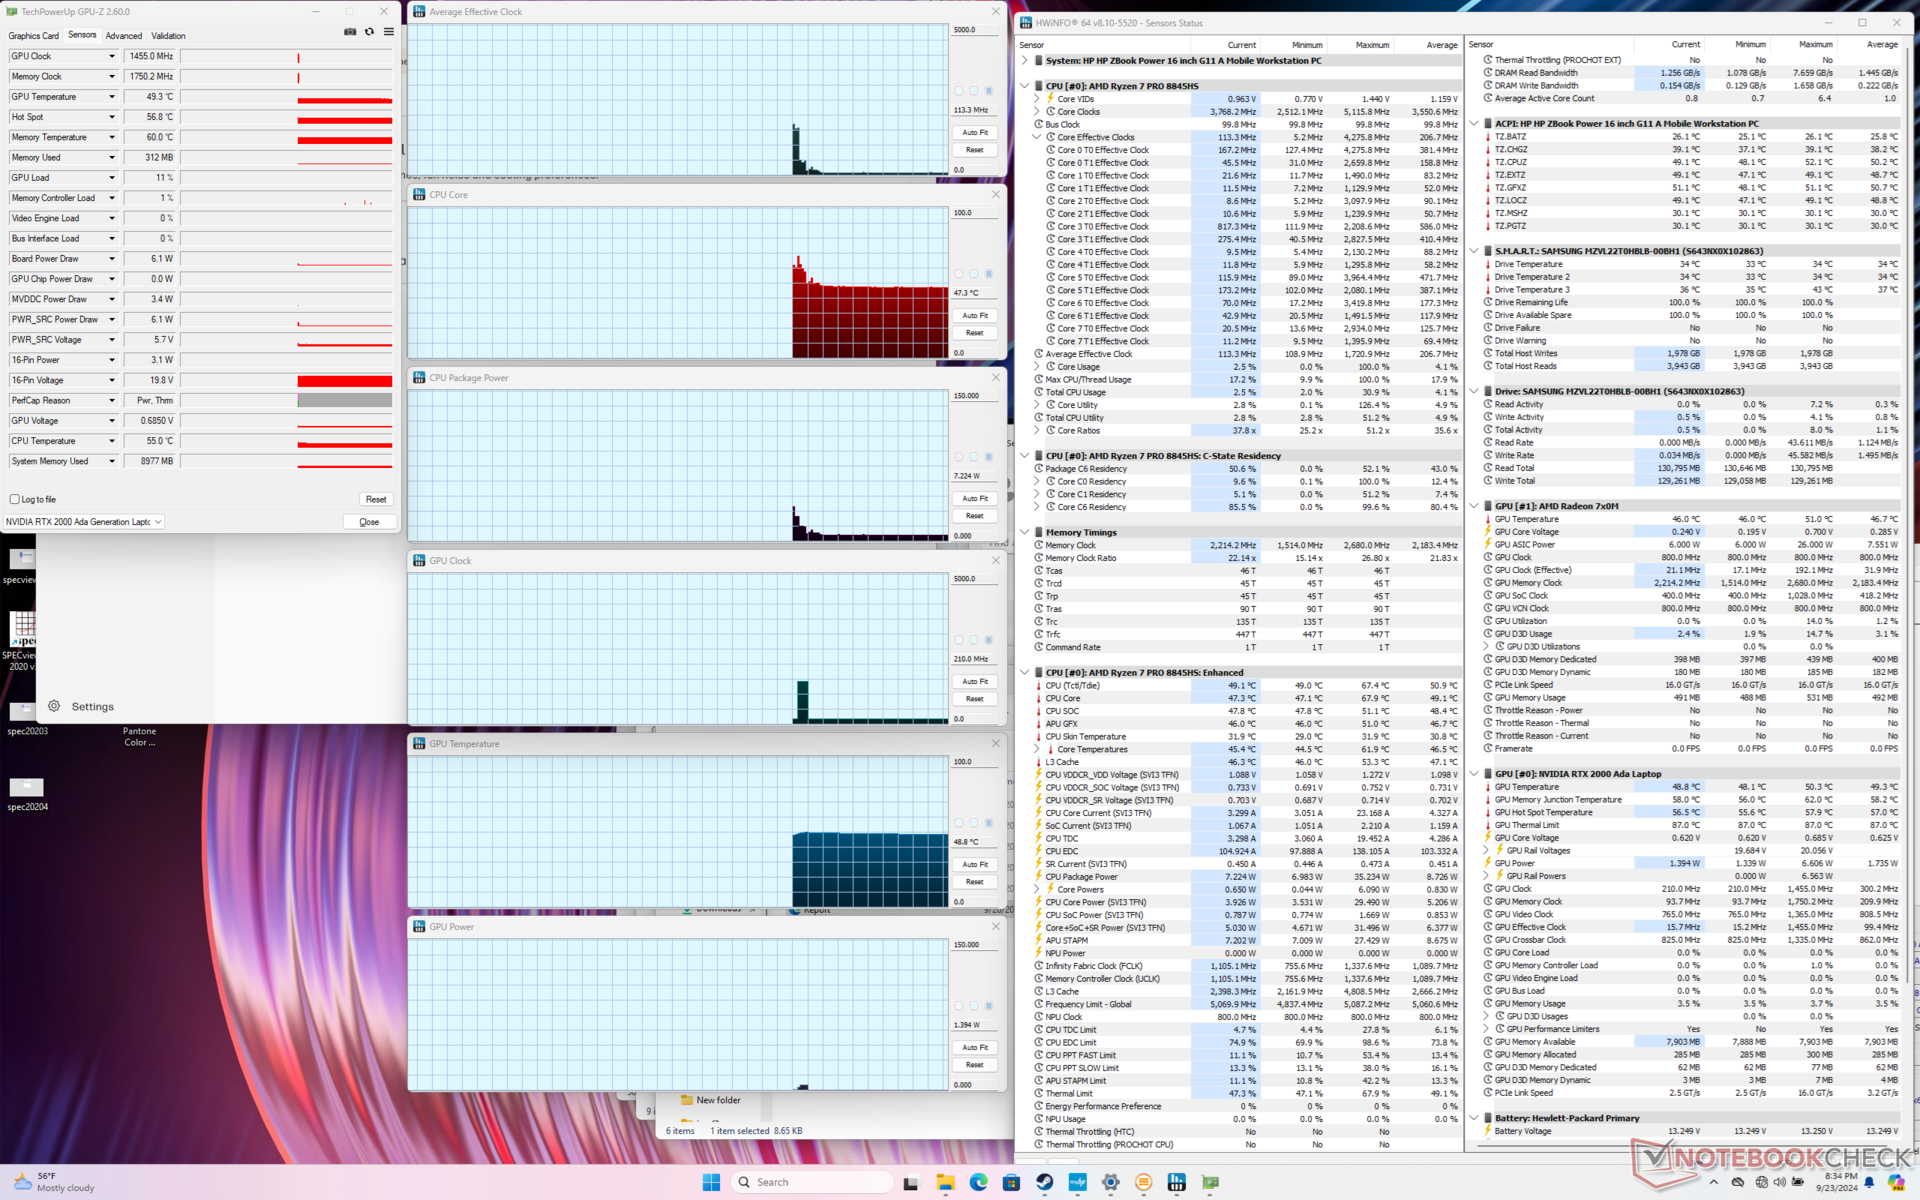
При запуске стресса Prime95 процессор разгонялся до 4,3 ГГц, 65 Вт и 90 C, после чего быстро снижался и стабилизировался на частоте 3,8 ГГц и 50 Вт, чтобы предотвратить повышение температуры ядра. Результаты близки к тем, что мы наблюдали на ZBook Power 15 G10, если не немного теплее на несколько градусов.
Интересно, что при одновременном запуске Prime95 и FurMark процессор снижает частоту до 2,8 ГГц, а не до 3,8 ГГц, как в прошлогодней модели. Это изменение, скорее всего, улучшило температуру ядра; теперь температура процессора стабилизируется на более комфортном уровне 66 C, а не 99 C, как на ZBook Power 15 G10.
Запуск Cyberpunk 2077 в сбалансированном режиме вместо режима Performance приводит как к немного более низкой температуре ядра, так и к немного более низкой средней тактовой частоте, как показано ниже. Потребляемая мощность платы GPU также снизится с 35 Вт до 30 Вт против заявленных 50 Вт.
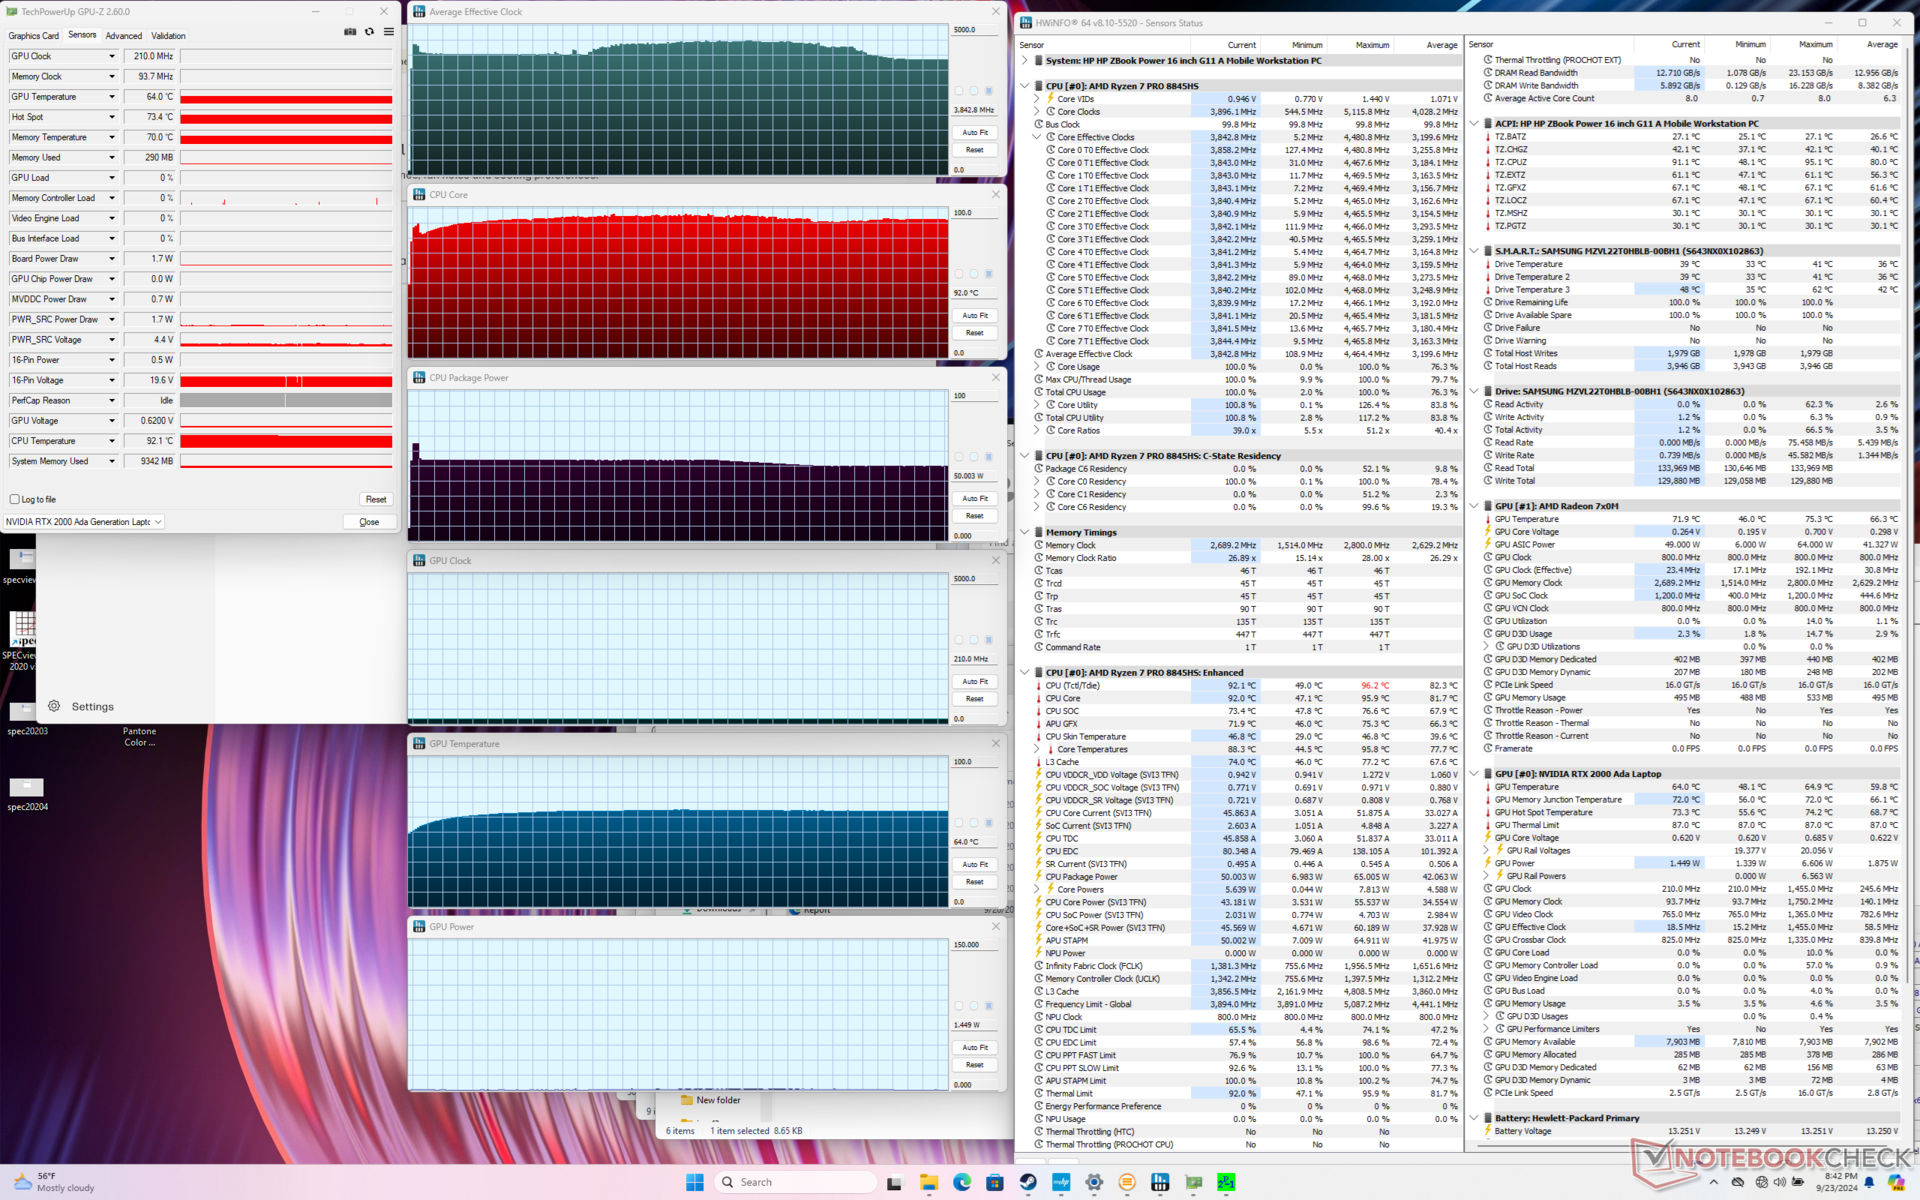
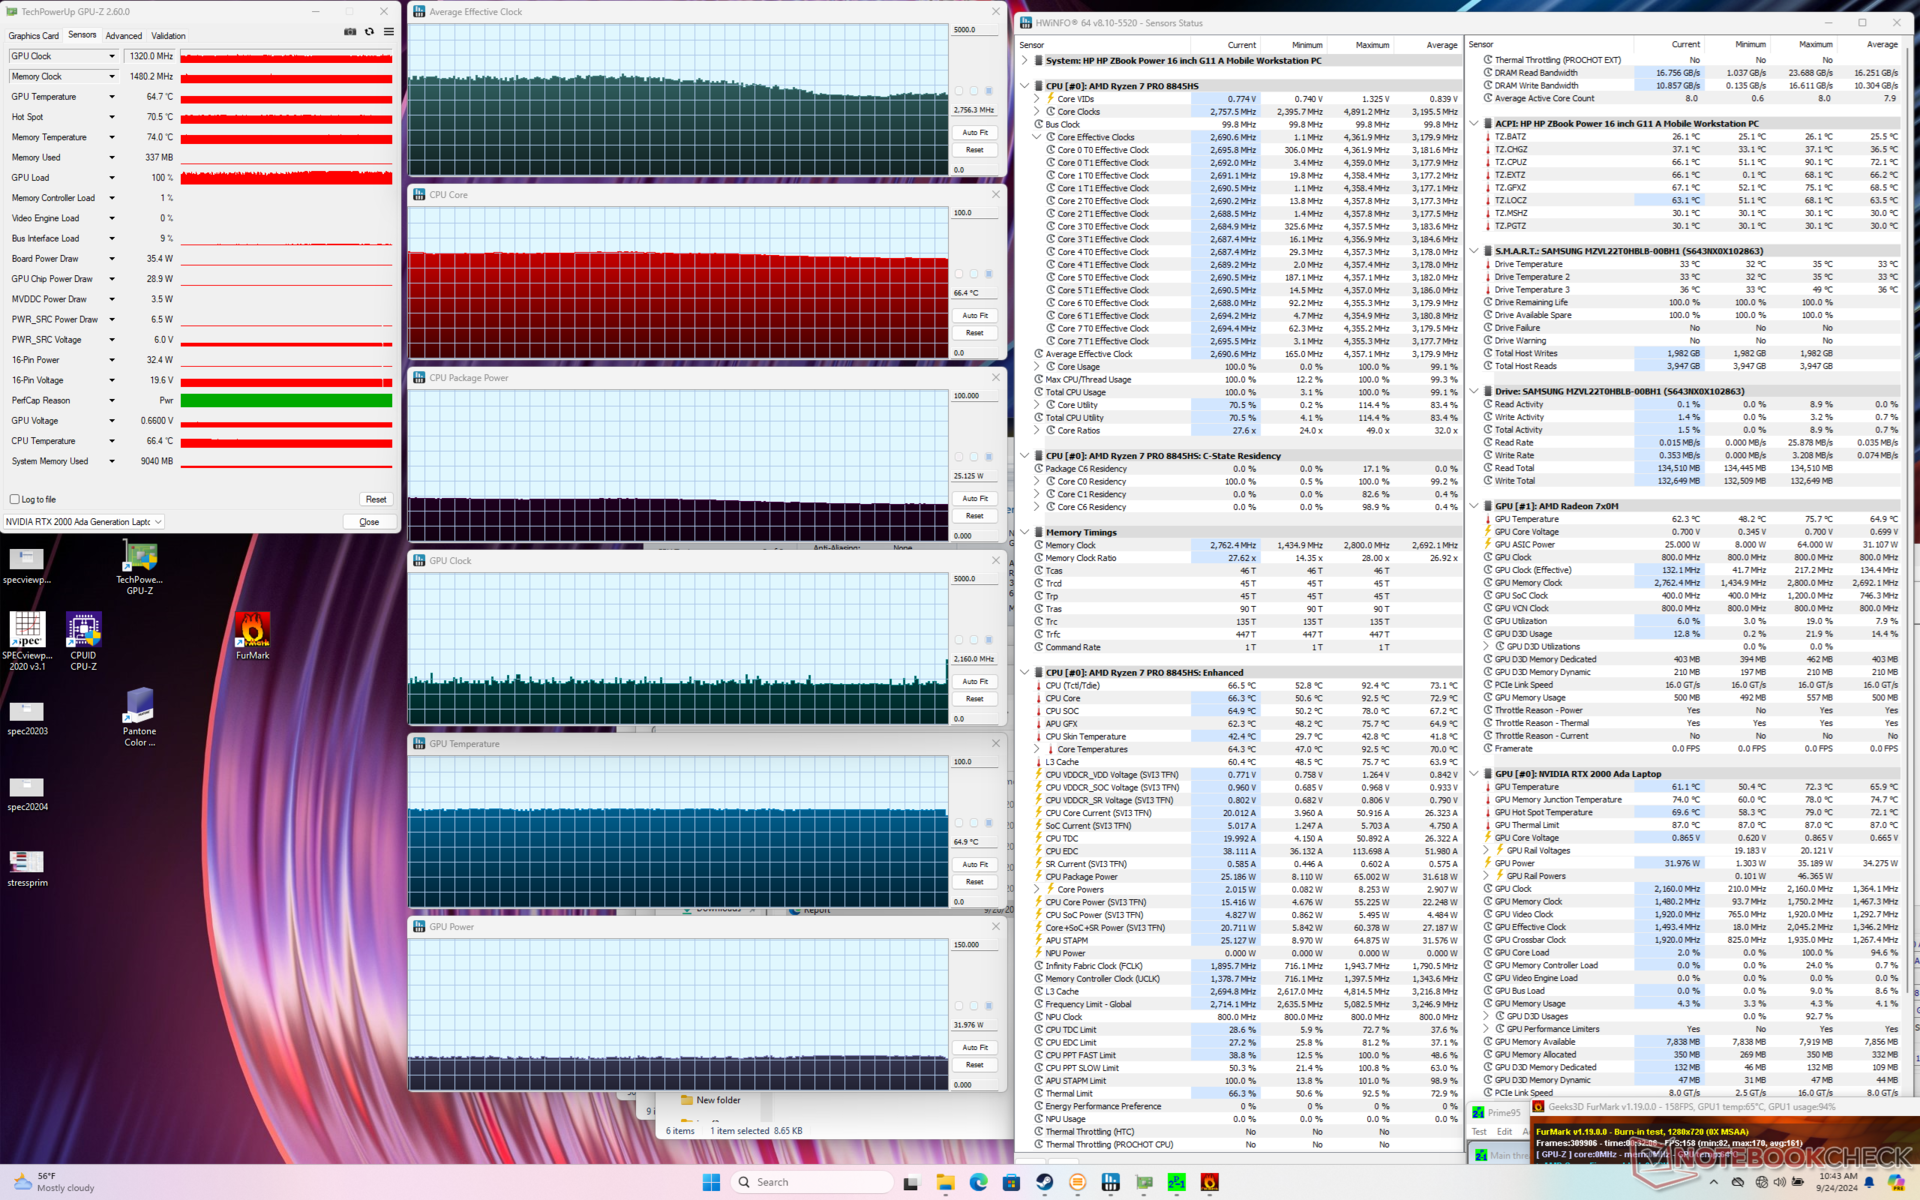
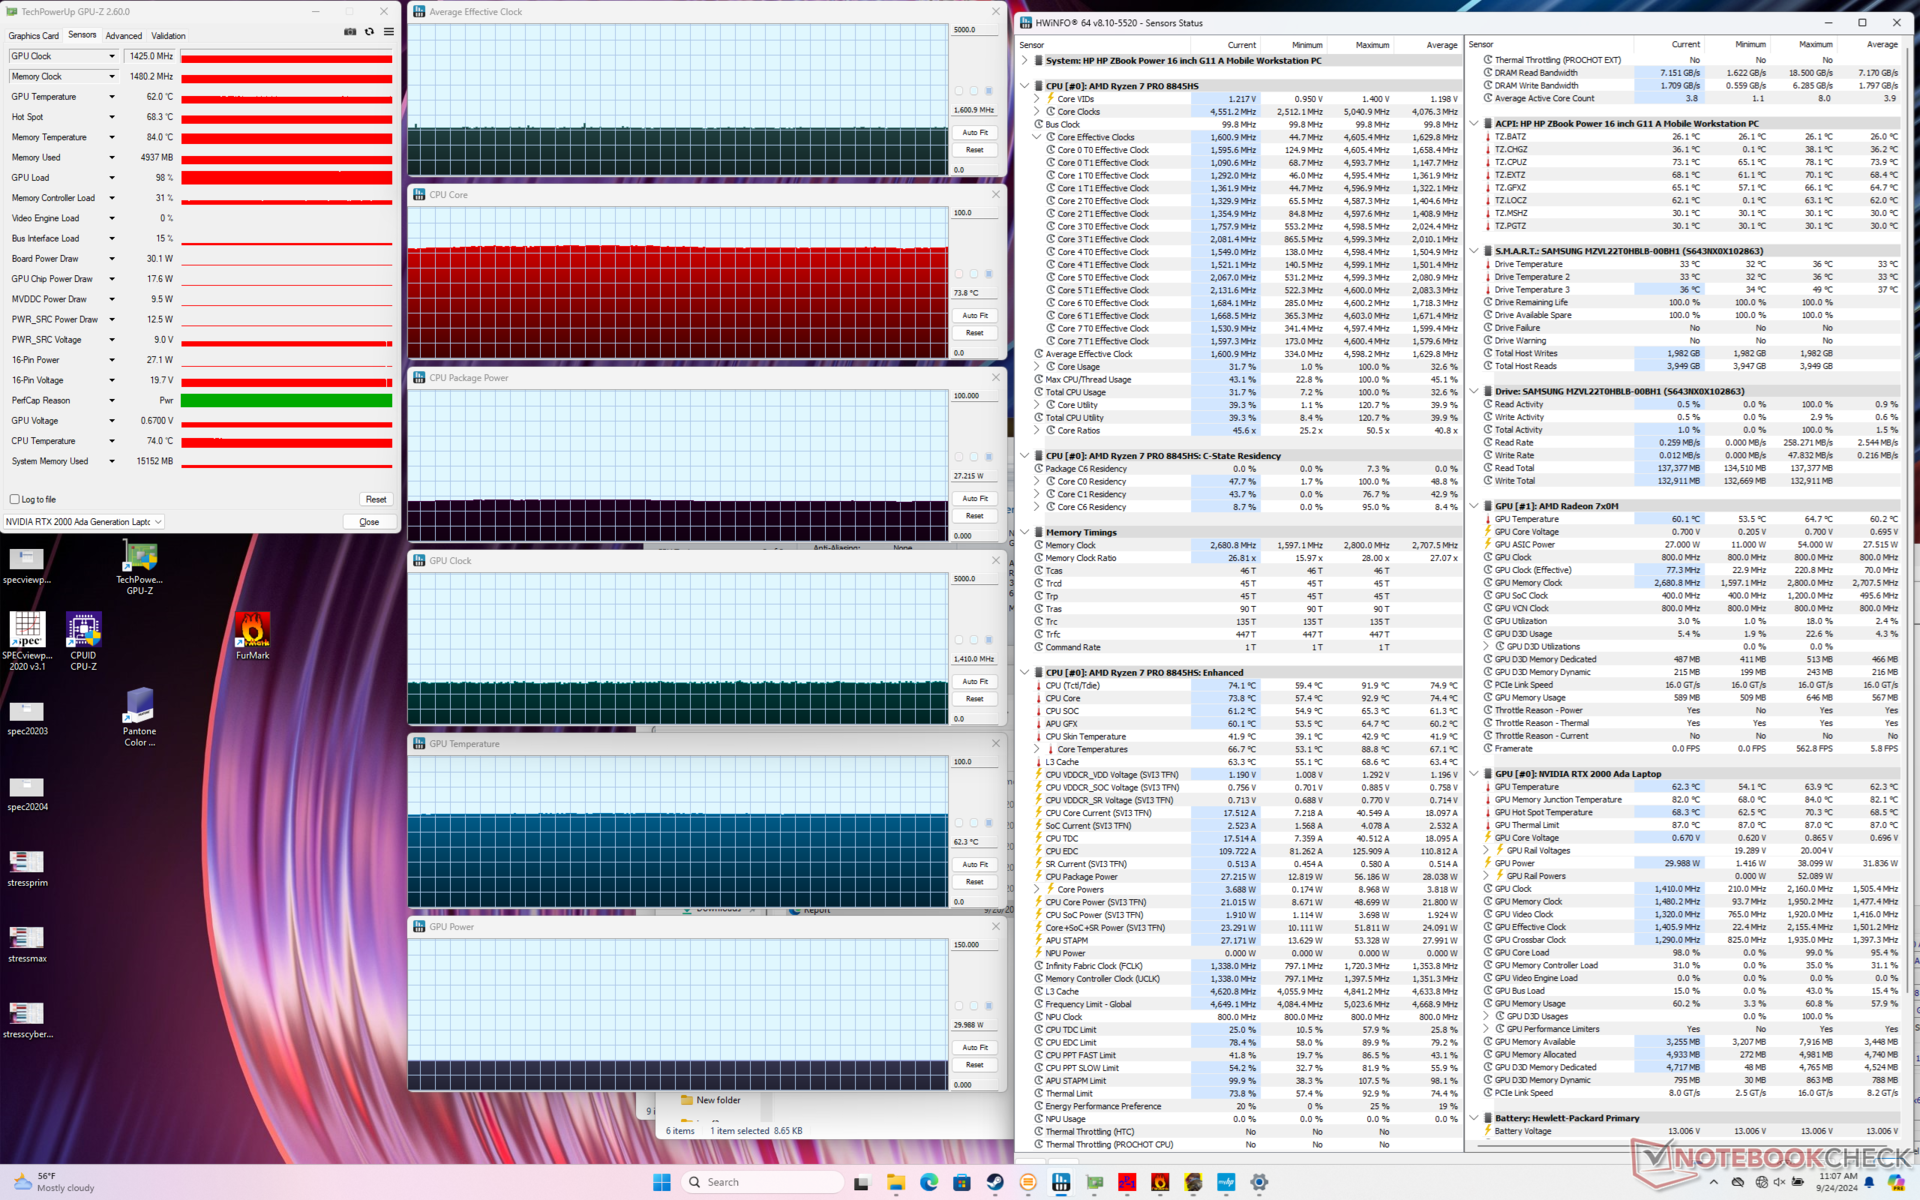
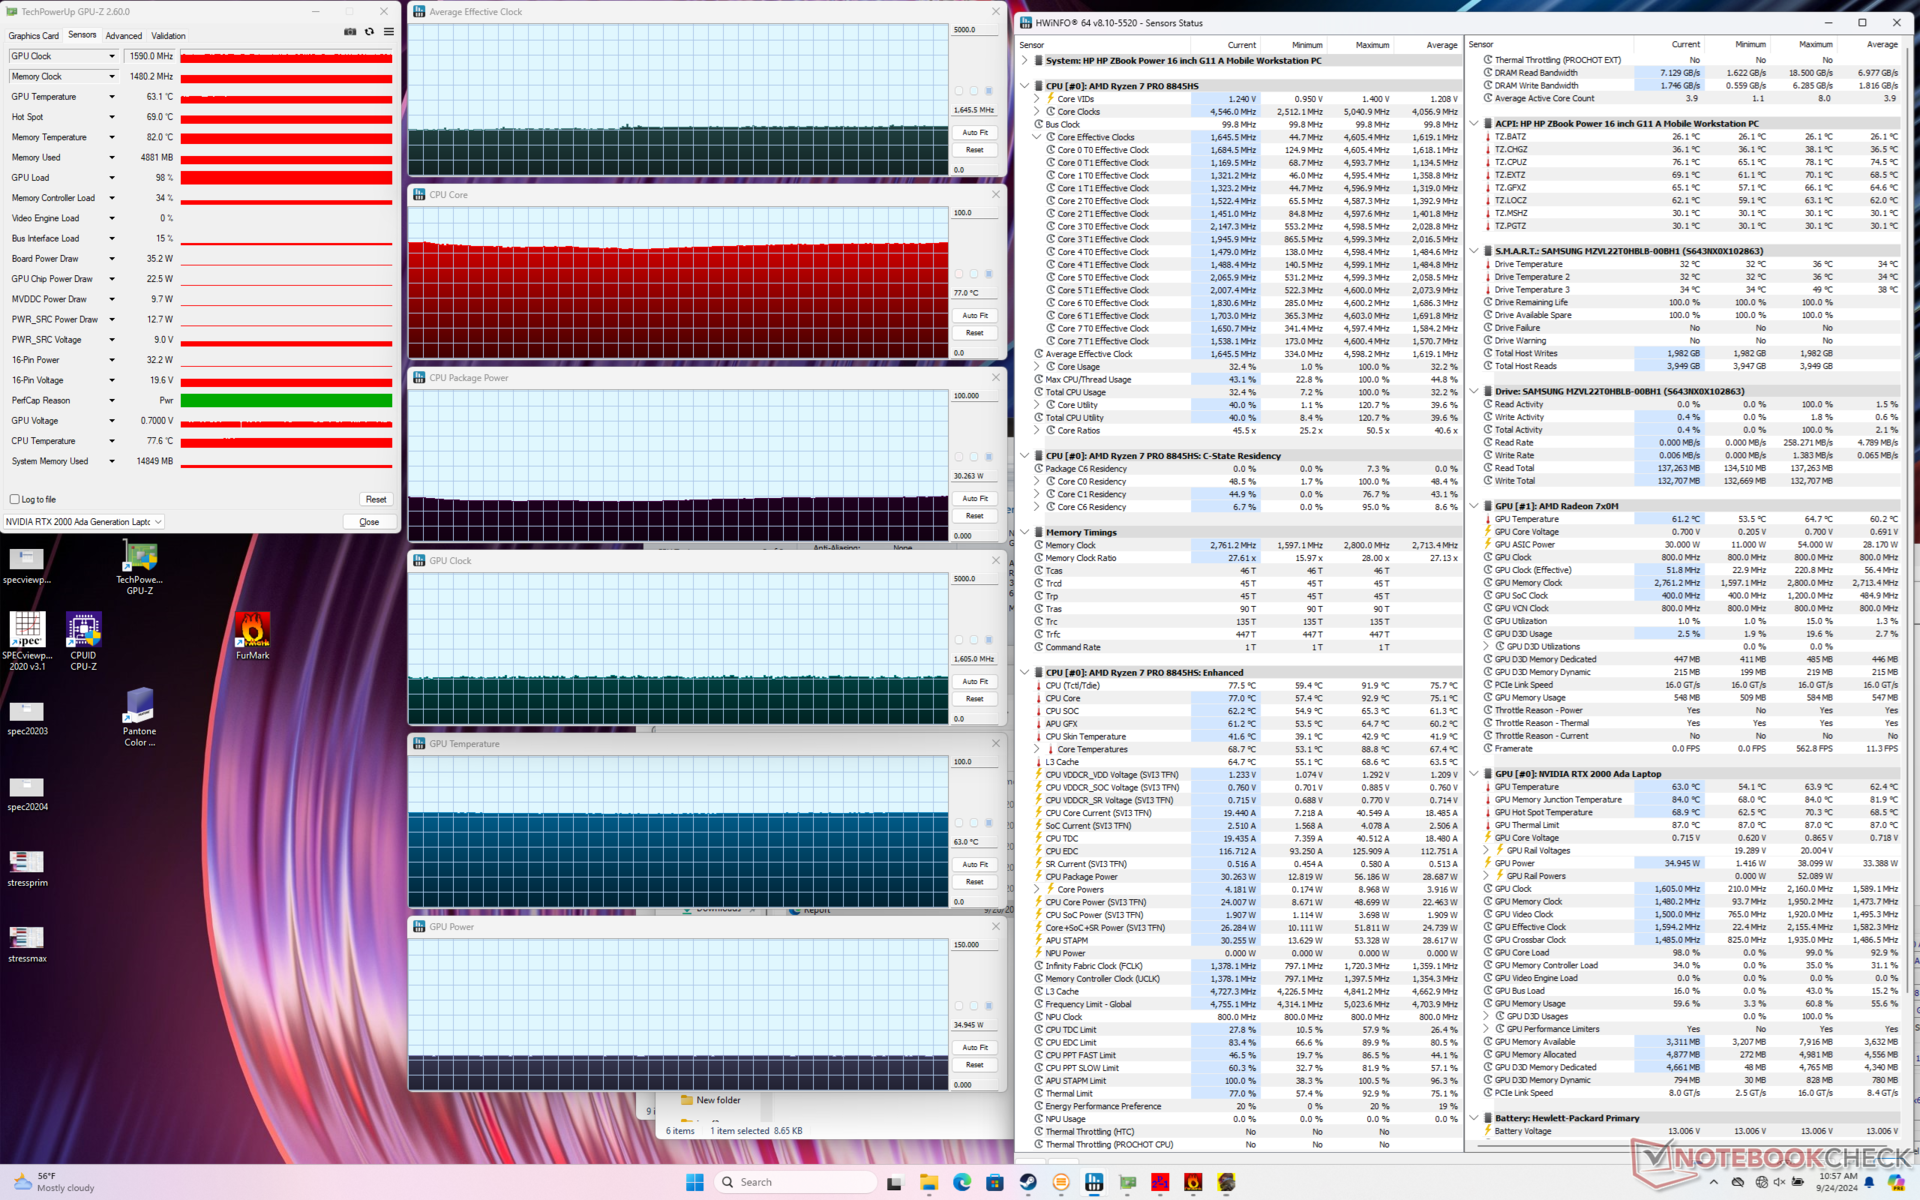
| Средняя тактовая частота CPU (ГГц) | Тактовая частота GPU (МГц) | Средняя температура CPU (°C) | Средняя температура GPU (°C) | |
| Простой системы | -- | -- | 47 | 49 |
| Prime95 Stress | 3.9 | -- | 92 | 64 |
| Prime95 + FurMark Stress | 2.8 | 1320 | 66 | 65 |
| Cyberpunk 2077 Stress (сбалансированный режим) | 1.6 | 1425 | 74 | 62 |
| Cyberpunk 2077 Stress (режим Performance) | 1.7 | 1590 | 77 | 63 |
Производительность системы
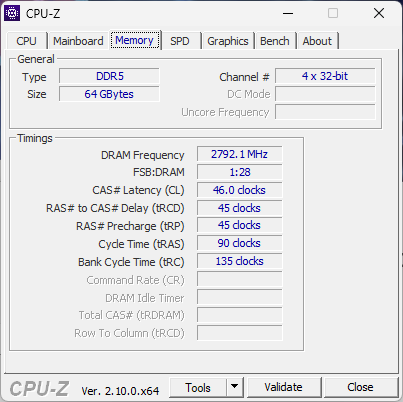
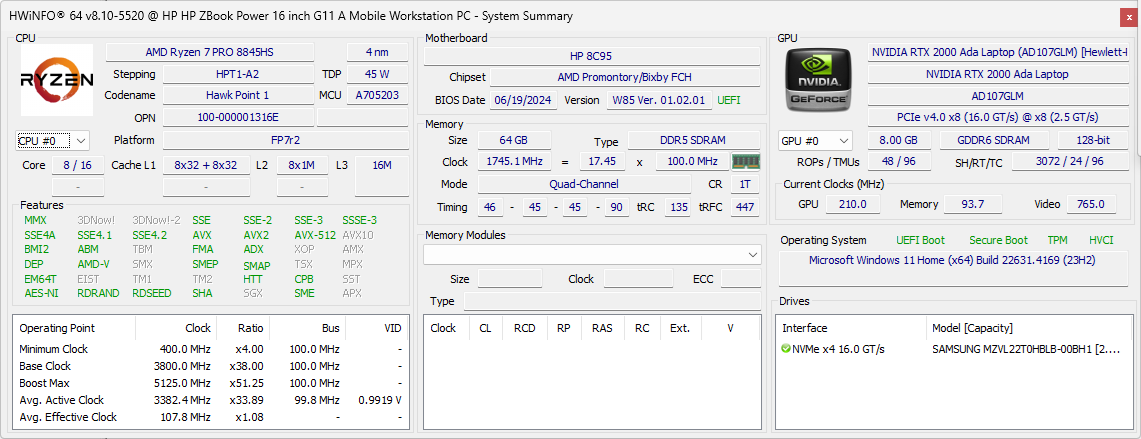
Результаты PCMark практически идентичны тем, которые мы зафиксировали на прошлогоднем ZBook Power 15 G10. Это означает, что традиционные повседневные нагрузки, такие как просмотр веб-страниц или редактирование, не стали заметно быстрее на нашей новой модели. Производительность оперативной памяти также не улучшилась.
Мы столкнулись с проблемой пробуждения из спящего режима, когда для возврата в Windows требовалось жесткое выключение. Мы не смогли достоверно воспроизвести эту проблему, но тот факт, что она вообще возникла на мобильной рабочей станции, заслуживает внимания.

CrossMark: Overall | Productivity | Creativity | Responsiveness
WebXPRT 3: Overall
WebXPRT 4: Overall
Mozilla Kraken 1.1: Total
| PCMark 10 / Score | |
| Dell Precision 5690 | |
| HP ZBook Fury 16 G11 | |
| HP ZBook Power 15 G10 | |
| HP ZBook Power 16 G11 A | |
| Усредн. модель с AMD Ryzen 7 8845HS, NVIDIA RTX 2000 Ada Generation Laptop GPU (n=1) | |
| Lenovo ThinkPad P1 Gen 7 21KV001SGE | |
| Lenovo ThinkPad P16s G2 21K9000CGE | |
| PCMark 10 / Essentials | |
| Dell Precision 5690 | |
| HP ZBook Power 15 G10 | |
| HP ZBook Power 16 G11 A | |
| Усредн. модель с AMD Ryzen 7 8845HS, NVIDIA RTX 2000 Ada Generation Laptop GPU (n=1) | |
| Lenovo ThinkPad P1 Gen 7 21KV001SGE | |
| Lenovo ThinkPad P16s G2 21K9000CGE | |
| HP ZBook Fury 16 G11 | |
| PCMark 10 / Productivity | |
| Dell Precision 5690 | |
| HP ZBook Power 15 G10 | |
| HP ZBook Power 16 G11 A | |
| Усредн. модель с AMD Ryzen 7 8845HS, NVIDIA RTX 2000 Ada Generation Laptop GPU (n=1) | |
| HP ZBook Fury 16 G11 | |
| Lenovo ThinkPad P1 Gen 7 21KV001SGE | |
| Lenovo ThinkPad P16s G2 21K9000CGE | |
| PCMark 10 / Digital Content Creation | |
| HP ZBook Fury 16 G11 | |
| Dell Precision 5690 | |
| Lenovo ThinkPad P1 Gen 7 21KV001SGE | |
| HP ZBook Power 15 G10 | |
| HP ZBook Power 16 G11 A | |
| Усредн. модель с AMD Ryzen 7 8845HS, NVIDIA RTX 2000 Ada Generation Laptop GPU (n=1) | |
| Lenovo ThinkPad P16s G2 21K9000CGE | |
| CrossMark / Overall | |
| HP ZBook Fury 16 G11 | |
| Dell Precision 5690 | |
| HP ZBook Power 16 G11 A | |
| Усредн. модель с AMD Ryzen 7 8845HS, NVIDIA RTX 2000 Ada Generation Laptop GPU (n=1) | |
| Lenovo ThinkPad P1 Gen 7 21KV001SGE | |
| HP ZBook Power 15 G10 | |
| Lenovo ThinkPad P16s G2 21K9000CGE | |
| CrossMark / Productivity | |
| HP ZBook Fury 16 G11 | |
| Dell Precision 5690 | |
| HP ZBook Power 16 G11 A | |
| Усредн. модель с AMD Ryzen 7 8845HS, NVIDIA RTX 2000 Ada Generation Laptop GPU (n=1) | |
| Lenovo ThinkPad P1 Gen 7 21KV001SGE | |
| HP ZBook Power 15 G10 | |
| Lenovo ThinkPad P16s G2 21K9000CGE | |
| CrossMark / Creativity | |
| HP ZBook Fury 16 G11 | |
| HP ZBook Power 16 G11 A | |
| Усредн. модель с AMD Ryzen 7 8845HS, NVIDIA RTX 2000 Ada Generation Laptop GPU (n=1) | |
| Dell Precision 5690 | |
| Lenovo ThinkPad P1 Gen 7 21KV001SGE | |
| HP ZBook Power 15 G10 | |
| Lenovo ThinkPad P16s G2 21K9000CGE | |
| CrossMark / Responsiveness | |
| HP ZBook Fury 16 G11 | |
| Dell Precision 5690 | |
| HP ZBook Power 16 G11 A | |
| Усредн. модель с AMD Ryzen 7 8845HS, NVIDIA RTX 2000 Ada Generation Laptop GPU (n=1) | |
| Lenovo ThinkPad P1 Gen 7 21KV001SGE | |
| Lenovo ThinkPad P16s G2 21K9000CGE | |
| HP ZBook Power 15 G10 | |
| WebXPRT 3 / Overall | |
| HP ZBook Fury 16 G11 | |
| HP ZBook Power 15 G10 | |
| HP ZBook Power 16 G11 A | |
| Усредн. модель с AMD Ryzen 7 8845HS, NVIDIA RTX 2000 Ada Generation Laptop GPU (n=1) | |
| Dell Precision 5690 | |
| Lenovo ThinkPad P1 Gen 7 21KV001SGE | |
| Lenovo ThinkPad P16s G2 21K9000CGE | |
| WebXPRT 4 / Overall | |
| HP ZBook Fury 16 G11 | |
| Dell Precision 5690 | |
| Lenovo ThinkPad P1 Gen 7 21KV001SGE | |
| HP ZBook Power 16 G11 A | |
| Усредн. модель с AMD Ryzen 7 8845HS, NVIDIA RTX 2000 Ada Generation Laptop GPU (n=1) | |
| HP ZBook Power 15 G10 | |
| Mozilla Kraken 1.1 / Total | |
| Lenovo ThinkPad P16s G2 21K9000CGE | |
| HP ZBook Power 15 G10 | |
| HP ZBook Power 16 G11 A | |
| Усредн. модель с AMD Ryzen 7 8845HS, NVIDIA RTX 2000 Ada Generation Laptop GPU (n=1) | |
| Lenovo ThinkPad P1 Gen 7 21KV001SGE | |
| Dell Precision 5690 | |
| HP ZBook Fury 16 G11 | |
* ... меньше = лучше
| PCMark 10 Score | 7376 баллов | |
? | ||
| AIDA64 / Memory Copy | |
| Dell Precision 5690 | |
| HP ZBook Power 15 G10 | |
| Усредн. модель с AMD Ryzen 7 8845HS (61459 - 71873, n=12) | |
| Lenovo ThinkPad P16s G2 21K9000CGE | |
| Lenovo ThinkPad P1 Gen 7 21KV001SGE | |
| HP ZBook Power 16 G11 A | |
| HP ZBook Fury 16 G11 | |
| AIDA64 / Memory Read | |
| Dell Precision 5690 | |
| Lenovo ThinkPad P1 Gen 7 21KV001SGE | |
| HP ZBook Power 15 G10 | |
| HP ZBook Power 16 G11 A | |
| HP ZBook Fury 16 G11 | |
| Усредн. модель с AMD Ryzen 7 8845HS (49866 - 61976, n=12) | |
| Lenovo ThinkPad P16s G2 21K9000CGE | |
| AIDA64 / Memory Write | |
| Lenovo ThinkPad P16s G2 21K9000CGE | |
| Усредн. модель с AMD Ryzen 7 8845HS (68425 - 93239, n=12) | |
| HP ZBook Power 15 G10 | |
| HP ZBook Power 16 G11 A | |
| Dell Precision 5690 | |
| Lenovo ThinkPad P1 Gen 7 21KV001SGE | |
| HP ZBook Fury 16 G11 | |
| AIDA64 / Memory Latency | |
| Dell Precision 5690 | |
| Lenovo ThinkPad P1 Gen 7 21KV001SGE | |
| Lenovo ThinkPad P16s G2 21K9000CGE | |
| HP ZBook Power 15 G10 | |
| HP ZBook Power 16 G11 A | |
| Усредн. модель с AMD Ryzen 7 8845HS (82.5 - 117, n=12) | |
| HP ZBook Fury 16 G11 | |
* ... меньше = лучше
Задержка DPC
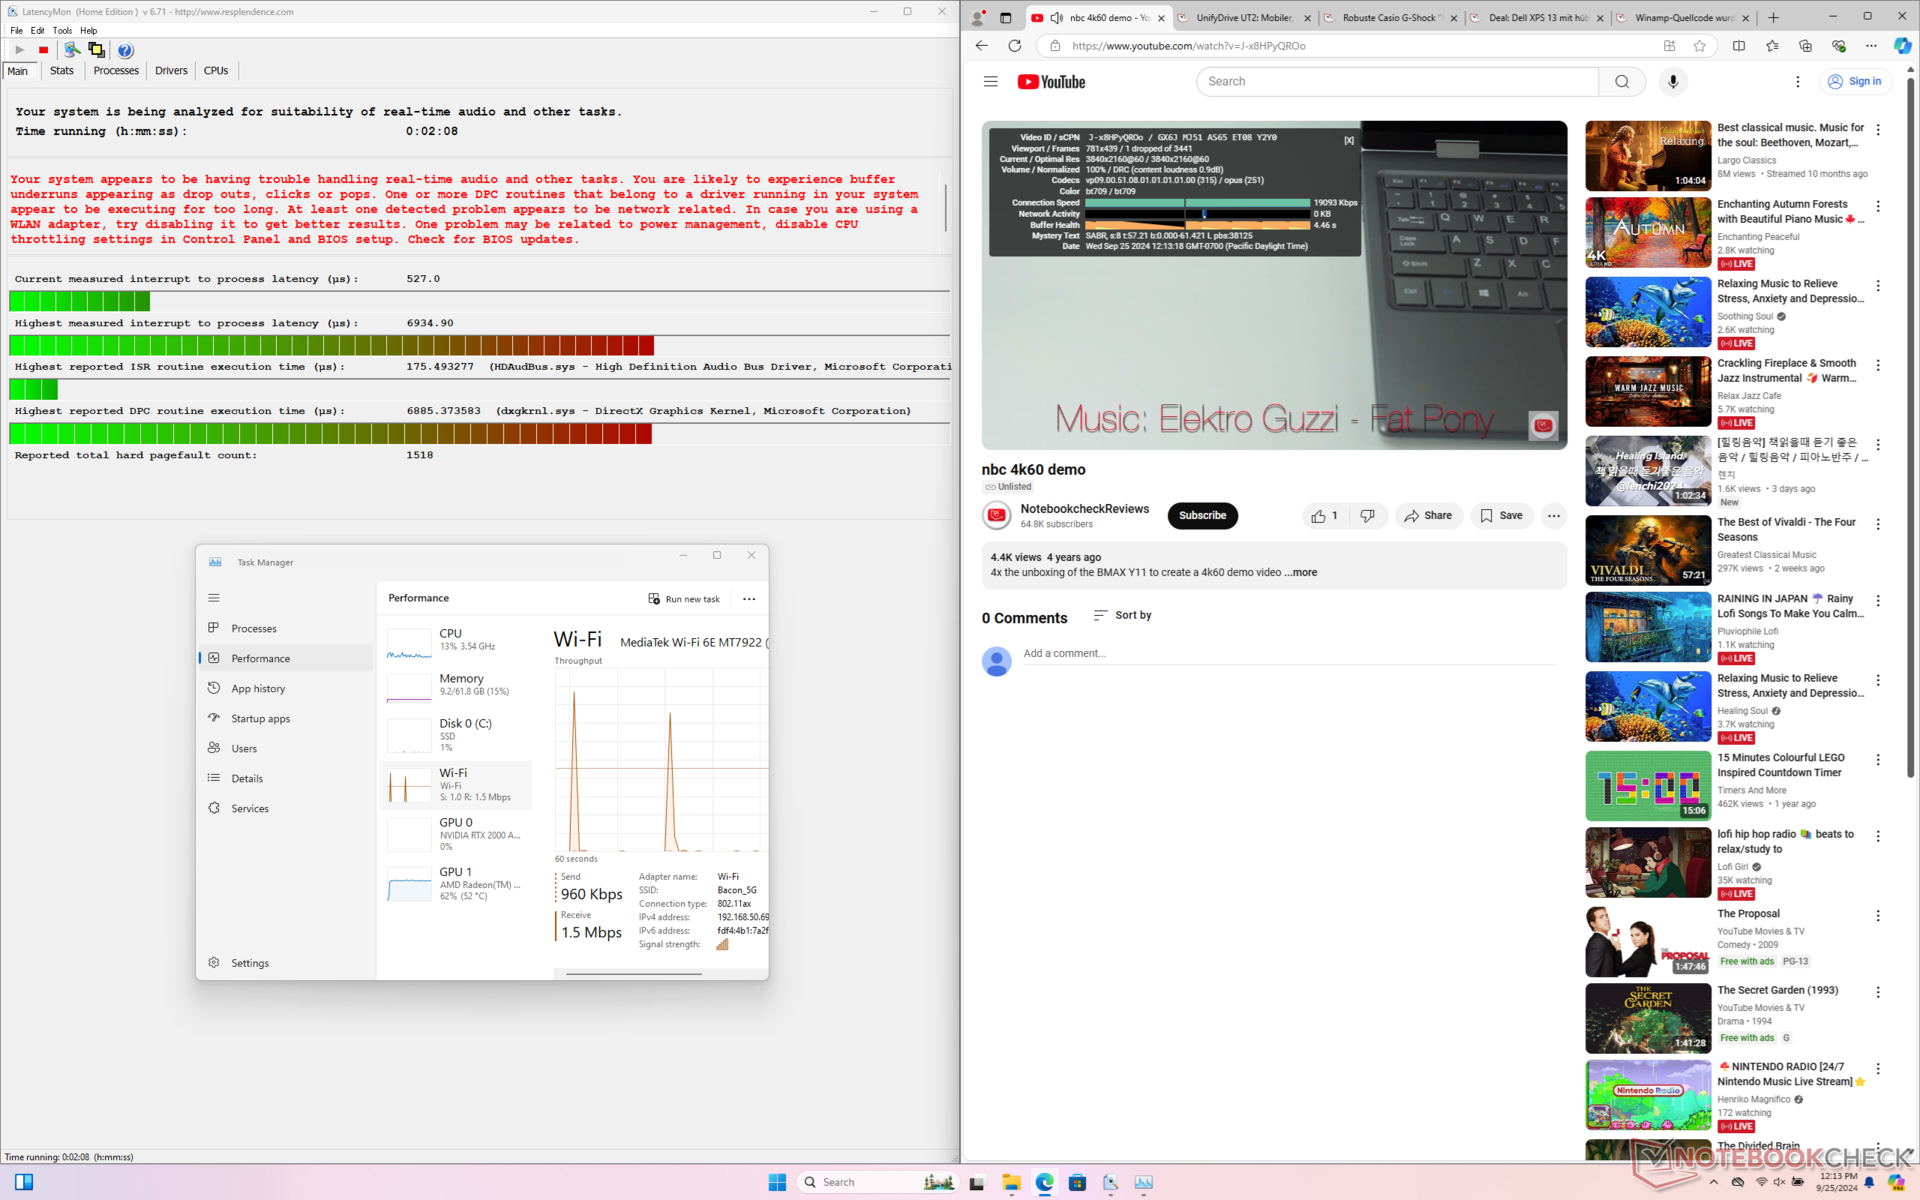
LatencyMon обнаруживает проблемы с DPC, связанные с HDAudBus.sys, даже после многократных повторных тестов. воспроизведение 4K-видео с частотой 60 кадров в секунду в остальном превосходно: за 60-секундное окно был зафиксирован всего один выпавший кадр.

| DPC Latencies / LatencyMon - interrupt to process latency (max), Web, Youtube, Prime95 | |
| HP ZBook Fury 16 G11 | |
| HP ZBook Power 16 G11 A | |
| HP ZBook Power 15 G10 | |
| Lenovo ThinkPad P1 Gen 7 21KV001SGE | |
| Lenovo ThinkPad P16s G2 21K9000CGE | |
| Dell Precision 5690 | |
* ... меньше = лучше
Хранение данных
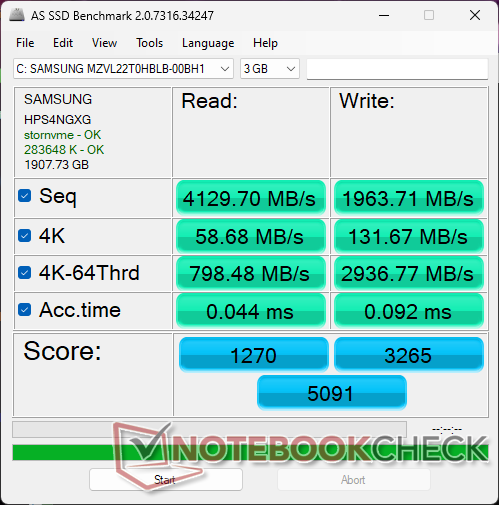
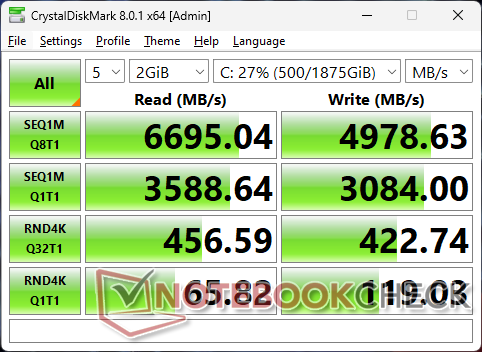
Наше тестовое устройство поставляется с накопителем объемом 2 ТБ Samsung PM9A1 PCIe4 x4 NVMe SSD для скорости последовательного чтения до 6700 МБ/с. К сожалению, после нескольких минут нагрузки накопитель быстро снижал скорость чтения до низких 2000 МБ/с, как показано ниже в результатах нашего теста DiskSpd loop. Мы повторили тест, и результаты не улучшились. Это разочаровывает, поскольку накопитель WD в более старом ZBook Power 15 G10 не имел проблем с дросселированием. Рассеиватель тепла, скорее всего, улучшил бы производительность.

| Drive Performance Rating - Percent | |
| HP ZBook Fury 16 G11 | |
| Dell Precision 5690 | |
| Lenovo ThinkPad P16s G2 21K9000CGE | |
| HP ZBook Power 15 G10 | |
| HP ZBook Power 16 G11 A | |
| Lenovo ThinkPad P1 Gen 7 21KV001SGE | |
* ... меньше = лучше
Чтение в DiskSpd, Глубина запроса 8
Видеокарта
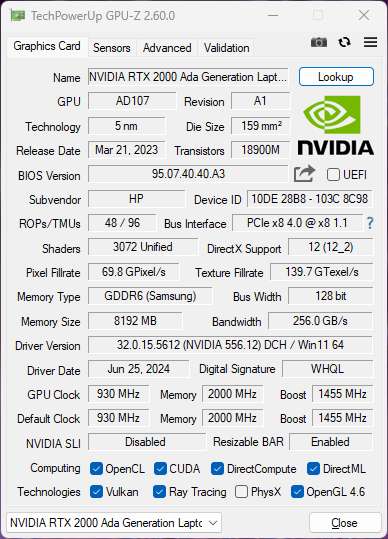
Возможности дискретной видеокарты остались такими же, как и в 15-дюймовом ZBook Power 15 G10, поскольку Nvidia пока не выпустила преемника мобильной серии Ada Lovelace. Кроме того, решение по охлаждению не было значительно улучшено при переходе на 16-дюймовый форм-фактор, поэтому ZBook Power 16 G11 по-прежнему ограничен тем же потолком 50 Вт TGP и RTX 1000 Ada, RTX 2000 Ada, и RTX 3000 Ada графические опции, как и раньше. Пользователям придется рассмотреть более толстую серию ZBook Fury 16 для более высоких возможностей RTX Ada.
Обновление до RTX 3000 Ada дает в лучшем случае незначительный прирост производительности, судя по нашему опыту с Dell Precision 5490.
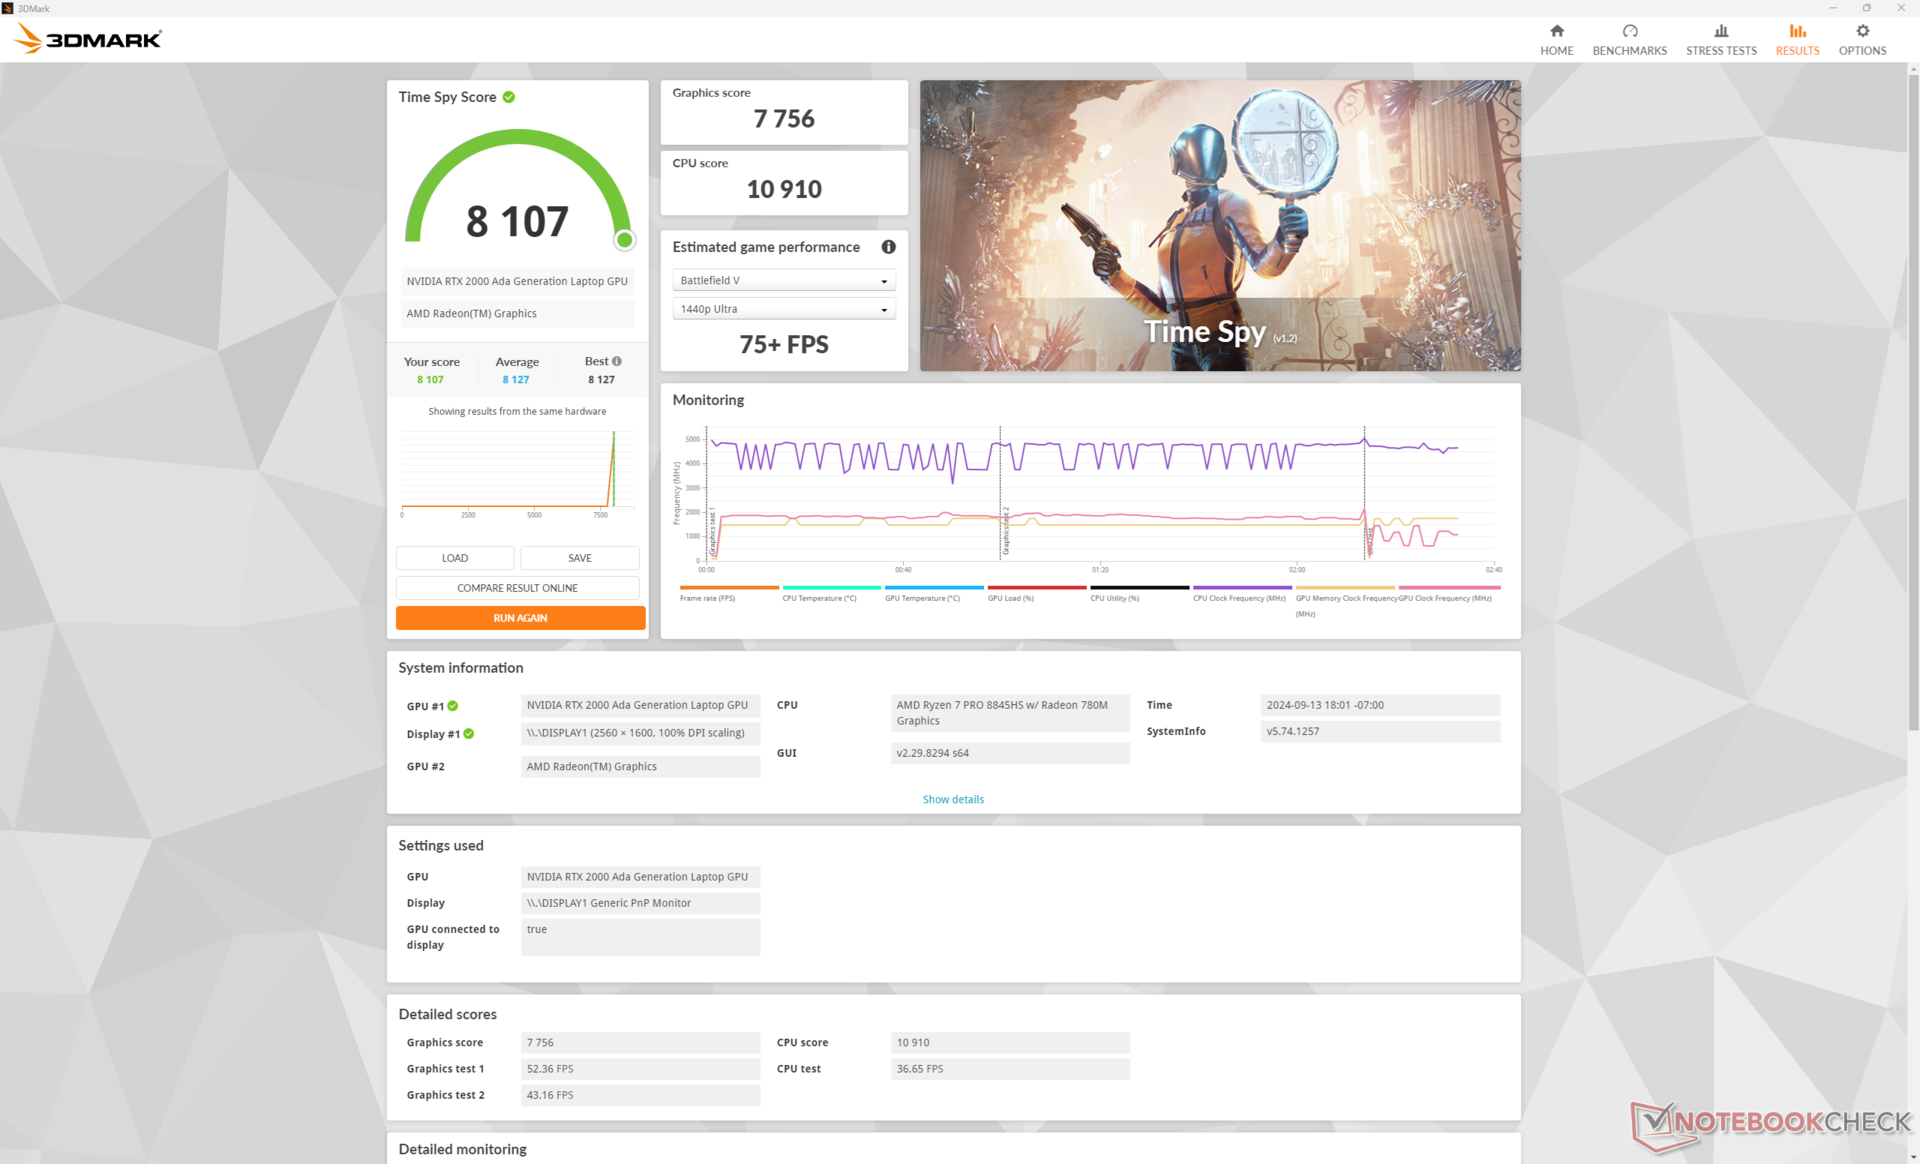
| Профиль мощности | Оценка графики | Оценка физики | Комбинированный балл |
| Режим производительности | 20719 | 27428 | 8045 |
| Сбалансированный режим | 19961 (-4%) | 26363 (-4%) | 7633 (-5%) |
| Питание от аккумулятора | 8108 (-61%) | 6149 (-78%) | 1727 (-79%) |
Работа в режиме "Сбалансированный" вместо режима "Производительность" незначительно влияет на производительность, как показано в нашей таблице результатов Fire Strike выше. Однако производительность CPU и GPU значительно снижается при работе от батарей.
| 3DMark Performance Rating - Percent | |
| Dell Precision 5690 -3! | |
| HP ZBook Fury 16 G11 | |
| HP ZBook Fury 16 G9 -3! | |
| HP ZBook Power 16 G11 A | |
| Усредн. модель с NVIDIA RTX 2000 Ada Generation Laptop GPU | |
| Dell Precision 5000 5490 -3! | |
| MSI CreatorPro Z16P B12UKST -19! | |
| HP ZBook Power 15 G10 -11! | |
| Asus ExpertBook B6 Flip B6602FC2 -19! | |
| Lenovo ThinkPad P16v G1 AMD -18! | |
| Lenovo ThinkPad P1 G4-20Y4Z9DVUS -19! | |
| Lenovo ThinkPad P16s G2 21K9000CGE -19! | |
| HP ZBook Firefly 16 G9-6B897EA -19! | |
| 3DMark 11 - 1280x720 Performance GPU | |
| Dell Precision 5690 | |
| HP ZBook Fury 16 G11 | |
| HP ZBook Fury 16 G9 | |
| Усредн. модель с NVIDIA RTX 2000 Ada Generation Laptop GPU (26968 - 33001, n=4) | |
| Dell Precision 5000 5490 | |
| HP ZBook Power 16 G11 A | |
| HP ZBook Power 15 G10 | |
| MSI CreatorPro Z16P B12UKST | |
| Asus ExpertBook B6 Flip B6602FC2 | |
| Lenovo ThinkPad P16v G1 AMD | |
| Lenovo ThinkPad P1 G4-20Y4Z9DVUS | |
| Lenovo ThinkPad P16s G2 21K9000CGE | |
| HP ZBook Firefly 16 G9-6B897EA | |
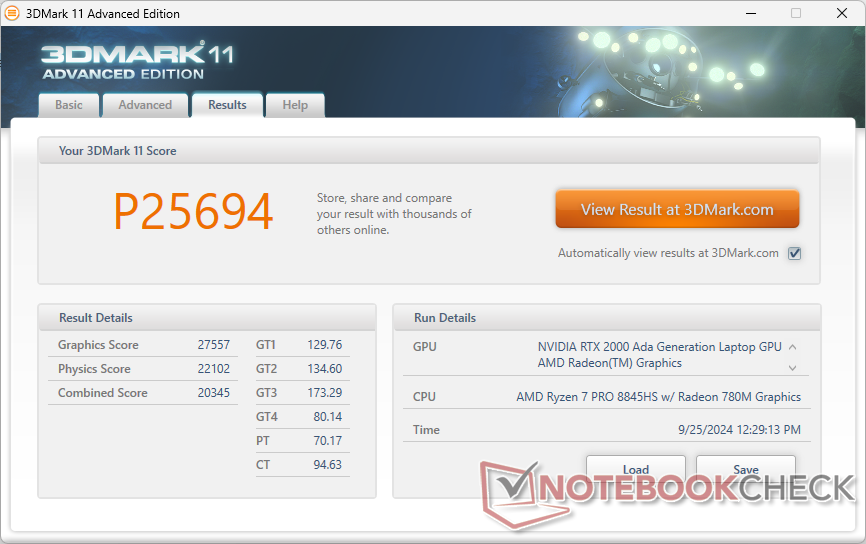
| 3DMark 11 Performance | 25694 баллов | |
| 3DMark Cloud Gate Standard Score | 51846 баллов | |
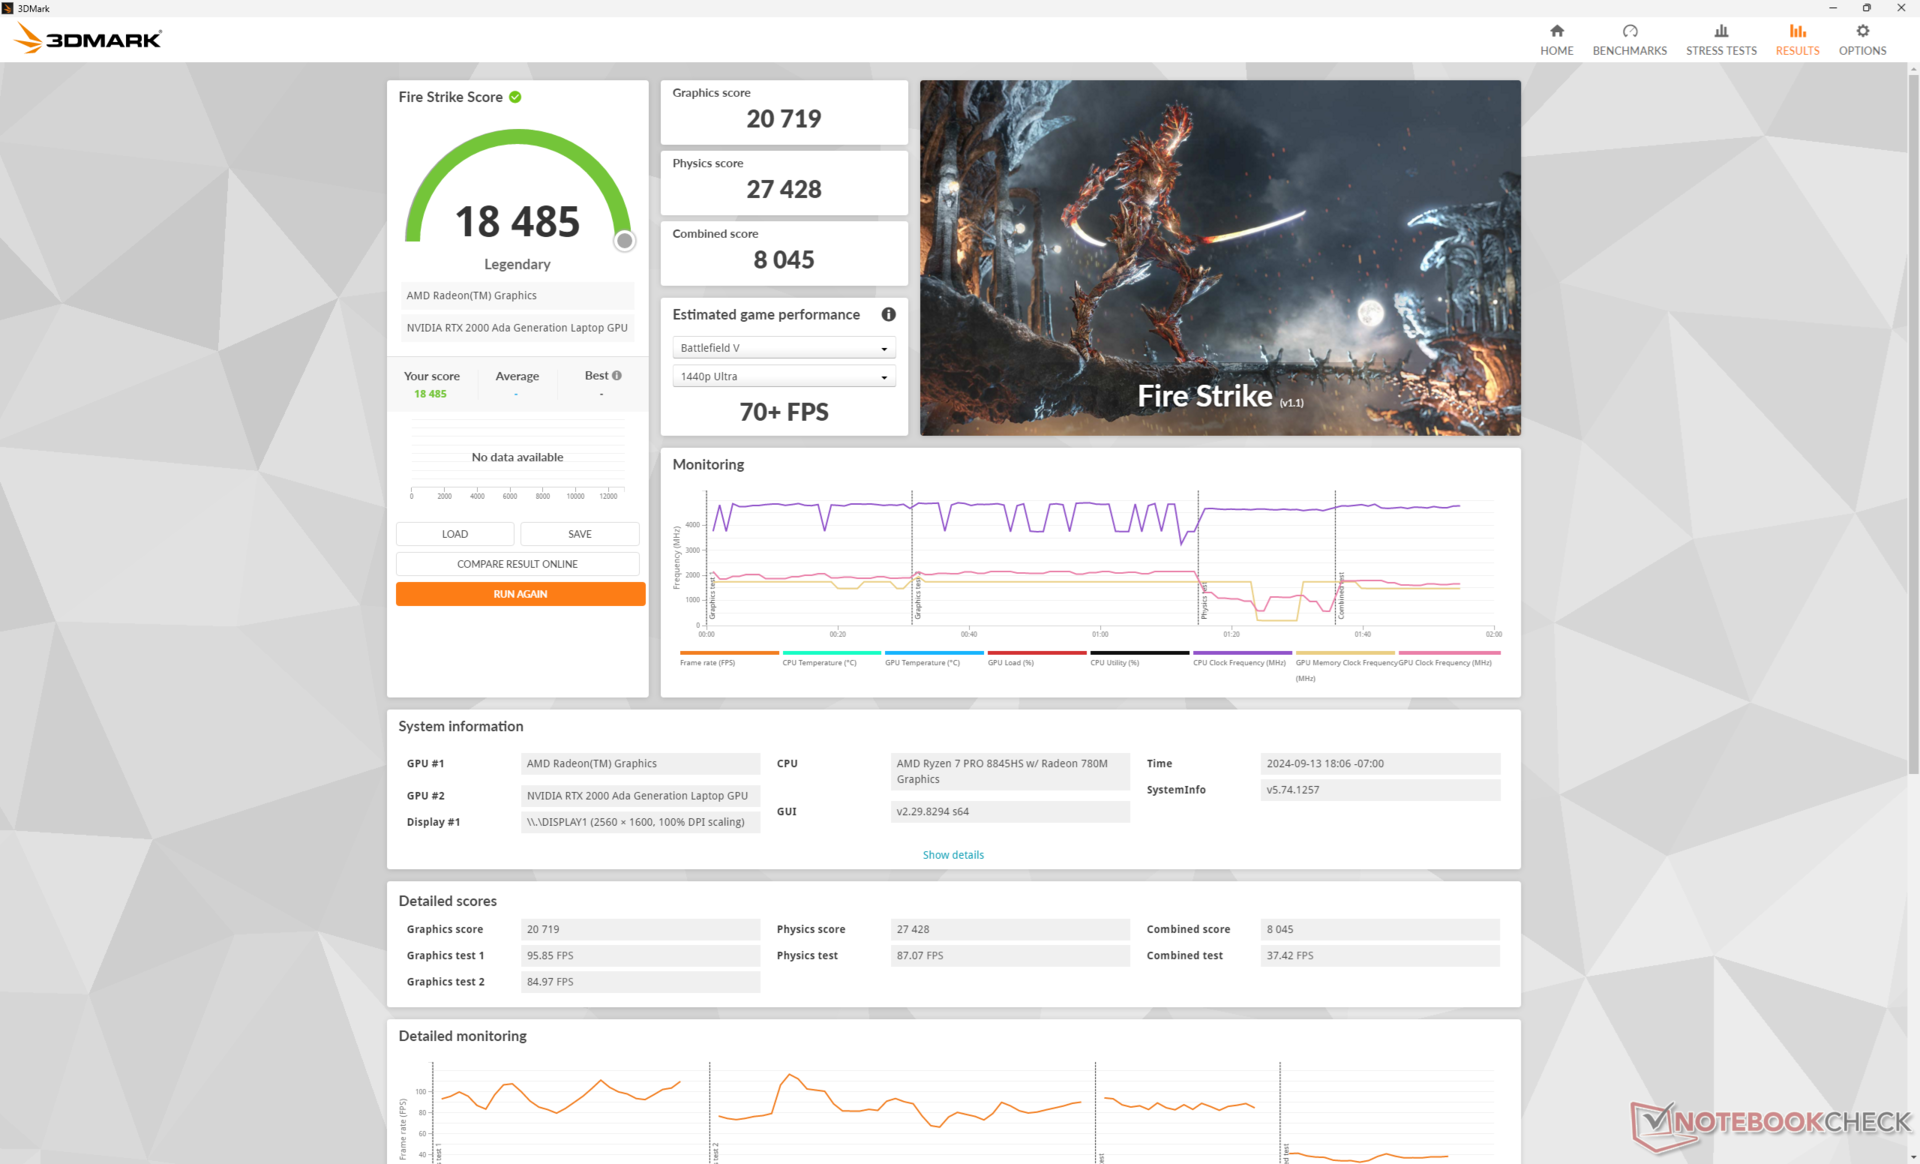
| 3DMark Fire Strike Score | 18485 баллов | |
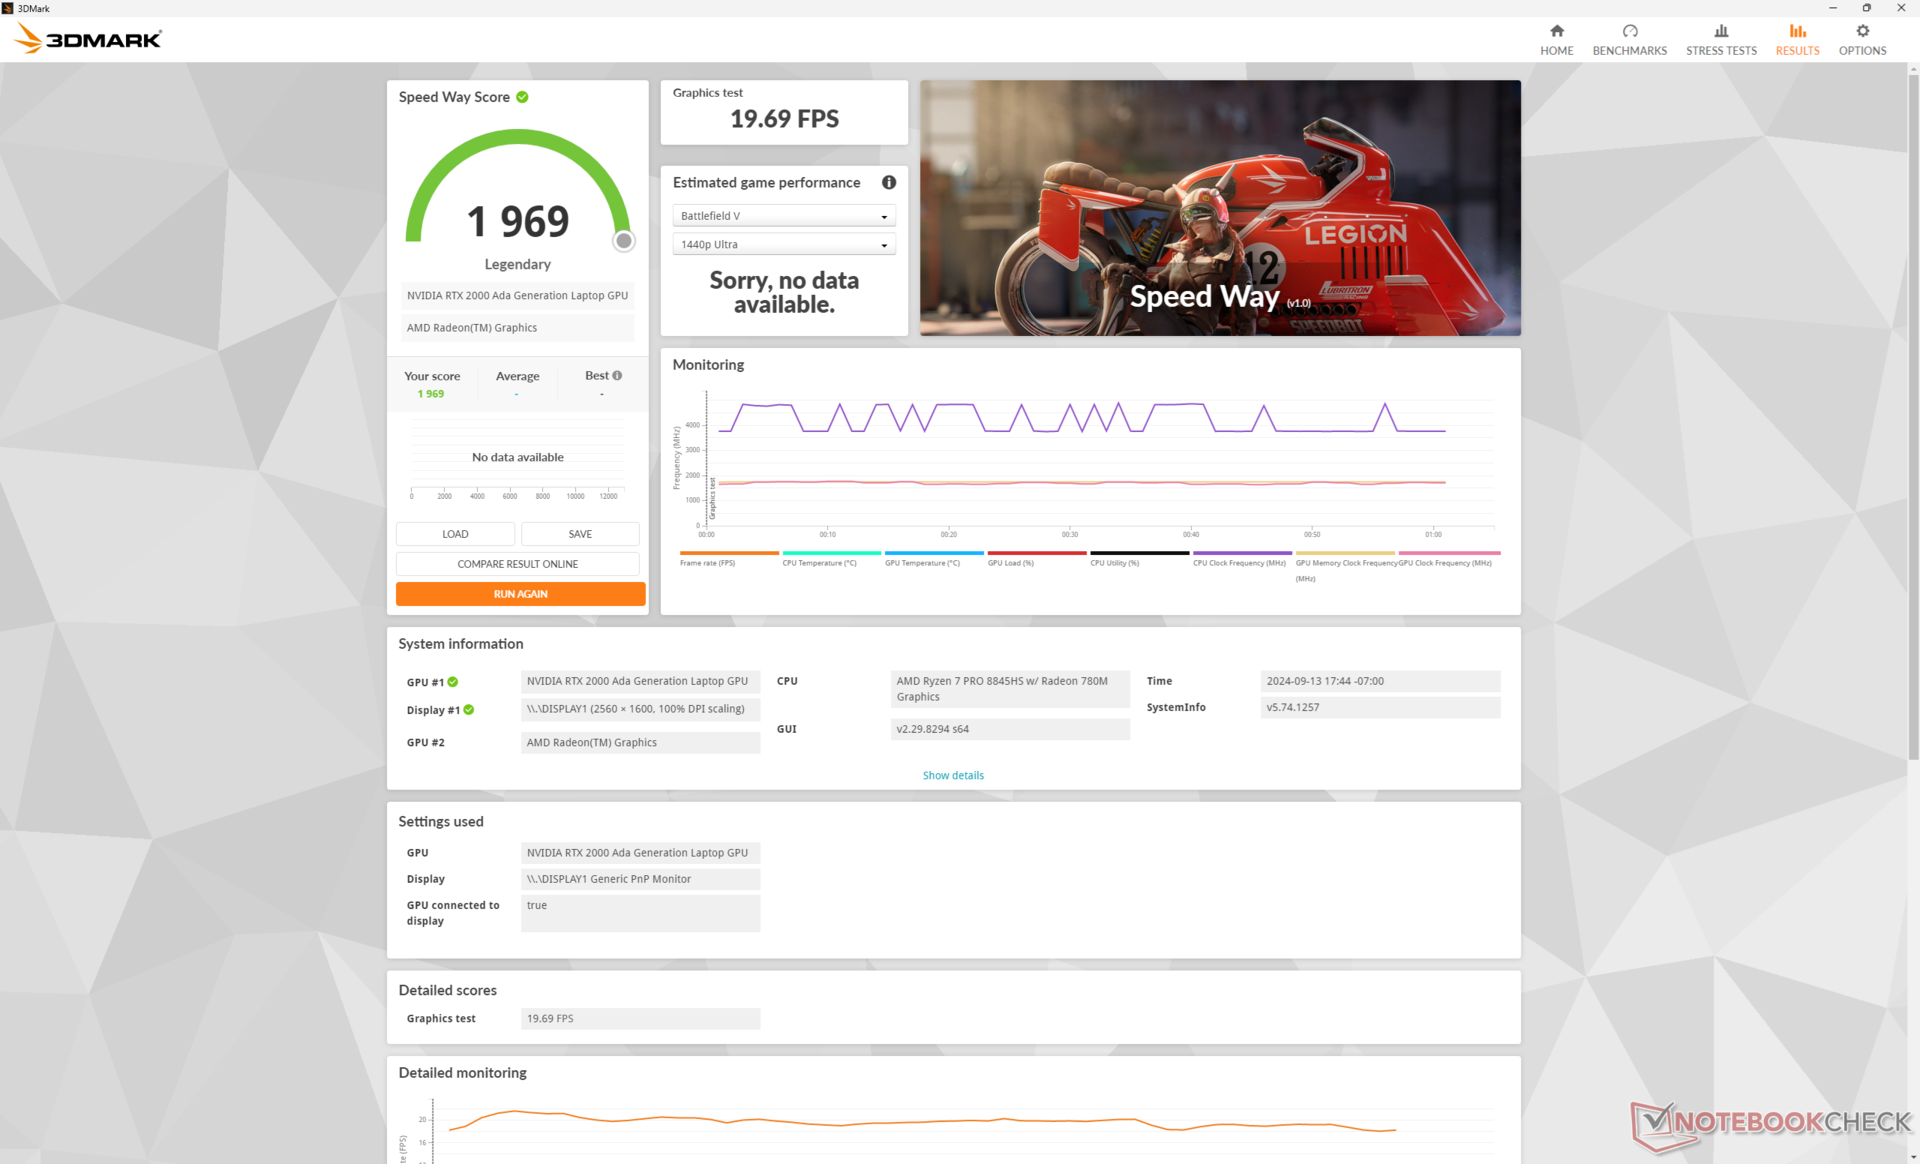
| 3DMark Time Spy Score | 8107 баллов | |
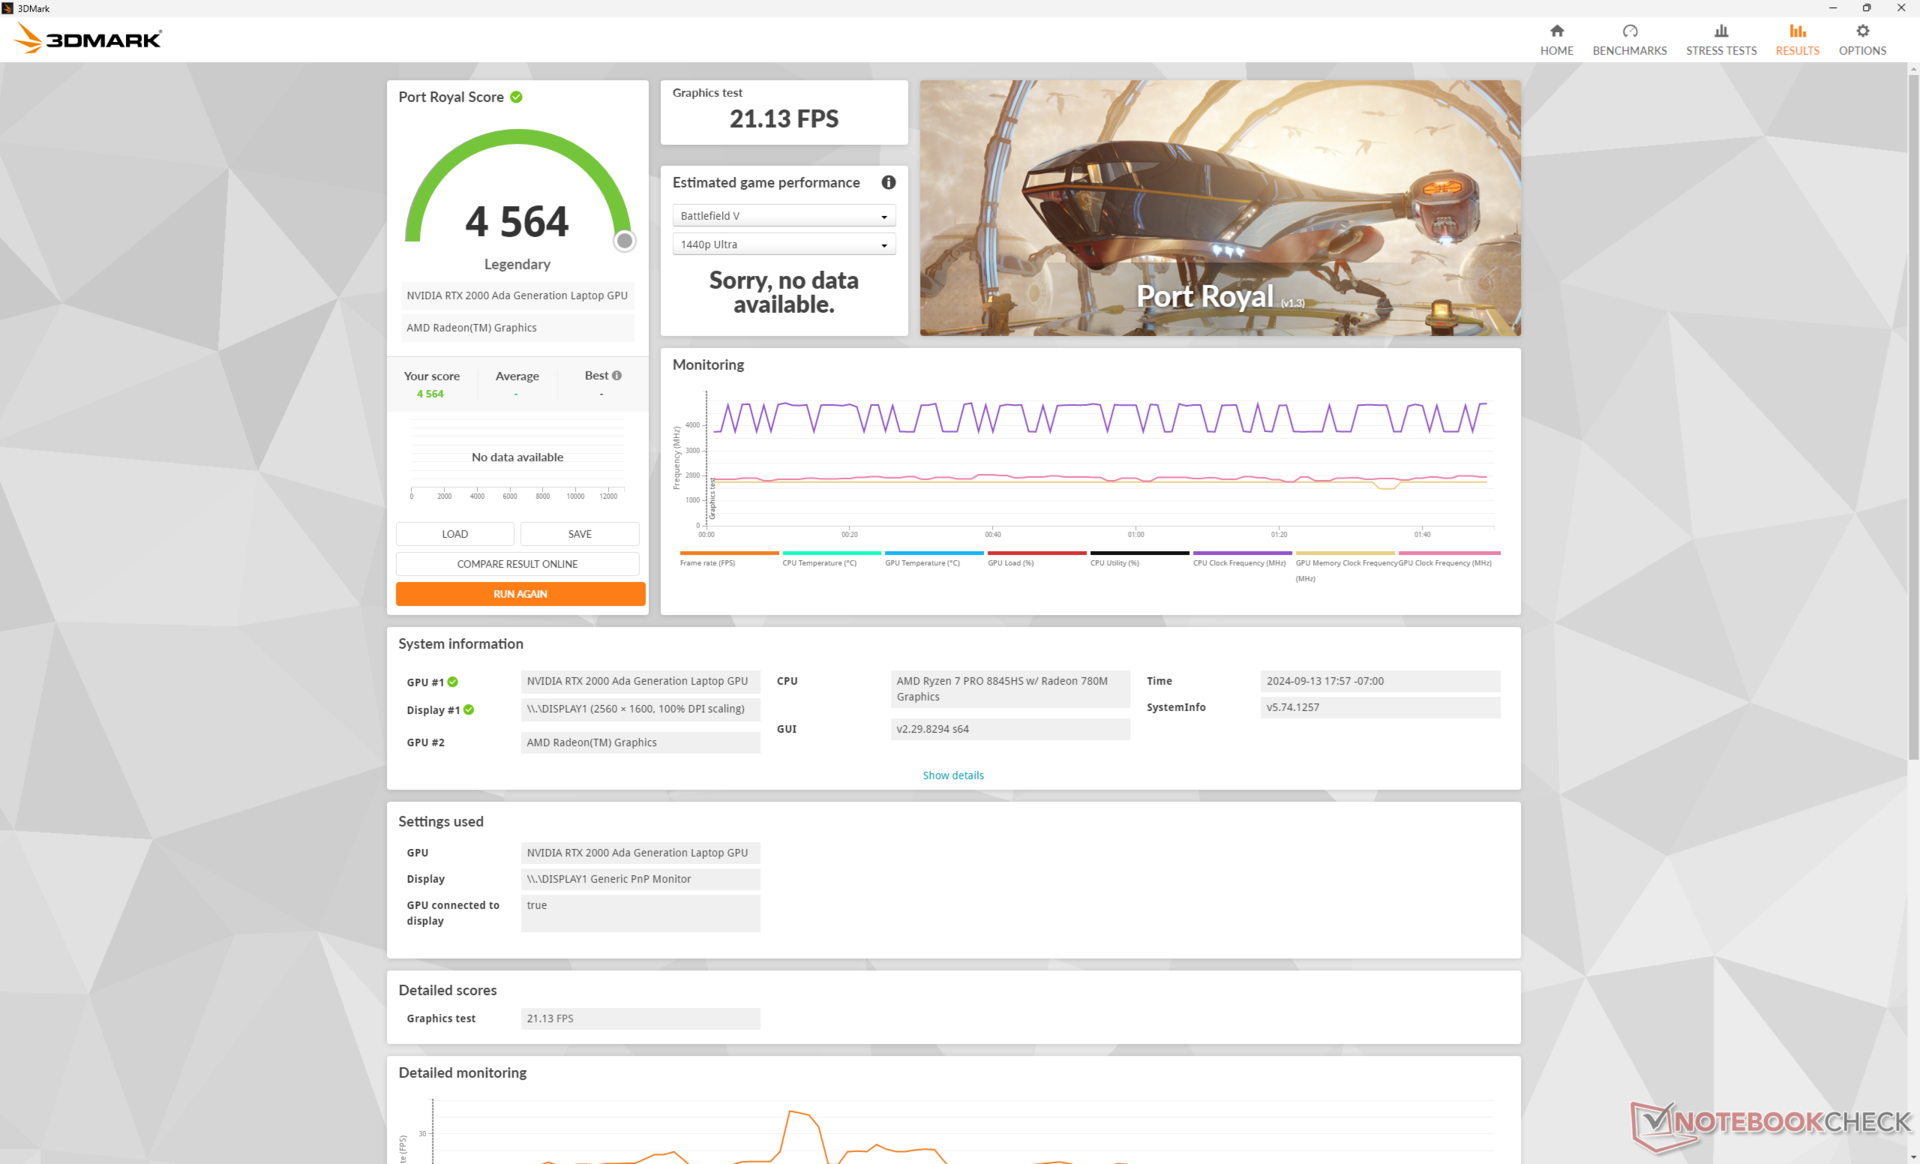
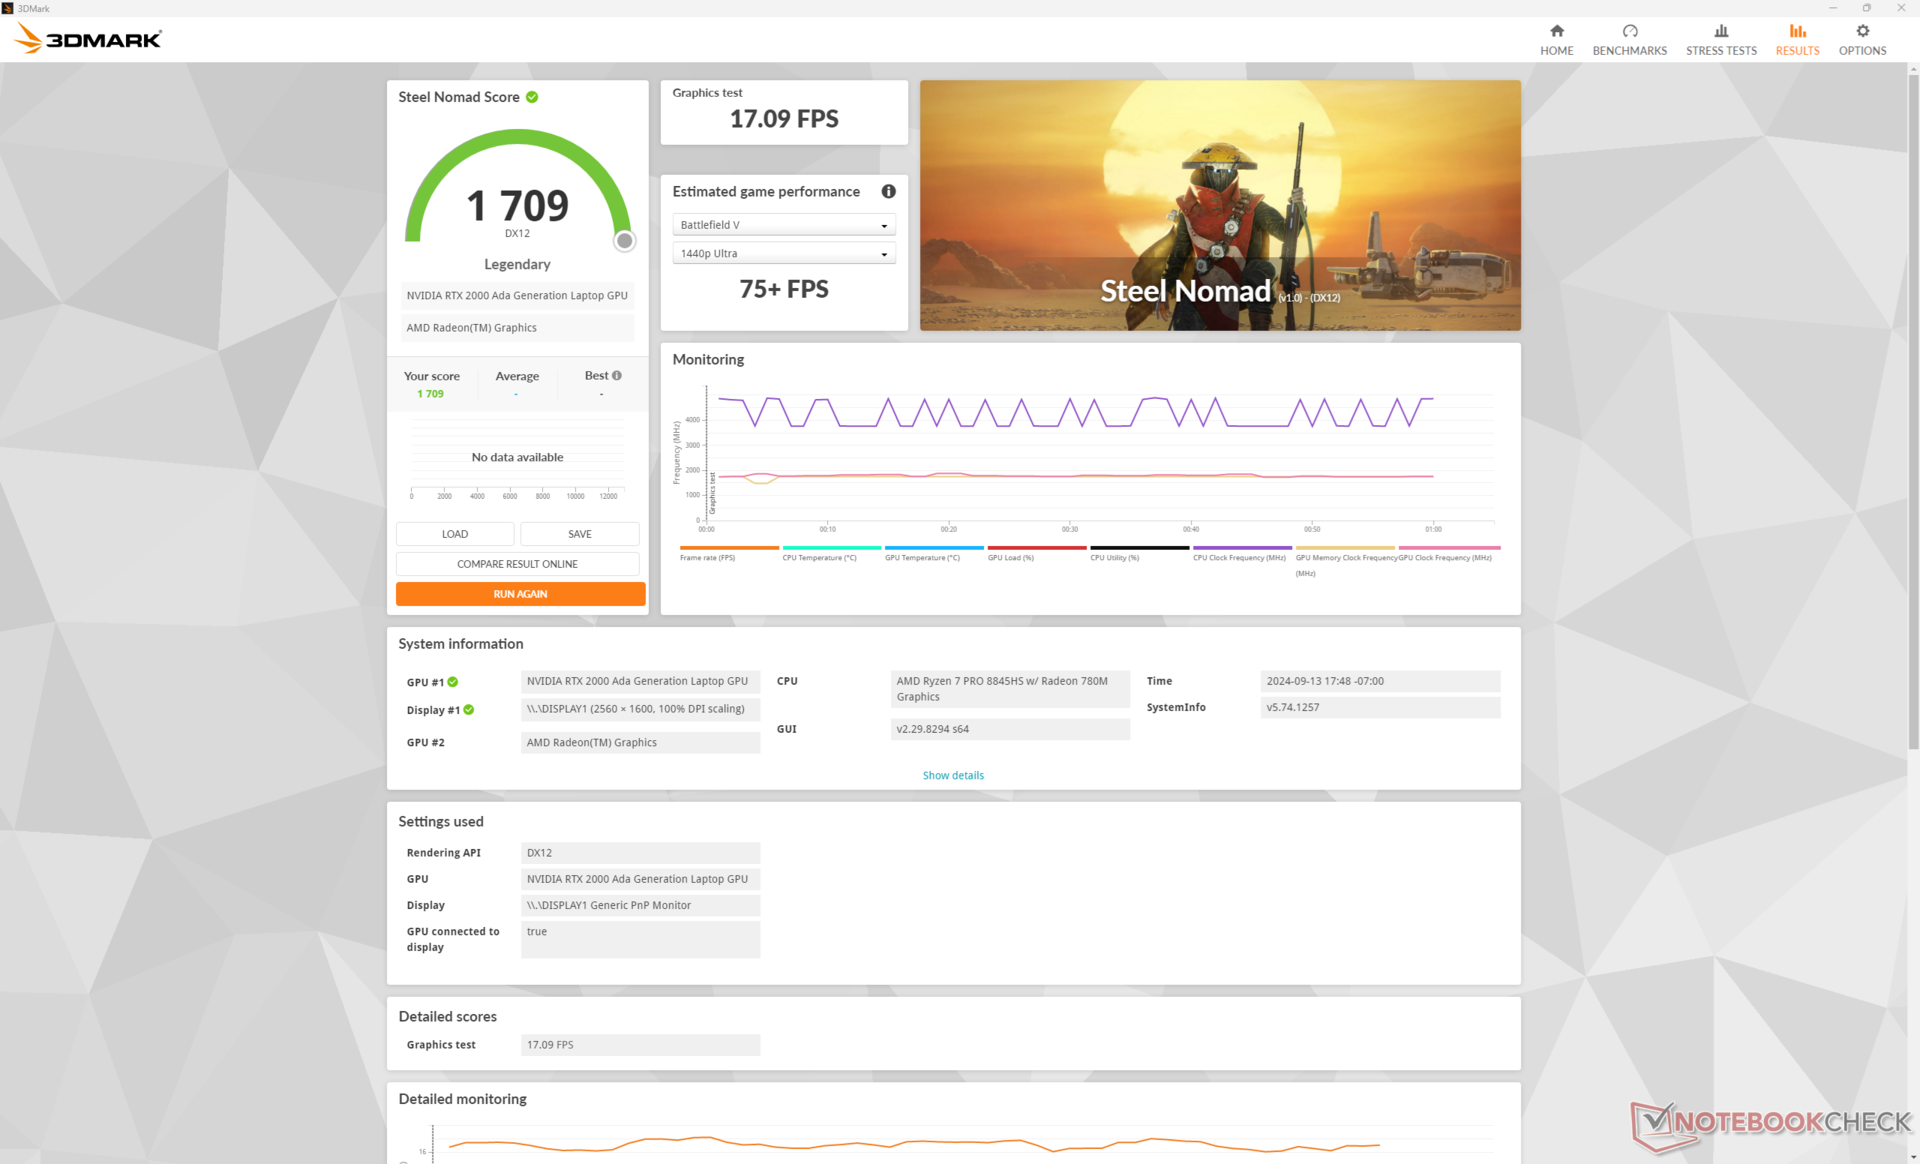
| 3DMark Steel Nomad Score | 1709 баллов | |
? | ||
| Blender | |
| v3.3 Classroom OPTIX/RTX | |
| HP ZBook Firefly 16 G9-6B897EA | |
| Lenovo ThinkPad P16v G1 AMD | |
| Asus ExpertBook B6 Flip B6602FC2 | |
| MSI CreatorPro Z16P B12UKST | |
| HP ZBook Power 16 G11 A | |
| Усредн. модель с NVIDIA RTX 2000 Ada Generation Laptop GPU (25 - 31, n=4) | |
| Dell Precision 5000 5490 | |
| HP ZBook Fury 16 G9 | |
| HP ZBook Fury 16 G11 | |
| Dell Precision 5690 | |
| v3.3 Classroom CUDA | |
| HP ZBook Firefly 16 G9-6B897EA | |
| Lenovo ThinkPad P16v G1 AMD | |
| Asus ExpertBook B6 Flip B6602FC2 | |
| Усредн. модель с NVIDIA RTX 2000 Ada Generation Laptop GPU (51 - 155, n=4) | |
| MSI CreatorPro Z16P B12UKST | |
| HP ZBook Power 16 G11 A | |
| Dell Precision 5000 5490 | |
| HP ZBook Fury 16 G9 | |
| HP ZBook Fury 16 G11 | |
| Dell Precision 5690 | |
| v3.3 Classroom CPU | |
| HP ZBook Firefly 16 G9-6B897EA | |
| Dell Precision 5690 | |
| Lenovo ThinkPad P16s G2 21K9000CGE | |
| Dell Precision 5000 5490 | |
| HP ZBook Power 16 G11 A | |
| MSI CreatorPro Z16P B12UKST | |
| Lenovo ThinkPad P16v G1 AMD | |
| Asus ExpertBook B6 Flip B6602FC2 | |
| Усредн. модель с NVIDIA RTX 2000 Ada Generation Laptop GPU (291 - 347, n=4) | |
| HP ZBook Fury 16 G9 | |
| HP ZBook Fury 16 G11 | |
* ... меньше = лучше
Игры
Хотя RTX 2000 Ada не оптимизирована для игр, она больше всего похожа на ноутбуки, работающие на GeForce RTX 3060 или RTX 4060.
| Performance Rating - Percent | |
| HP ZBook Fury 16 G11 | |
| Dell Precision 5690 -1! | |
| HP ZBook Fury 16 G9 -1! | |
| MSI CreatorPro Z16P B12UKST | |
| Asus ExpertBook B6 Flip B6602FC2 | |
| Dell Precision 5000 5490 -1! | |
| HP ZBook Power 16 G11 A | |
| HP ZBook Power 15 G10 | |
| Lenovo ThinkPad P1 G4-20Y4Z9DVUS -3! | |
| Lenovo ThinkPad P16v G1 AMD | |
| HP ZBook Firefly 16 G9-6B897EA | |
| Lenovo ThinkPad P16s G2 21K9000CGE | |
| GTA V - 1920x1080 Highest Settings possible AA:4xMSAA + FX AF:16x | |
| HP ZBook Fury 16 G9 | |
| HP ZBook Fury 16 G11 | |
| MSI CreatorPro Z16P B12UKST | |
| HP ZBook Power 16 G11 A | |
| HP ZBook Power 15 G10 | |
| Asus ExpertBook B6 Flip B6602FC2 | |
| Lenovo ThinkPad P16v G1 AMD | |
| HP ZBook Firefly 16 G9-6B897EA | |
| Lenovo ThinkPad P16s G2 21K9000CGE | |
| Final Fantasy XV Benchmark - 1920x1080 High Quality | |
| Dell Precision 5690 | |
| HP ZBook Fury 16 G11 | |
| HP ZBook Fury 16 G9 | |
| Dell Precision 5000 5490 | |
| HP ZBook Power 15 G10 | |
| HP ZBook Power 16 G11 A | |
| MSI CreatorPro Z16P B12UKST | |
| Asus ExpertBook B6 Flip B6602FC2 | |
| Lenovo ThinkPad P16v G1 AMD | |
| Lenovo ThinkPad P1 G4-20Y4Z9DVUS | |
| Lenovo ThinkPad P16s G2 21K9000CGE | |
| HP ZBook Firefly 16 G9-6B897EA | |
| Strange Brigade - 1920x1080 ultra AA:ultra AF:16 | |
| Dell Precision 5690 | |
| HP ZBook Fury 16 G11 | |
| HP ZBook Fury 16 G9 | |
| HP ZBook Power 16 G11 A | |
| HP ZBook Power 15 G10 | |
| Dell Precision 5000 5490 | |
| Asus ExpertBook B6 Flip B6602FC2 | |
| MSI CreatorPro Z16P B12UKST | |
| Lenovo ThinkPad P16v G1 AMD | |
| Lenovo ThinkPad P16s G2 21K9000CGE | |
| HP ZBook Firefly 16 G9-6B897EA | |
| Dota 2 Reborn - 1920x1080 ultra (3/3) best looking | |
| HP ZBook Fury 16 G11 | |
| HP ZBook Fury 16 G9 | |
| MSI CreatorPro Z16P B12UKST | |
| Asus ExpertBook B6 Flip B6602FC2 | |
| Dell Precision 5690 | |
| HP ZBook Power 15 G10 | |
| Dell Precision 5000 5490 | |
| HP ZBook Power 16 G11 A | |
| Lenovo ThinkPad P16v G1 AMD | |
| Lenovo ThinkPad P1 G4-20Y4Z9DVUS | |
| HP ZBook Firefly 16 G9-6B897EA | |
| Lenovo ThinkPad P16s G2 21K9000CGE | |
| X-Plane 11.11 - 1920x1080 high (fps_test=3) | |
| HP ZBook Fury 16 G11 | |
| Asus ExpertBook B6 Flip B6602FC2 | |
| HP ZBook Fury 16 G9 | |
| MSI CreatorPro Z16P B12UKST | |
| Dell Precision 5690 | |
| Dell Precision 5000 5490 | |
| Lenovo ThinkPad P1 G4-20Y4Z9DVUS | |
| Lenovo ThinkPad P16v G1 AMD | |
| HP ZBook Power 16 G11 A | |
| HP ZBook Firefly 16 G9-6B897EA | |
| HP ZBook Power 15 G10 | |
| Lenovo ThinkPad P16s G2 21K9000CGE | |
| Lenovo ThinkPad P16s G2 21K9000CGE | |
| Far Cry 5 - 1920x1080 Ultra Preset AA:T | |
| HP ZBook Fury 16 G11 | |
| Dell Precision 5690 | |
| MSI CreatorPro Z16P B12UKST | |
| HP ZBook Power 16 G11 A | |
| Asus ExpertBook B6 Flip B6602FC2 | |
| Dell Precision 5000 5490 | |
| HP ZBook Power 15 G10 | |
| Lenovo ThinkPad P16v G1 AMD | |
| Lenovo ThinkPad P16s G2 21K9000CGE | |
| HP ZBook Firefly 16 G9-6B897EA | |
| GTA V | |
| 1366x768 Normal/Off AF:4x | |
| HP ZBook Fury 16 G9 | |
| MSI CreatorPro Z16P B12UKST | |
| HP ZBook Fury 16 G11 | |
| Усредн. модель с NVIDIA RTX 2000 Ada Generation Laptop GPU (170.6 - 181.3, n=3) | |
| HP ZBook Power 15 G10 | |
| Lenovo ThinkPad P16v G1 AMD | |
| Lenovo ThinkPad P16s G2 21K9000CGE | |
| HP ZBook Firefly 16 G9-6B897EA | |
| 1920x1080 Normal/Off AF:4x | |
| HP ZBook Fury 16 G11 | |
| HP ZBook Fury 16 G9 | |
| HP ZBook Power 16 G11 A | |
| Усредн. модель с NVIDIA RTX 2000 Ada Generation Laptop GPU (171.6 - 180.7, n=4) | |
| HP ZBook Power 15 G10 | |
| Lenovo ThinkPad P16s G2 21K9000CGE | |
| 1920x1080 High/On (Advanced Graphics Off) AA:2xMSAA + FX AF:8x | |
| HP ZBook Fury 16 G9 | |
| HP ZBook Fury 16 G11 | |
| MSI CreatorPro Z16P B12UKST | |
| Усредн. модель с NVIDIA RTX 2000 Ada Generation Laptop GPU (157.7 - 173, n=5) | |
| Asus ExpertBook B6 Flip B6602FC2 | |
| HP ZBook Power 16 G11 A | |
| HP ZBook Power 15 G10 | |
| Lenovo ThinkPad P16v G1 AMD | |
| Lenovo ThinkPad P16s G2 21K9000CGE | |
| HP ZBook Firefly 16 G9-6B897EA | |
| 1920x1080 Highest Settings possible AA:4xMSAA + FX AF:16x | |
| HP ZBook Fury 16 G9 | |
| HP ZBook Fury 16 G11 | |
| MSI CreatorPro Z16P B12UKST | |
| Усредн. модель с NVIDIA RTX 2000 Ada Generation Laptop GPU (86.2 - 101.6, n=4) | |
| HP ZBook Power 16 G11 A | |
| HP ZBook Power 15 G10 | |
| Asus ExpertBook B6 Flip B6602FC2 | |
| Lenovo ThinkPad P16v G1 AMD | |
| HP ZBook Firefly 16 G9-6B897EA | |
| Lenovo ThinkPad P16s G2 21K9000CGE | |
| 2560x1440 Highest Settings possible AA:4xMSAA + FX AF:16x | |
| HP ZBook Fury 16 G11 | |
| HP ZBook Fury 16 G11 | |
| HP ZBook Fury 16 G9 | |
| MSI CreatorPro Z16P B12UKST | |
| Усредн. модель с NVIDIA RTX 2000 Ada Generation Laptop GPU (60.6 - 76.8, n=5) | |
| HP ZBook Power 16 G11 A | |
| HP ZBook Power 15 G10 | |
| Lenovo ThinkPad P16s G2 21K9000CGE | |
| X-Plane 11.11 | |
| 1920x1080 med (fps_test=2) | |
| HP ZBook Fury 16 G11 | |
| Asus ExpertBook B6 Flip B6602FC2 | |
| HP ZBook Fury 16 G9 | |
| MSI CreatorPro Z16P B12UKST | |
| Dell Precision 5690 | |
| Усредн. модель с NVIDIA RTX 2000 Ada Generation Laptop GPU (72.1 - 133.5, n=4) | |
| Dell Precision 5000 5490 | |
| Lenovo ThinkPad P1 G4-20Y4Z9DVUS | |
| Lenovo ThinkPad P16v G1 AMD | |
| HP ZBook Power 15 G10 | |
| HP ZBook Power 16 G11 A | |
| HP ZBook Firefly 16 G9-6B897EA | |
| Lenovo ThinkPad P16s G2 21K9000CGE | |
| Lenovo ThinkPad P16s G2 21K9000CGE | |
| 1920x1080 high (fps_test=3) | |
| HP ZBook Fury 16 G11 | |
| Asus ExpertBook B6 Flip B6602FC2 | |
| HP ZBook Fury 16 G9 | |
| MSI CreatorPro Z16P B12UKST | |
| Dell Precision 5690 | |
| Усредн. модель с NVIDIA RTX 2000 Ada Generation Laptop GPU (52.5 - 108.9, n=4) | |
| Dell Precision 5000 5490 | |
| Lenovo ThinkPad P1 G4-20Y4Z9DVUS | |
| Lenovo ThinkPad P16v G1 AMD | |
| HP ZBook Power 16 G11 A | |
| HP ZBook Firefly 16 G9-6B897EA | |
| HP ZBook Power 15 G10 | |
| Lenovo ThinkPad P16s G2 21K9000CGE | |
| Lenovo ThinkPad P16s G2 21K9000CGE | |
| Far Cry 5 | |
| 1920x1080 High Preset AA:T | |
| HP ZBook Fury 16 G11 | |
| Dell Precision 5690 | |
| MSI CreatorPro Z16P B12UKST | |
| Усредн. модель с NVIDIA RTX 2000 Ada Generation Laptop GPU (102 - 120, n=3) | |
| Dell Precision 5000 5490 | |
| HP ZBook Power 16 G11 A | |
| Asus ExpertBook B6 Flip B6602FC2 | |
| HP ZBook Power 15 G10 | |
| Lenovo ThinkPad P16v G1 AMD | |
| Lenovo ThinkPad P16s G2 21K9000CGE | |
| HP ZBook Firefly 16 G9-6B897EA | |
| 1920x1080 Ultra Preset AA:T | |
| HP ZBook Fury 16 G11 | |
| Dell Precision 5690 | |
| MSI CreatorPro Z16P B12UKST | |
| Усредн. модель с NVIDIA RTX 2000 Ada Generation Laptop GPU (95 - 113, n=3) | |
| HP ZBook Power 16 G11 A | |
| Asus ExpertBook B6 Flip B6602FC2 | |
| Dell Precision 5000 5490 | |
| HP ZBook Power 15 G10 | |
| Lenovo ThinkPad P16v G1 AMD | |
| Lenovo ThinkPad P16s G2 21K9000CGE | |
| HP ZBook Firefly 16 G9-6B897EA | |
| 2560x1440 Ultra Preset AA:T | |
| Dell Precision 5690 | |
| HP ZBook Fury 16 G11 | |
| MSI CreatorPro Z16P B12UKST | |
| Усредн. модель с NVIDIA RTX 2000 Ada Generation Laptop GPU (63 - 81, n=3) | |
| HP ZBook Power 16 G11 A | |
| HP ZBook Power 15 G10 | |
| Lenovo ThinkPad P16s G2 21K9000CGE | |
| Cyberpunk 2077 2.2 Phantom Liberty | |
| 1920x1080 Medium Preset (FSR off) | |
| Dell Precision 5690 | |
| HP ZBook Fury 16 G11 | |
| Dell Precision 5000 5490 | |
| HP ZBook Power 15 G10 | |
| Усредн. модель с NVIDIA RTX 2000 Ada Generation Laptop GPU (61.4 - 64.5, n=2) | |
| HP ZBook Power 16 G11 A | |
| Lenovo ThinkPad P16v G1 AMD | |
| 1920x1080 High Preset (FSR off) | |
| HP ZBook Fury 16 G11 | |
| Dell Precision 5690 | |
| Dell Precision 5000 5490 | |
| HP ZBook Power 15 G10 | |
| Усредн. модель с NVIDIA RTX 2000 Ada Generation Laptop GPU (51.7 - 55.2, n=2) | |
| HP ZBook Power 16 G11 A | |
| Lenovo ThinkPad P16v G1 AMD | |
| 1920x1080 Ultra Preset (FSR off) | |
| Dell Precision 5690 | |
| HP ZBook Fury 16 G11 | |
| Dell Precision 5000 5490 | |
| HP ZBook Power 15 G10 | |
| Усредн. модель с NVIDIA RTX 2000 Ada Generation Laptop GPU (44.8 - 48.3, n=2) | |
| HP ZBook Power 16 G11 A | |
| Lenovo ThinkPad P16v G1 AMD | |
| 2560x1440 Ultra Preset (FSR off) | |
| Dell Precision 5690 | |
| HP ZBook Fury 16 G11 | |
| HP ZBook Power 15 G10 | |
| Усредн. модель с NVIDIA RTX 2000 Ada Generation Laptop GPU (29.7 - 29.9, n=2) | |
| HP ZBook Power 16 G11 A | |
Частота кадров, Cyberpunk 2077
| мин. | сред. | выс. | макс. | QHD | |
|---|---|---|---|---|---|
| GTA V (2015) | 180.6 | 162.7 | 90.3 | 63.4 | |
| Dota 2 Reborn (2015) | 145.2 | 142 | 126.1 | 119.9 | |
| Final Fantasy XV Benchmark (2018) | 166.1 | 89.3 | 66.3 | 49.4 | |
| X-Plane 11.11 (2018) | 83.2 | 72.1 | 60.6 | ||
| Far Cry 5 (2018) | 138 | 111 | 104 | 98 | 67 |
| Strange Brigade (2018) | 329 | 187.8 | 158.1 | 138.5 | 99.5 |
| Tiny Tina's Wonderlands (2022) | 139.1 | 115.1 | 80 | 64.4 | 46.3 |
| F1 22 (2022) | 186.6 | 171.1 | 129.1 | 46.2 | 29.8 |
| Baldur's Gate 3 (2023) | 87.1 | 75.7 | 67.6 | 66.1 | 45.6 |
| Cyberpunk 2077 2.2 Phantom Liberty (2023) | 81.1 | 61.4 | 51.7 | 44.8 | 29.7 |
Температурные и акустические показатели
Система охлаждения
Уровень шума вентилятора и его поведение аналогичны тому, что мы наблюдали у прошлогодней модели. Система остается тихой - всего 25,4 дБ(А) даже после запуска первой сцены бенчмарка 3DMark 06, что гораздо тише, чем у конкурирующих моделей, таких как ThinkPad P16s G2 или Precision 5690 в аналогичных условиях.
Имейте в виду, что шум вентилятора заметно тише в сбалансированном режиме; при запуске Cyberpunk 2077 в режиме Performance шум может достигать 43 дБ(А), в то время как в сбалансированном режиме он составляет всего 37,5 дБ(А).
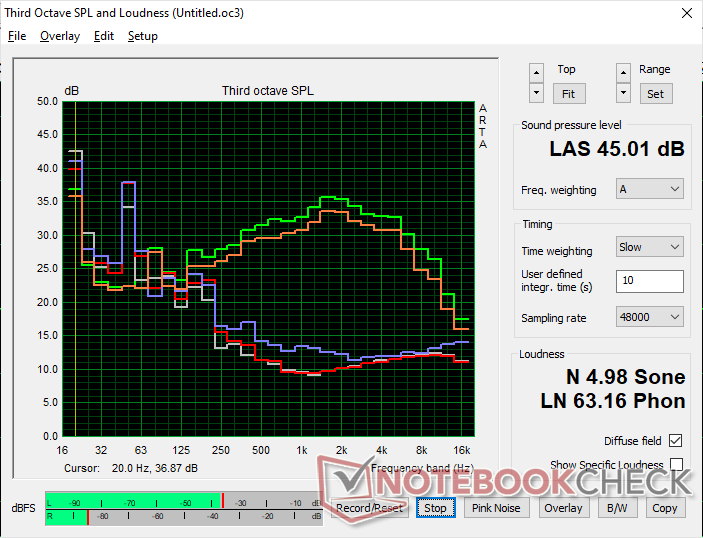
Уровень шума
| Ожидание |
| 23.8 / 24.2 / 24.2 дБ |
| Нагрузка |
| 25.4 / 45 дБ |
 | ||
30 dB бесшумно 40 dB(A) различимо 50 dB(A) громко |
||
min: | ||
| HP ZBook Power 16 G11 A NVIDIA RTX 2000 Ada Generation Laptop GPU, R7 8845HS, Samsung PM9A1 MZVL22T0HBLB | HP ZBook Power 15 G10 NVIDIA RTX 2000 Ada Generation Laptop GPU, R7 PRO 7840HS, WDC PC SN810 2TB | HP ZBook Fury 16 G11 NVIDIA RTX 3500 Ada Generation Laptop GPU, i9-14900HX, SK hynix PC801 HFS001TEJ9X101N | Lenovo ThinkPad P1 Gen 7 21KV001SGE NVIDIA GeForce RTX 4060 Laptop GPU, Ultra 7 155H, Kioxia XG8 KXG8AZNV1T02 | Lenovo ThinkPad P16s G2 21K9000CGE Radeon 780M, R7 PRO 7840U, SK hynix PC801 HFS001TEJ9X162N | Dell Precision 5690 NVIDIA RTX 5000 Ada Generation Laptop GPU, Ultra 9 185H, 2x Samsung PM9A1 1TB (RAID 0) | |
|---|---|---|---|---|---|---|
| Уровень шума | -3% | -15% | -18% | -3% | -17% | |
| в выкл. виде (фон) * | 23.5 | 24.2 -3% | 23.2 1% | 24.7 -5% | 22.6 4% | 23.4 -0% |
| Мин. в простое * | 23.8 | 24.4 -3% | 23.2 3% | 24.7 -4% | 22.6 5% | 23.6 1% |
| В простое, сред. * | 24.2 | 24.4 -1% | 23.2 4% | 24.7 -2% | 22.6 7% | 24.9 -3% |
| В простое, макс. * | 24.2 | 24.4 -1% | 29.5 -22% | 24.7 -2% | 22.6 7% | 30.9 -28% |
| Нагрузка, сред. * | 25.4 | 27.4 -8% | 43 -69% | 43.7 -72% | 37.8 -49% | 40.4 -59% |
| Cyberpunk 2077 ultra * | 43 | 48.2 -12% | 53.2 -24% | |||
| Нагрузка, макс. * | 45 | 46.8 -4% | 48.2 -7% | 53.3 -18% | 40.5 10% | 51.9 -15% |
| Witcher 3 ultra * | 43.3 | 40.3 | 48.3 |
* ... меньше = лучше
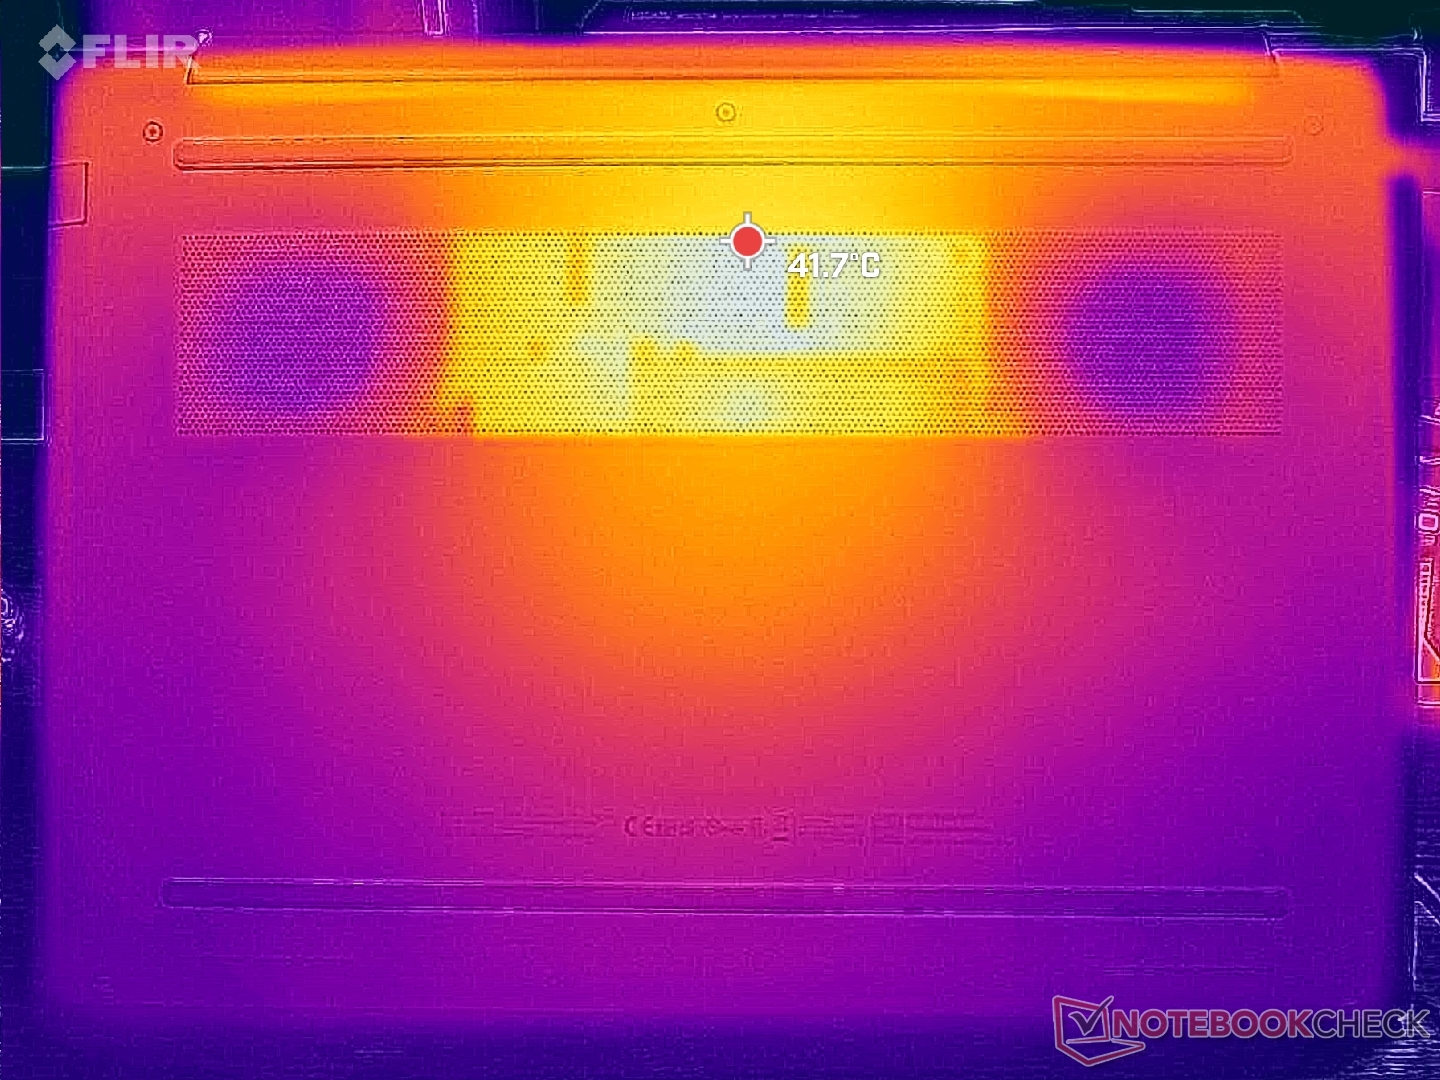
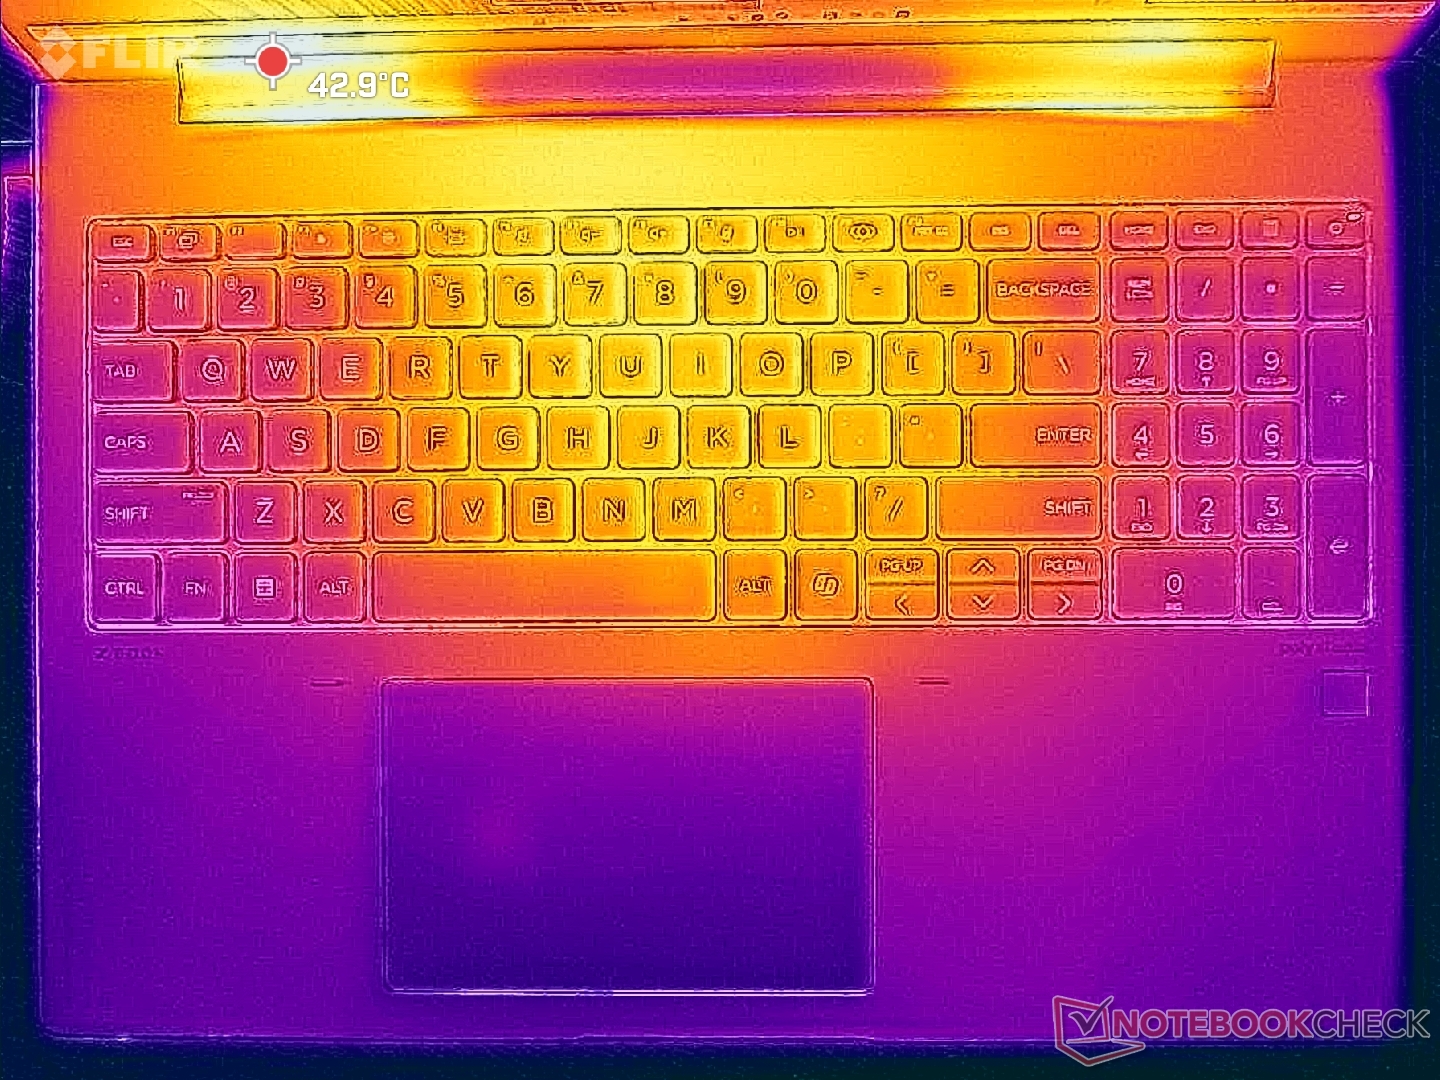
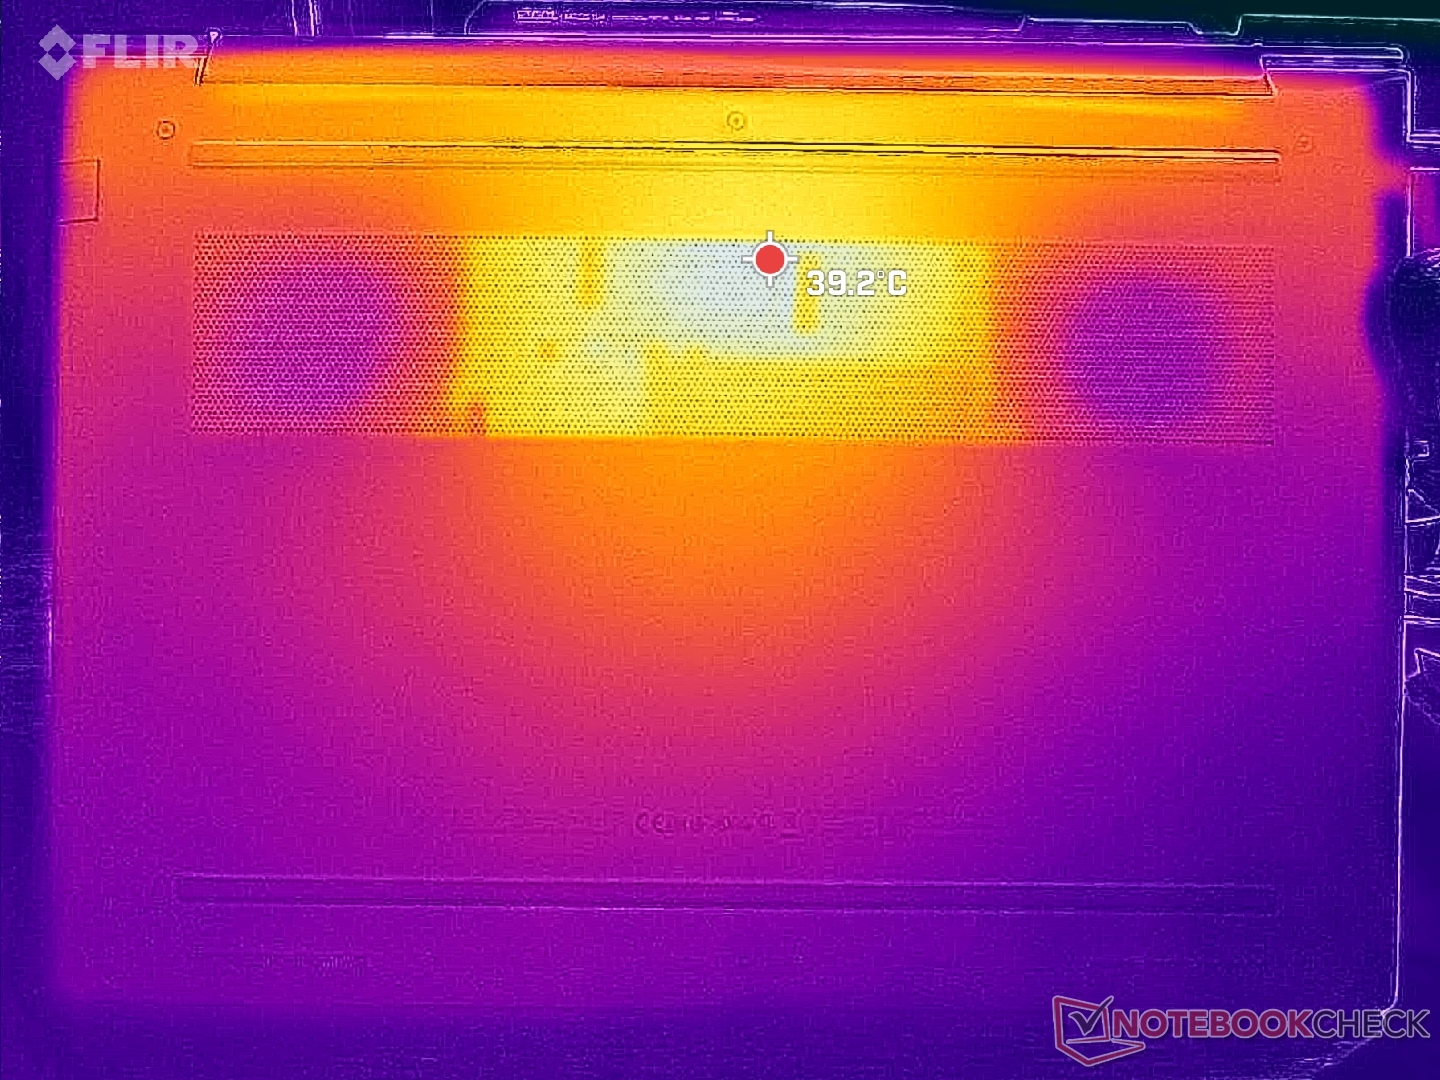
Температура
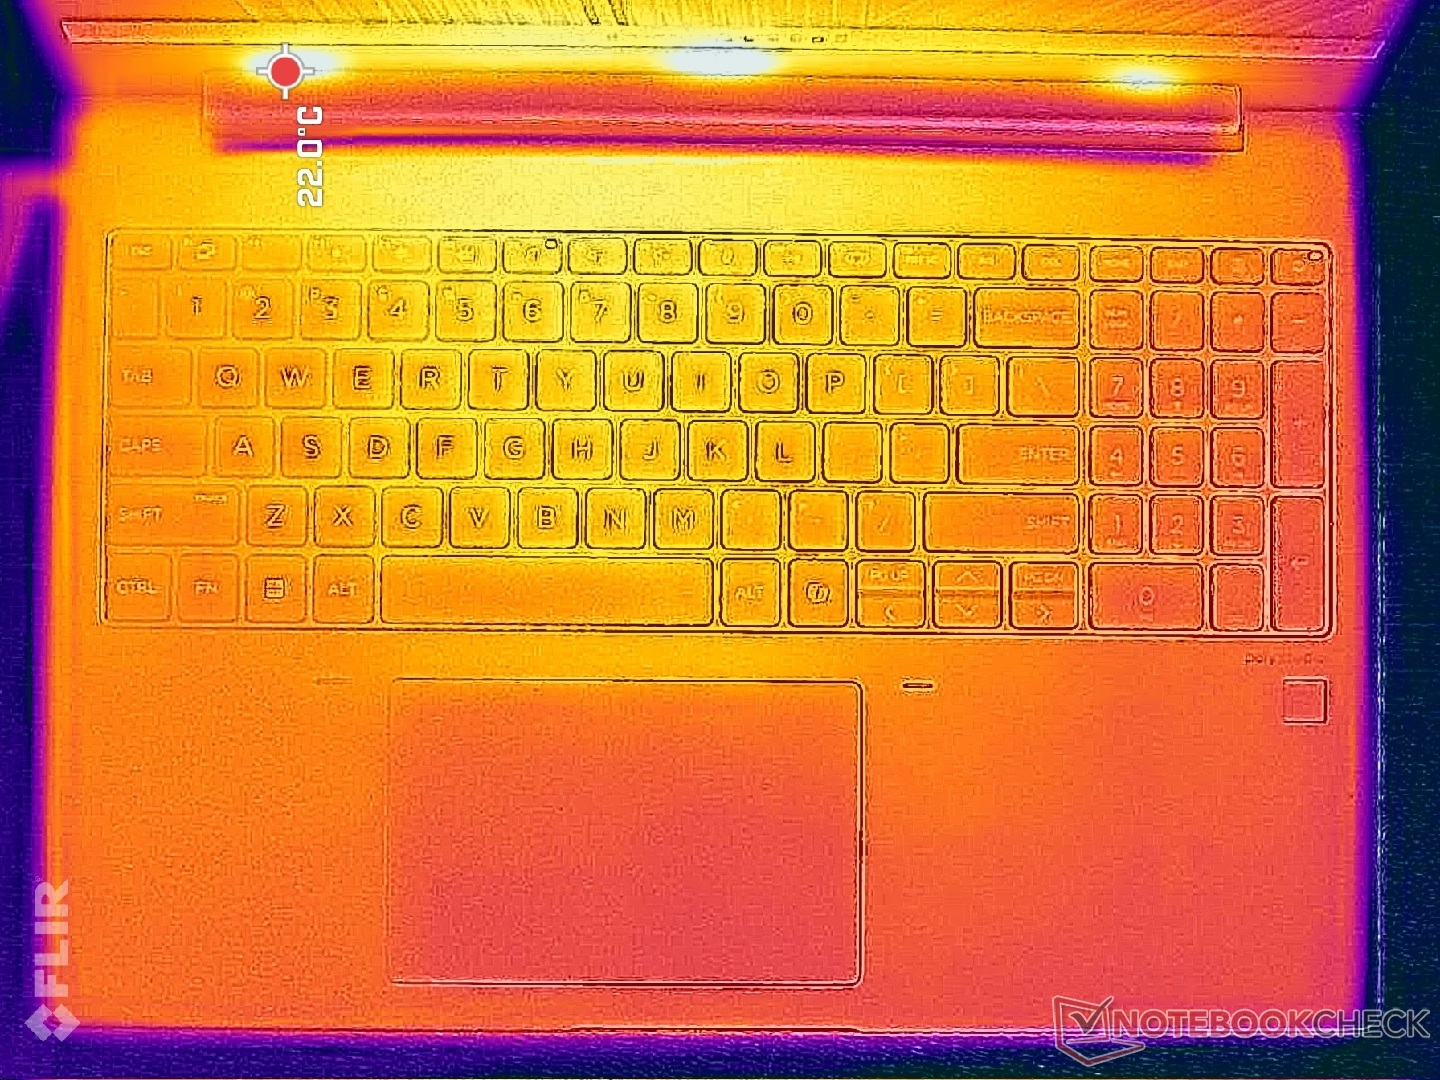
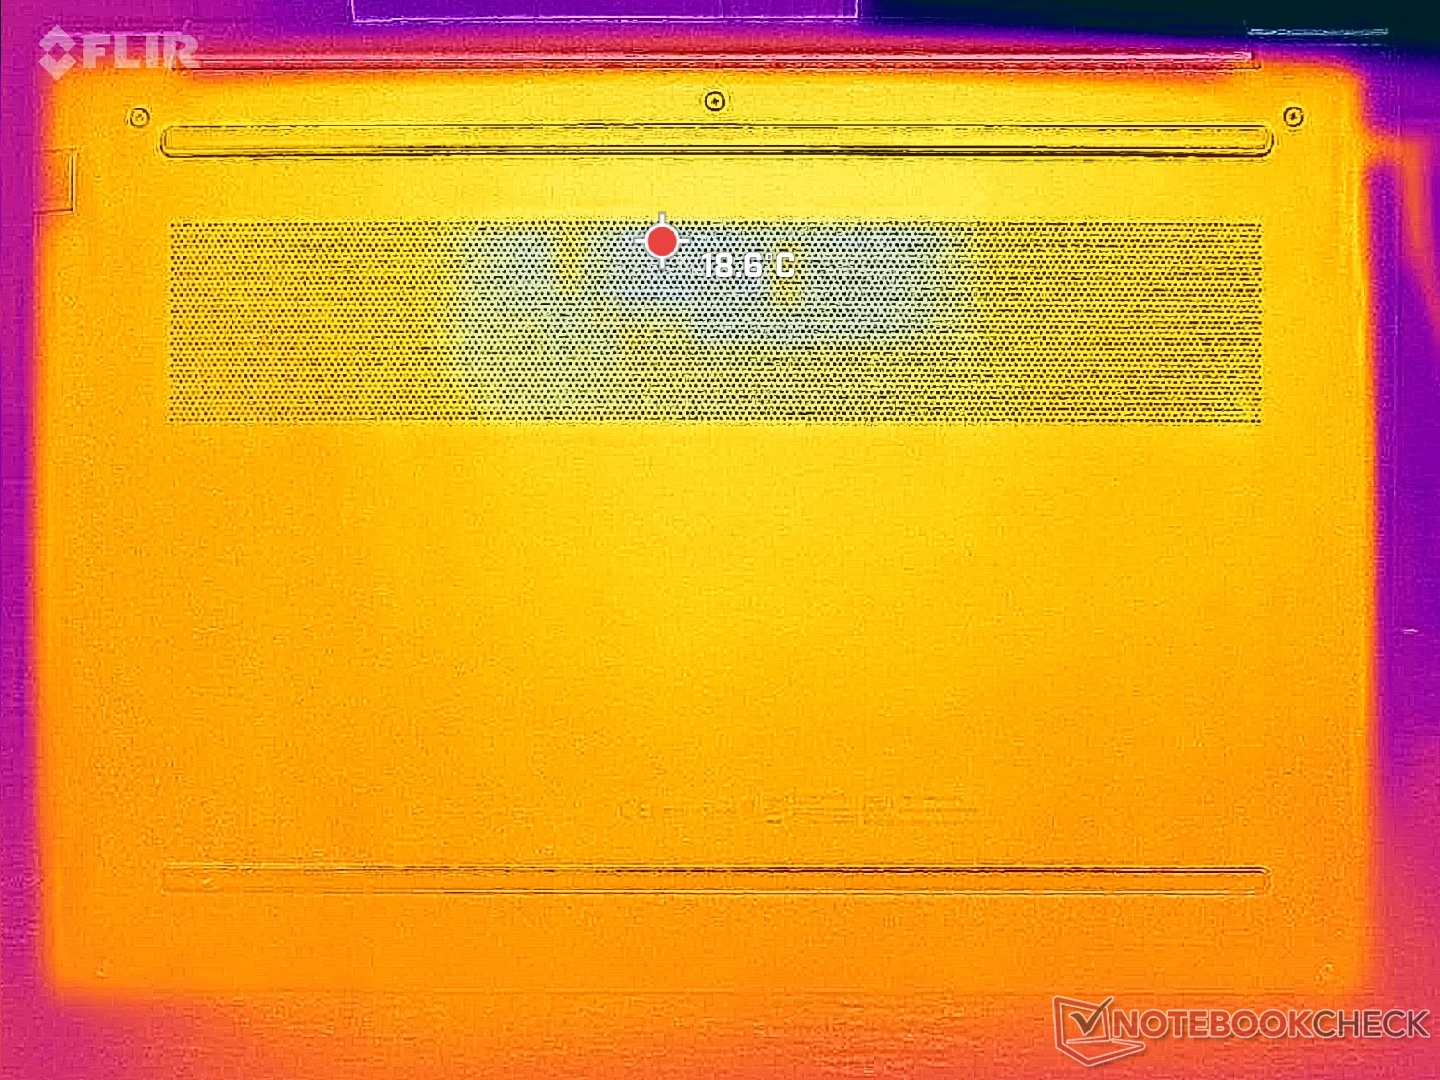
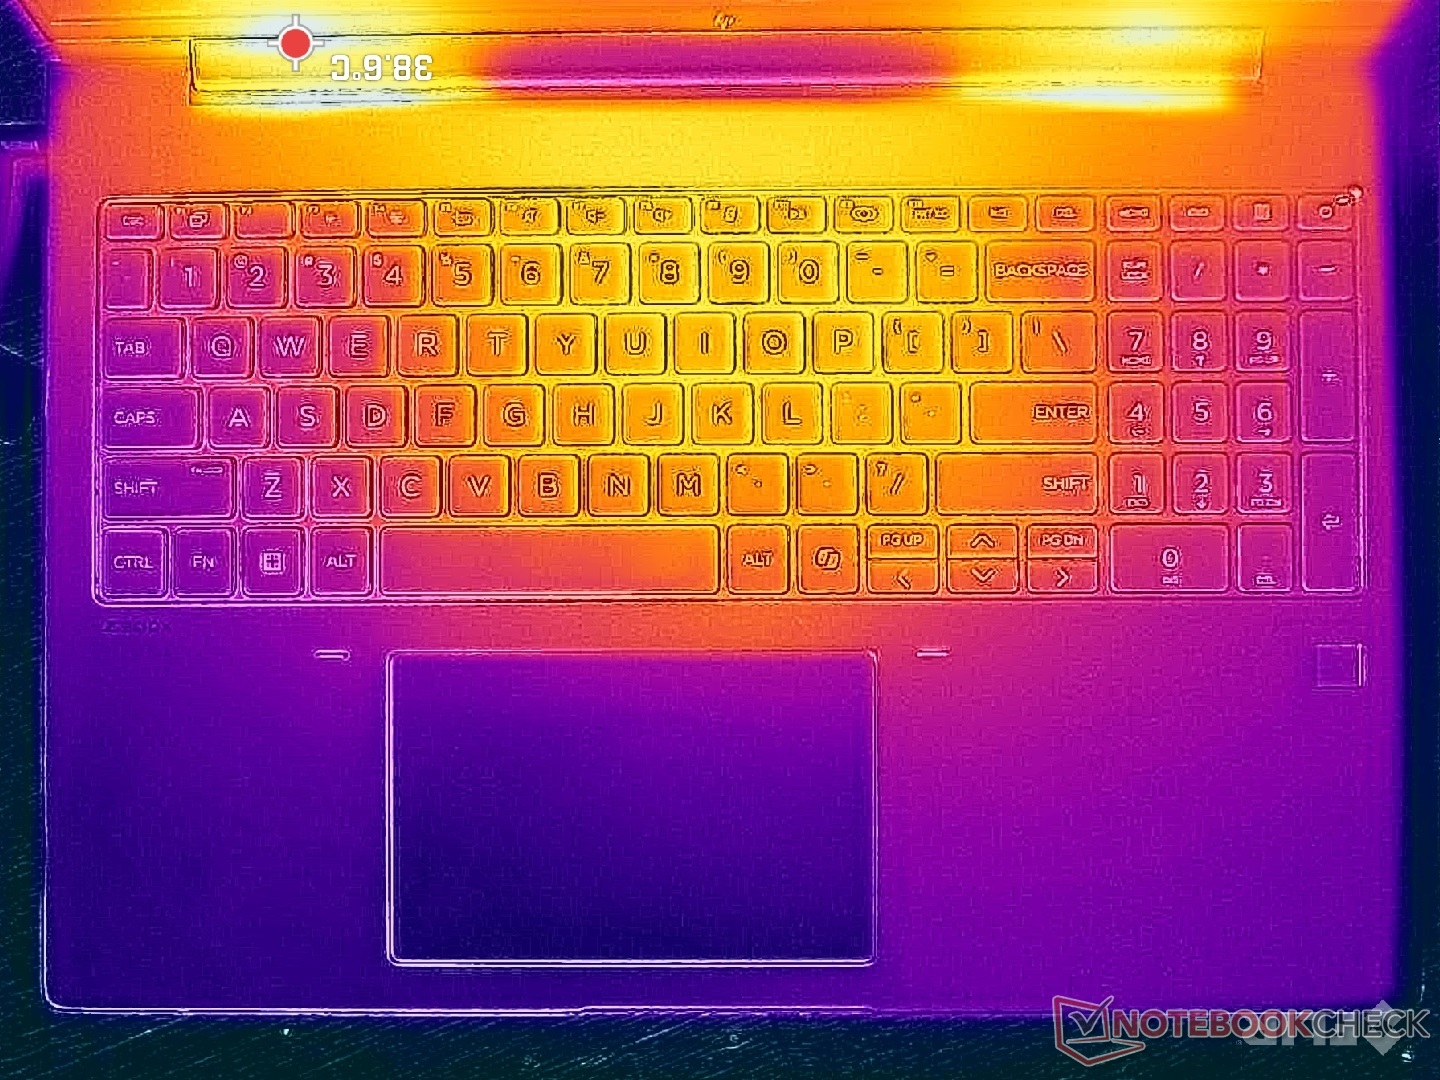
Температура поверхности в целом ниже на нашем новом 16-дюймовом форм-факторе, особенно в отношении нижней крышки. Температура нижней части достигает всего 41 C при работе с высокими нагрузками по сравнению с 48 C на более старой модели ZBook Power 15 G10. Горячая точка в центре клавиатуры также достигает 41 C, в то время как подставка для ладоней и боковые стороны остаются более холодными и комфортными для ладоней и пальцев.
По сравнению с более мощным Precision 5690, устройство Dell еще сильнее нагревается на клавиатуре, в то время как нижняя поверхность остается более прохладной.
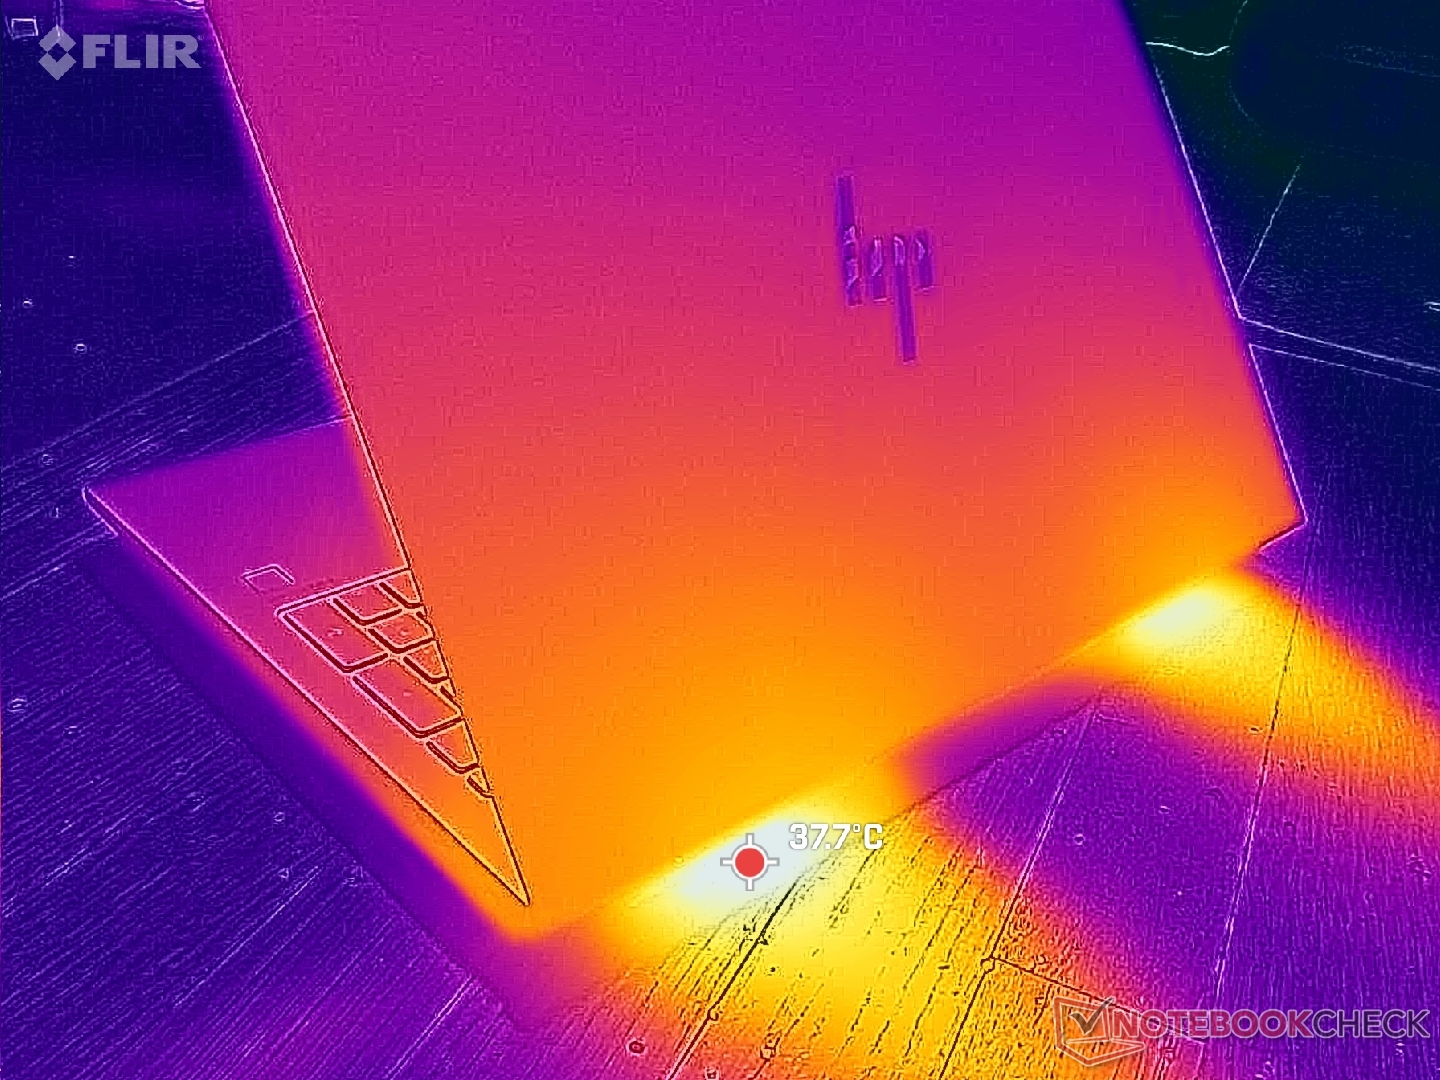
(±) Макс. температура верха корпуса составила 40.6 град. Цельсия. Типичное значение для устройств этого же класса (Workstation) = 38.2 градуса (-ов) при минимуме в 22.2 град. и максимуме в 69.8 град.
(±) Макс. температура дна составила 40.6 град. Цельсия. Типичное значение для устройств этого же класса = 41.2 градуса (-ов).
(+) При отсутствии вычислительной нагрузки верх корпуса нагревается в среднем до 24.6 град. Типичное значение для устройств этого же класса = 32 градуса (-ов).
(+) 3: The average temperature for the upper side is 30.1 °C / 86 F, compared to the average of 32 °C / 90 F for the class Workstation.
(+) Палуба на ощупь: Прохладно (27.2 град. Цельсия).
(±) Средняя температура палубы у похожих моделей составила 27.8 град. Цельсия, это +0.6 градуса (-ов) разницы.
| HP ZBook Power 16 G11 A AMD Ryzen 7 8845HS, NVIDIA RTX 2000 Ada Generation Laptop GPU | HP ZBook Power 15 G10 AMD Ryzen 7 PRO 7840HS, NVIDIA RTX 2000 Ada Generation Laptop GPU | HP ZBook Fury 16 G11 Intel Core i9-14900HX, NVIDIA RTX 3500 Ada Generation Laptop GPU | Lenovo ThinkPad P1 Gen 7 21KV001SGE Intel Core Ultra 7 155H, NVIDIA GeForce RTX 4060 Laptop GPU | Lenovo ThinkPad P16s G2 21K9000CGE AMD Ryzen 7 PRO 7840U, AMD Radeon 780M | Dell Precision 5690 Intel Core Ultra 9 185H, Nvidia RTX 5000 Ada Generation Laptop GPU | |
|---|---|---|---|---|---|---|
| Нагрев | -7% | -26% | -8% | -9% | -8% | |
| Нагрузка, макс. сверху * | 40.6 | 42.4 -4% | 42.2 -4% | 50.3 -24% | 42.7 -5% | 46.6 -15% |
| Нагрузка, макс. на дне * | 40.6 | 47.8 -18% | 48 -18% | 38 6% | 47.2 -16% | 33 19% |
| В простое сверху * | 26 | 26.8 -3% | 37 -42% | 28.3 -9% | 27.8 -7% | 32.4 -25% |
| В простое на дне * | 26.6 | 27.2 -2% | 36.8 -38% | 27.3 -3% | 28.4 -7% | 29.4 -11% |
* ... меньше = лучше
Акустическая система
Анализ АЧХ аудиосистемы HP ZBook Power 16 G11 A
(+) | отличный уровень макс. громкости (87.9 дБА)
Низкие частоты (100 Гц - 315 Гц)
(-) | баса почти нет (на 28.1% меньше медианы)
(±) | он умеренно сбалансирован
Средние частоты (400 Гц - 2000 Гц)
(+) | диапазон не провален и не выпячен (отклонение лишь 1.9% от медианы)
(+) | он ровный, без "горбов" или провалов
Высокие частоты (2 кГц - 16 кГц)
(+) | диапазон отлично сбалансирован (отклонение лишь 3.6% от медианы)
(+) | он ровный, без "горбов" или провалов
Весь диапазон (100 - 16000 Гц)
(±) | звук в целом не очень сбалансирован (15.1% отличия от медианы)
в сравнении с устройствами того же класса
» 29% прямо сравнимых устройств показал(и) себя лучше, 7% примерно так же, 63% значительно хуже
» Δ наилучшего устройства из прямо сравнимых: 7%, средняя Δ: 18%, худший результат: 35%
в сравнении со всеми тестированными устройствами
» 19% известных нам устройств показал(и) себя лучше, 4% примерно так же, 77% значительно хуже
» Δ наилучшего устройства среди известных нам: 4%, средняя Δ: 24%, худший результат: 134%
Анализ АЧХ аудиосистемы Apple MacBook Pro 16 2021 M1 Pro
(+) | отличный уровень макс. громкости (84.7 дБА)
Низкие частоты (100 Гц - 315 Гц)
(+) | бас отлично сбалансирован (отклонение лишь 3.8% от медианы)
(+) | он ровный, без "горбов" или провалов
Средние частоты (400 Гц - 2000 Гц)
(+) | диапазон не провален и не выпячен (отклонение лишь 1.3% от медианы)
(+) | он ровный, без "горбов" или провалов
Высокие частоты (2 кГц - 16 кГц)
(+) | диапазон отлично сбалансирован (отклонение лишь 1.9% от медианы)
(+) | он ровный, без "горбов" или провалов
Весь диапазон (100 - 16000 Гц)
(+) | звук в целом сбалансирован (4.6% отличия от медианы)
в сравнении с устройствами того же класса
» 0% прямо сравнимых устройств показал(и) себя лучше, 0% примерно так же, 100% значительно хуже
» Δ наилучшего устройства из прямо сравнимых: 5%, средняя Δ: 18%, худший результат: 45%
в сравнении со всеми тестированными устройствами
» 0% известных нам устройств показал(и) себя лучше, 0% примерно так же, 100% значительно хуже
» Δ наилучшего устройства среди известных нам: 4%, средняя Δ: 24%, худший результат: 134%
Энергопотребление и автономная работа
Энергопотребление
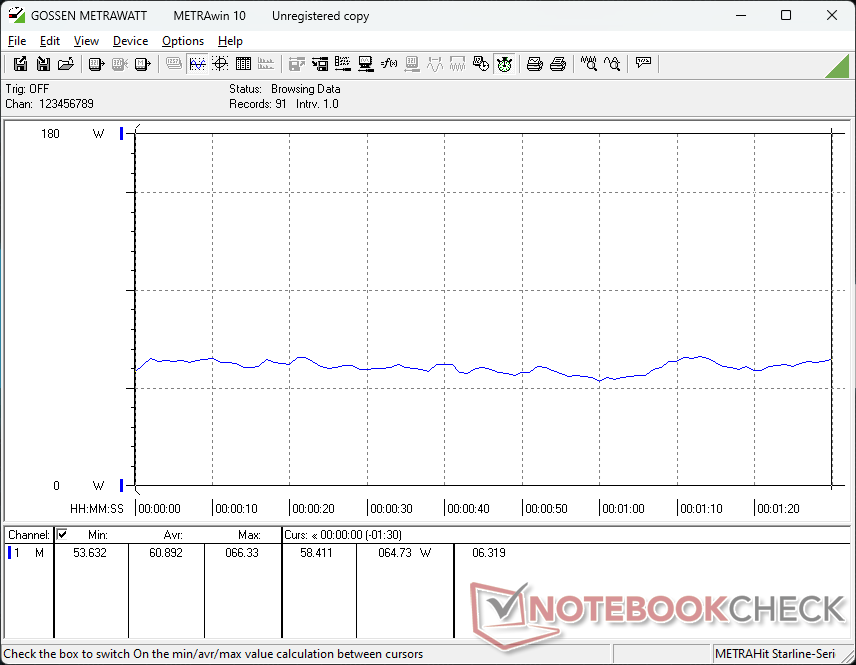
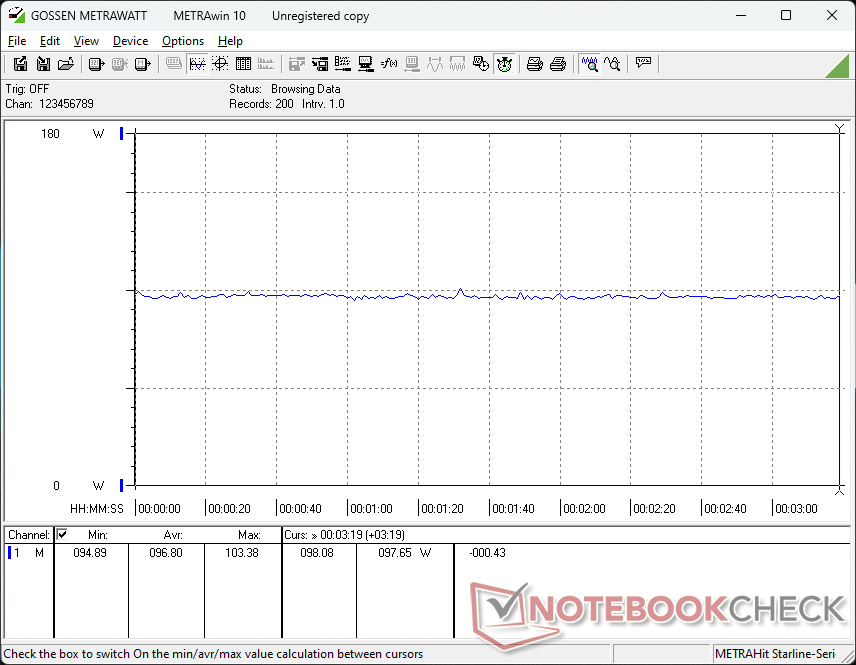
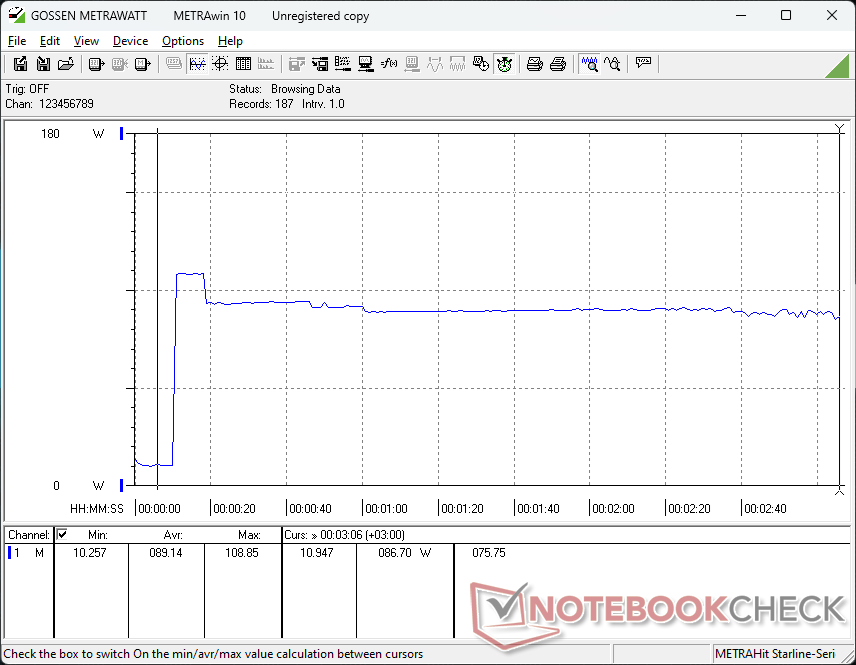
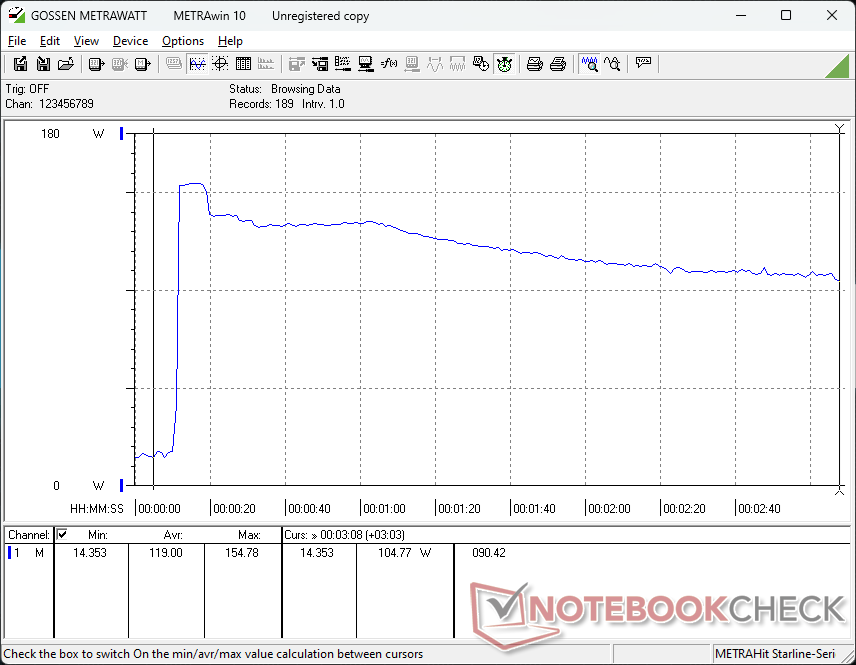
Уровень потребления и поведение аналогичны тому, что мы наблюдали на ZBook Power 15 G10, что неудивительно, учитывая, что огибающая мощности у них одинаковая. Возможно, наиболее заметное различие связано с более низким потреблением около 25 Вт при одновременном выполнении Prime95 и FurMark. Это можно объяснить более жестким дросселированием для охлаждения температуры ядра при таких нагрузках, как упоминалось в разделе "Стресс-тест" выше.
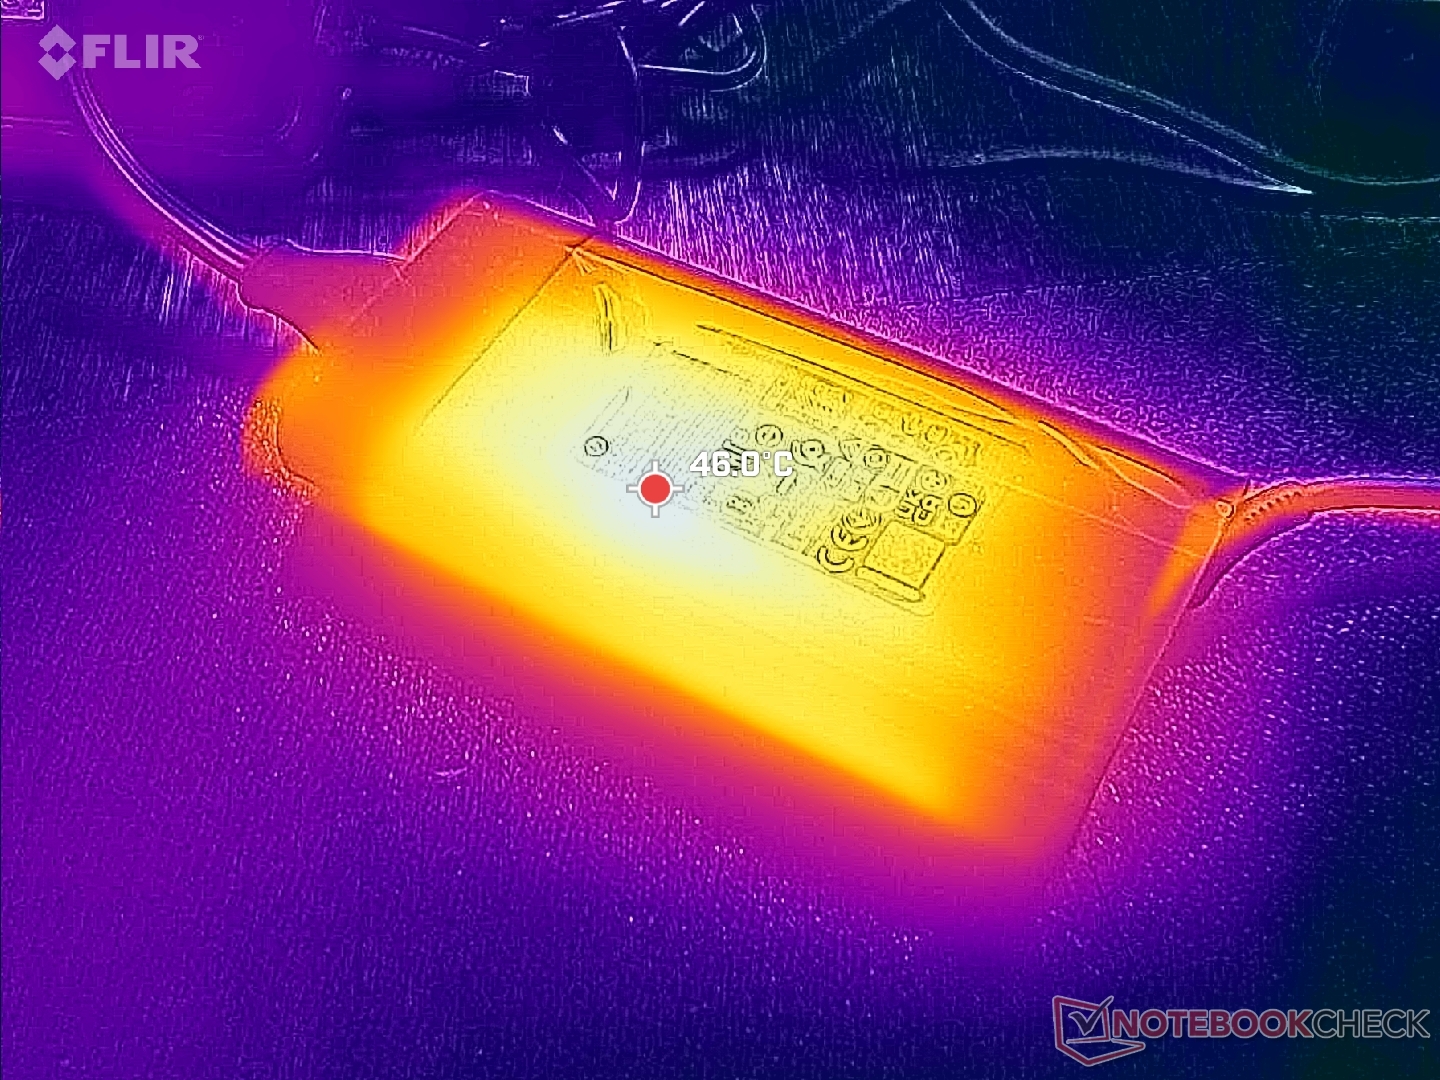
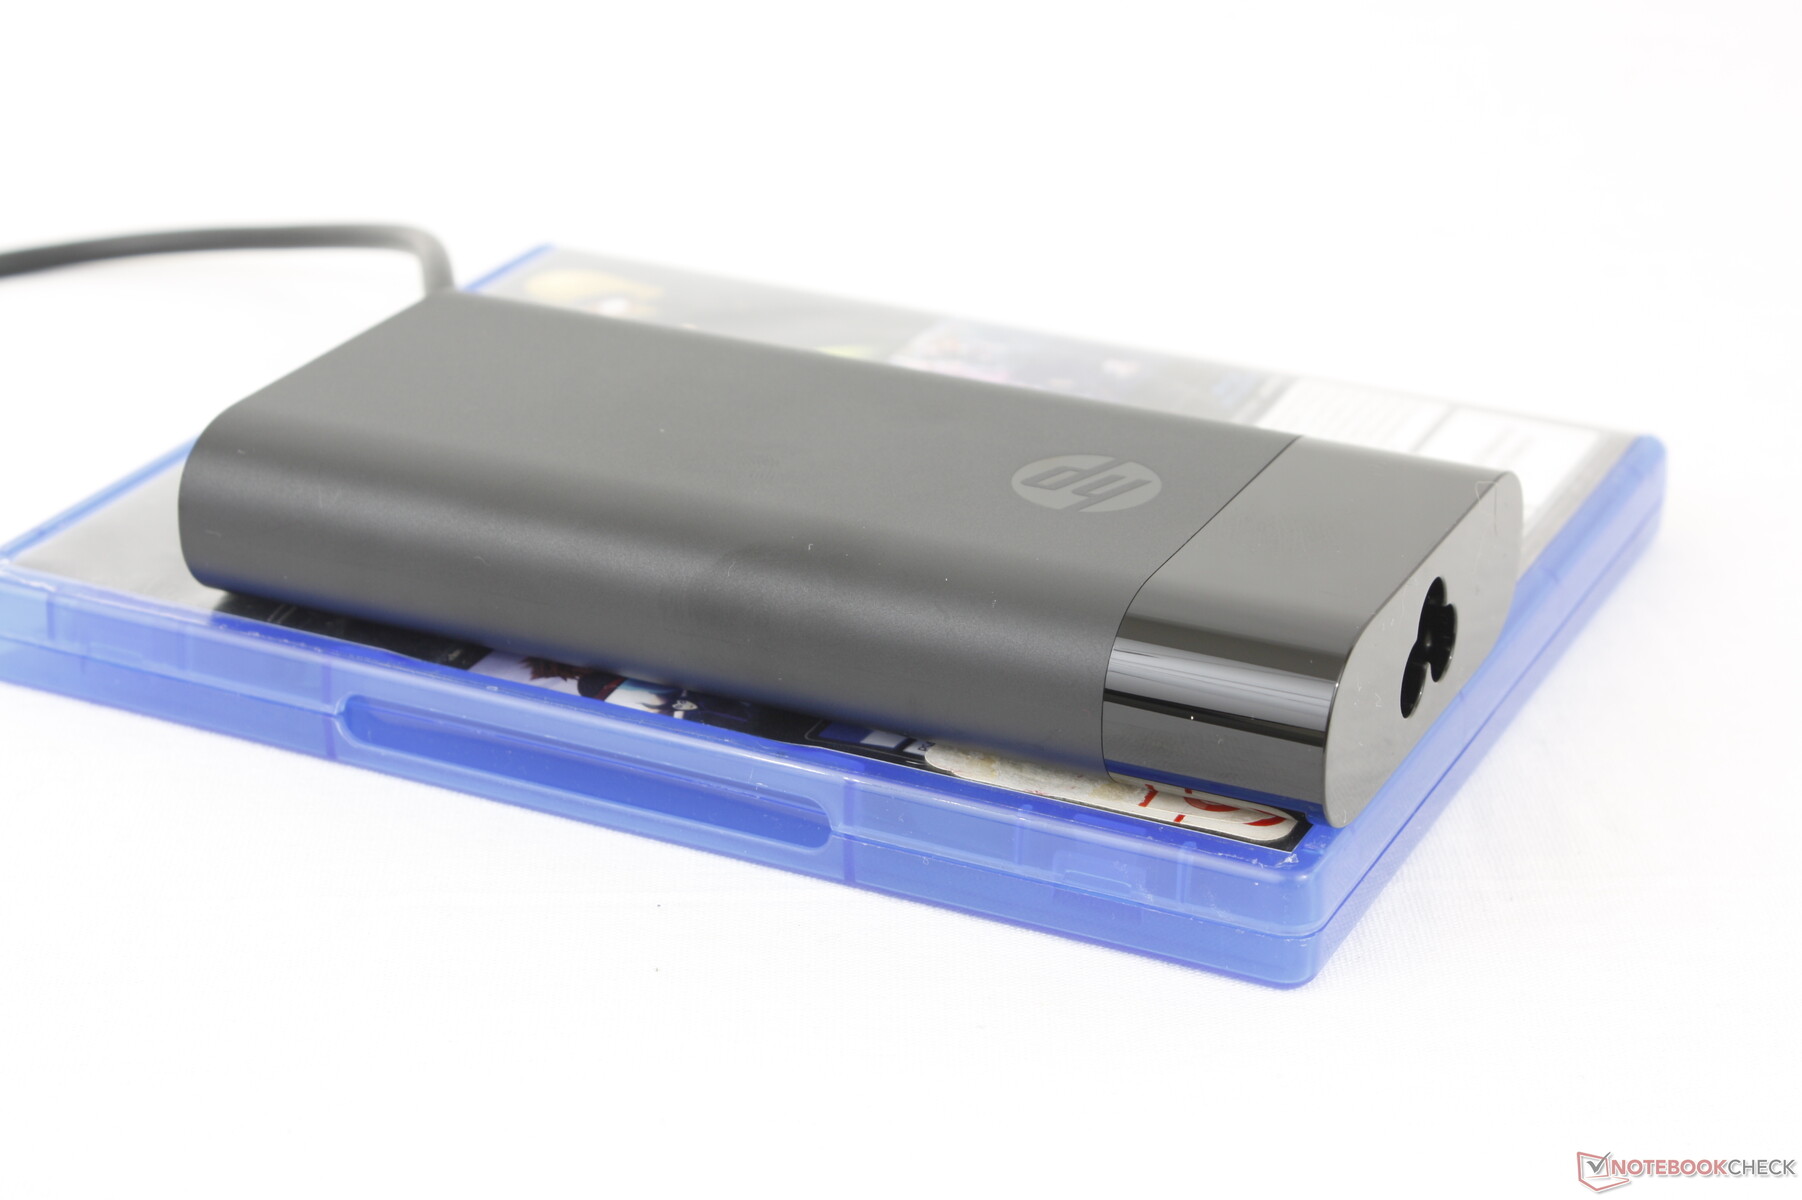
Нам удалось зафиксировать временное максимальное потребление 155 Вт от среднего (~13,8 x 6,5 x 2,2 см) 150-ваттного адаптера переменного тока.
| Выкл. | |
| Ожидание | |
| Нагрузка |
|
Легенда:
min: | |
| HP ZBook Power 16 G11 A R7 8845HS, NVIDIA RTX 2000 Ada Generation Laptop GPU, Samsung PM9A1 MZVL22T0HBLB, IPS, 2560x1600, 16" | HP ZBook Power 15 G10 R7 PRO 7840HS, NVIDIA RTX 2000 Ada Generation Laptop GPU, WDC PC SN810 2TB, IPS, 2560x1440, 15.6" | HP ZBook Fury 16 G11 i9-14900HX, NVIDIA RTX 3500 Ada Generation Laptop GPU, SK hynix PC801 HFS001TEJ9X101N, IPS, 3840x2400, 16" | Lenovo ThinkPad P1 Gen 7 21KV001SGE Ultra 7 155H, NVIDIA GeForce RTX 4060 Laptop GPU, Kioxia XG8 KXG8AZNV1T02, IPS LED, 2560x1600, 16" | Lenovo ThinkPad P16s G2 21K9000CGE R7 PRO 7840U, Radeon 780M, SK hynix PC801 HFS001TEJ9X162N, OLED, 3840x2400, 16" | Dell Precision 5690 Ultra 9 185H, NVIDIA RTX 5000 Ada Generation Laptop GPU, 2x Samsung PM9A1 1TB (RAID 0), OLED, 3840x2400, 16" | |
|---|---|---|---|---|---|---|
| Энергопотребление | -13% | -80% | -35% | 20% | -67% | |
| В простое, мин. * | 4.6 | 5.3 -15% | 8.6 -87% | 7.3 -59% | 6.1 -33% | 7.9 -72% |
| В простое, сред. * | 10 | 9.9 1% | 14.8 -48% | 12.3 -23% | 6.5 35% | 12 -20% |
| В простое, макс. * | 10.6 | 16.7 -58% | 15.7 -48% | 17.9 -69% | 7 34% | 28.6 -170% |
| Нагрузка, сред. * | 60.9 | 61.3 -1% | 129.4 -112% | 78.2 -28% | 56.6 7% | 98.8 -62% |
| Cyberpunk 2077 ultra external monitor * | 92.8 | 192.6 -108% | 117.7 -27% | |||
| Cyberpunk 2077 ultra * | 96.8 | 199.4 -106% | 123.5 -28% | |||
| Нагрузка, макс. * | 154.8 | 145.3 6% | 236.1 -53% | 167.5 -8% | 68.3 56% | 174.8 -13% |
| Witcher 3 ultra * | 87.9 | 61.2 | 144.5 |
* ... меньше = лучше
Энергопотребление: Cyberpunk 2077, Стресс-тест
Энергопотребление с внешним монитором
Автономность
Емкость аккумулятора не изменилась по сравнению с прошлогодним ZBook Power 15 G10, несмотря на обновление форм-фактора. Возможно, по случайному совпадению, время работы осталось практически таким же - чуть более 9,5 часов работы в реальном режиме в сети WLAN до автоматического выключения.
Зарядка от пустого до полного заряда происходит относительно быстро - менее чем за 70 минут. Поддерживается зарядка через USB-C, хотя и на более низкой скорости.
| HP ZBook Power 16 G11 A R7 8845HS, NVIDIA RTX 2000 Ada Generation Laptop GPU, 83 Вт⋅ч | HP ZBook Power 15 G10 R7 PRO 7840HS, NVIDIA RTX 2000 Ada Generation Laptop GPU, 83 Вт⋅ч | HP ZBook Fury 16 G11 i9-14900HX, NVIDIA RTX 3500 Ada Generation Laptop GPU, 95 Вт⋅ч | Lenovo ThinkPad P1 Gen 7 21KV001SGE Ultra 7 155H, NVIDIA GeForce RTX 4060 Laptop GPU, 90 Вт⋅ч | Lenovo ThinkPad P16s G2 21K9000CGE R7 PRO 7840U, Radeon 780M, 84 Вт⋅ч | Dell Precision 5690 Ultra 9 185H, NVIDIA RTX 5000 Ada Generation Laptop GPU, 98 Вт⋅ч | |
|---|---|---|---|---|---|---|
| Время работы | 3% | -31% | 7% | -1% | -6% | |
| В простое | 1566 | |||||
| Чтение сайтов по Wi-Fi v.2 | 582 | 601 3% | 402 -31% | 595 2% | 635 9% | 549 -6% |
| Нагрузка и 100% яркости | 103 | 114 11% | 92 -11% | |||
| Воспр. видео H.264 | 797 |
За
Против
Вердикт - Увеличенный экран, но прежняя производительность
ZBook Power 16 G11 пришел на смену серии ZBook Power 15 с более крупным и тяжелым 16-дюймовым корпусом. Можно было бы предположить, что больший форм-фактор ведет к более высокой производительности, но это, к сожалению, не так. Новые процессоры Hawk Point не сильно превосходят прошлогодние варианты Phoenix, а варианты GPU остались точно такими же, вплоть до потолка TGP. Переделка корпуса была шансом HP улучшить систему охлаждения и выжать больше производительности из процессоров, но мы полагаем, что производитель не хотел слишком сильно вторгаться на территорию более дорогого ZBook Fury.
Опции дисплея также немного разочаровывают для рабочей станции. Кроме уникального варианта с яркостью 1000 нит, здесь нет таких примечательных особенностей, как OLED, цвета P3 или разрешение 4K. Такие панели сделали бы больший размер экрана гораздо более привлекательным по сравнению с предыдущей 15,6-дюймовой версией. Вместо этого пользователи ограничены 2K и IPS.
ZBook Power 16 G11 мало чем отличается от своего предшественника, кроме большего размера 16-дюймового экрана. Производительность и возможности этих двух моделей практически одинаковы.
HP по-прежнему является сильной рабочей станцией среднего уровня, несмотря на отсутствие обновлений производительности и новых функций. Производительность процессора по-прежнему заметно выше, чем у ThinkPad P16s G2 которая ограничена процессорами серии Ryzen-U, и при этом стоит дешевле, чем популярная модель Dell Precision 5690 при конфигурации с тем же GPU. Однако если у Вас уже есть ZBook Power 15 G10, то более тяжелая 16-дюймовая версия может показаться Вам лишней.
Примечание: Недавно мы обновили нашу систему рейтинга, и результаты версии 8 не сопоставимы с результатами версии 7. Более подробная информация доступна здесь .
HP ZBook Power 16 G11 A
- 30 September 2024 v8
Allen Ngo
 Total Sustainability Score:
 Декларация о непредвзятости
Отбор устройств для обзора осуществляется нашей редакцией. Тестовый образец был предоставлен автору производителем или продавцом для целей настоящего обзора. Кредитор не имел никакого влияния на этот обзор, и производитель не получил копию этого обзора до публикации. Обязанности публиковать этот обзор не было. Мы никогда не принимаем компенсацию или оплату в обмен на наши отзывы. Являясь независимой медиа-компанией, Notebookcheck не подчиняется власти производителей, розничных продавцов или издателей.
Вот как проводит тестирование Notebookcheck
Каждый год Notebookcheck независимо проверяет сотни ноутбуков и смартфонов, используя стандартизированные процедуры, чтобы гарантировать сопоставимость всех результатов. В течение примерно 20 лет мы постоянно совершенствовали наши методы испытаний и при этом установили отраслевые стандарты. В наших испытательных лабораториях опытные специалисты и редакторы используют высококачественное измерительное оборудование. Эти тесты включают в себя многоэтапный процесс проверки. Наша сложная рейтинговая система основана на сотнях обоснованных измерений и критериев, что обеспечивает объективность.
Price comparison

