

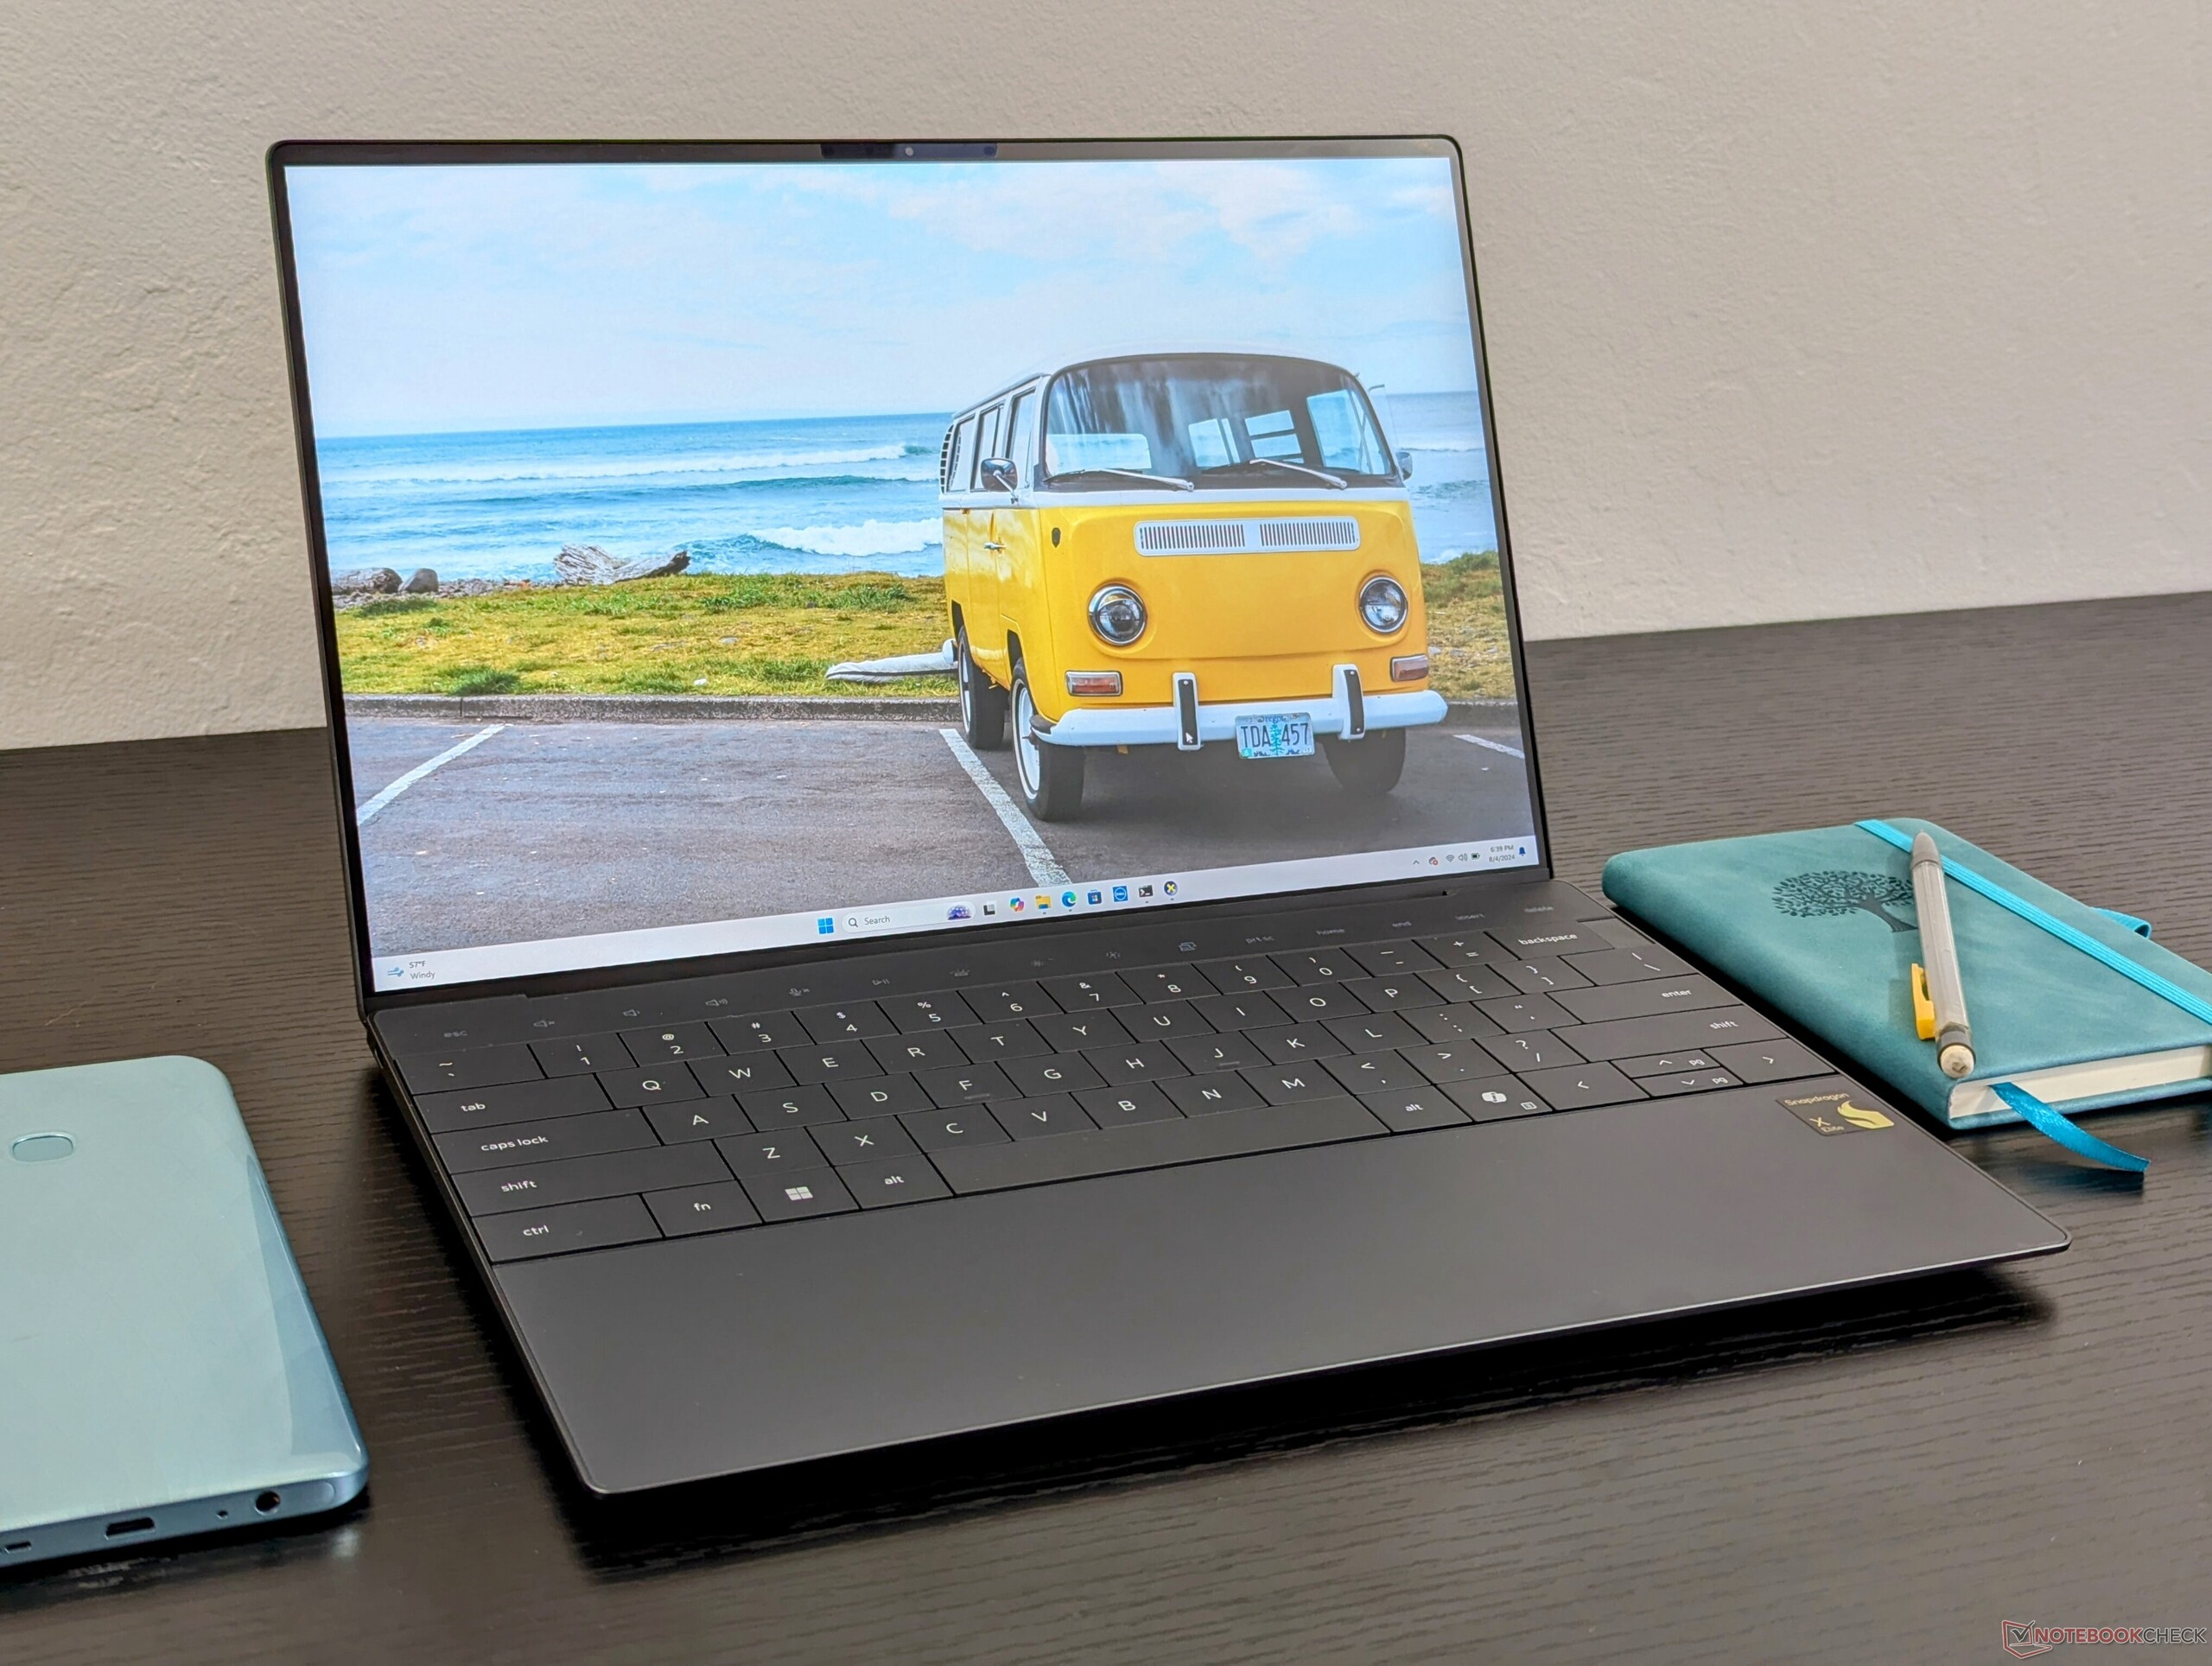
Обзор Dell XPS 13 9345 Snapdragon X Elite: Новый конкурент Intel Core Ultra 7

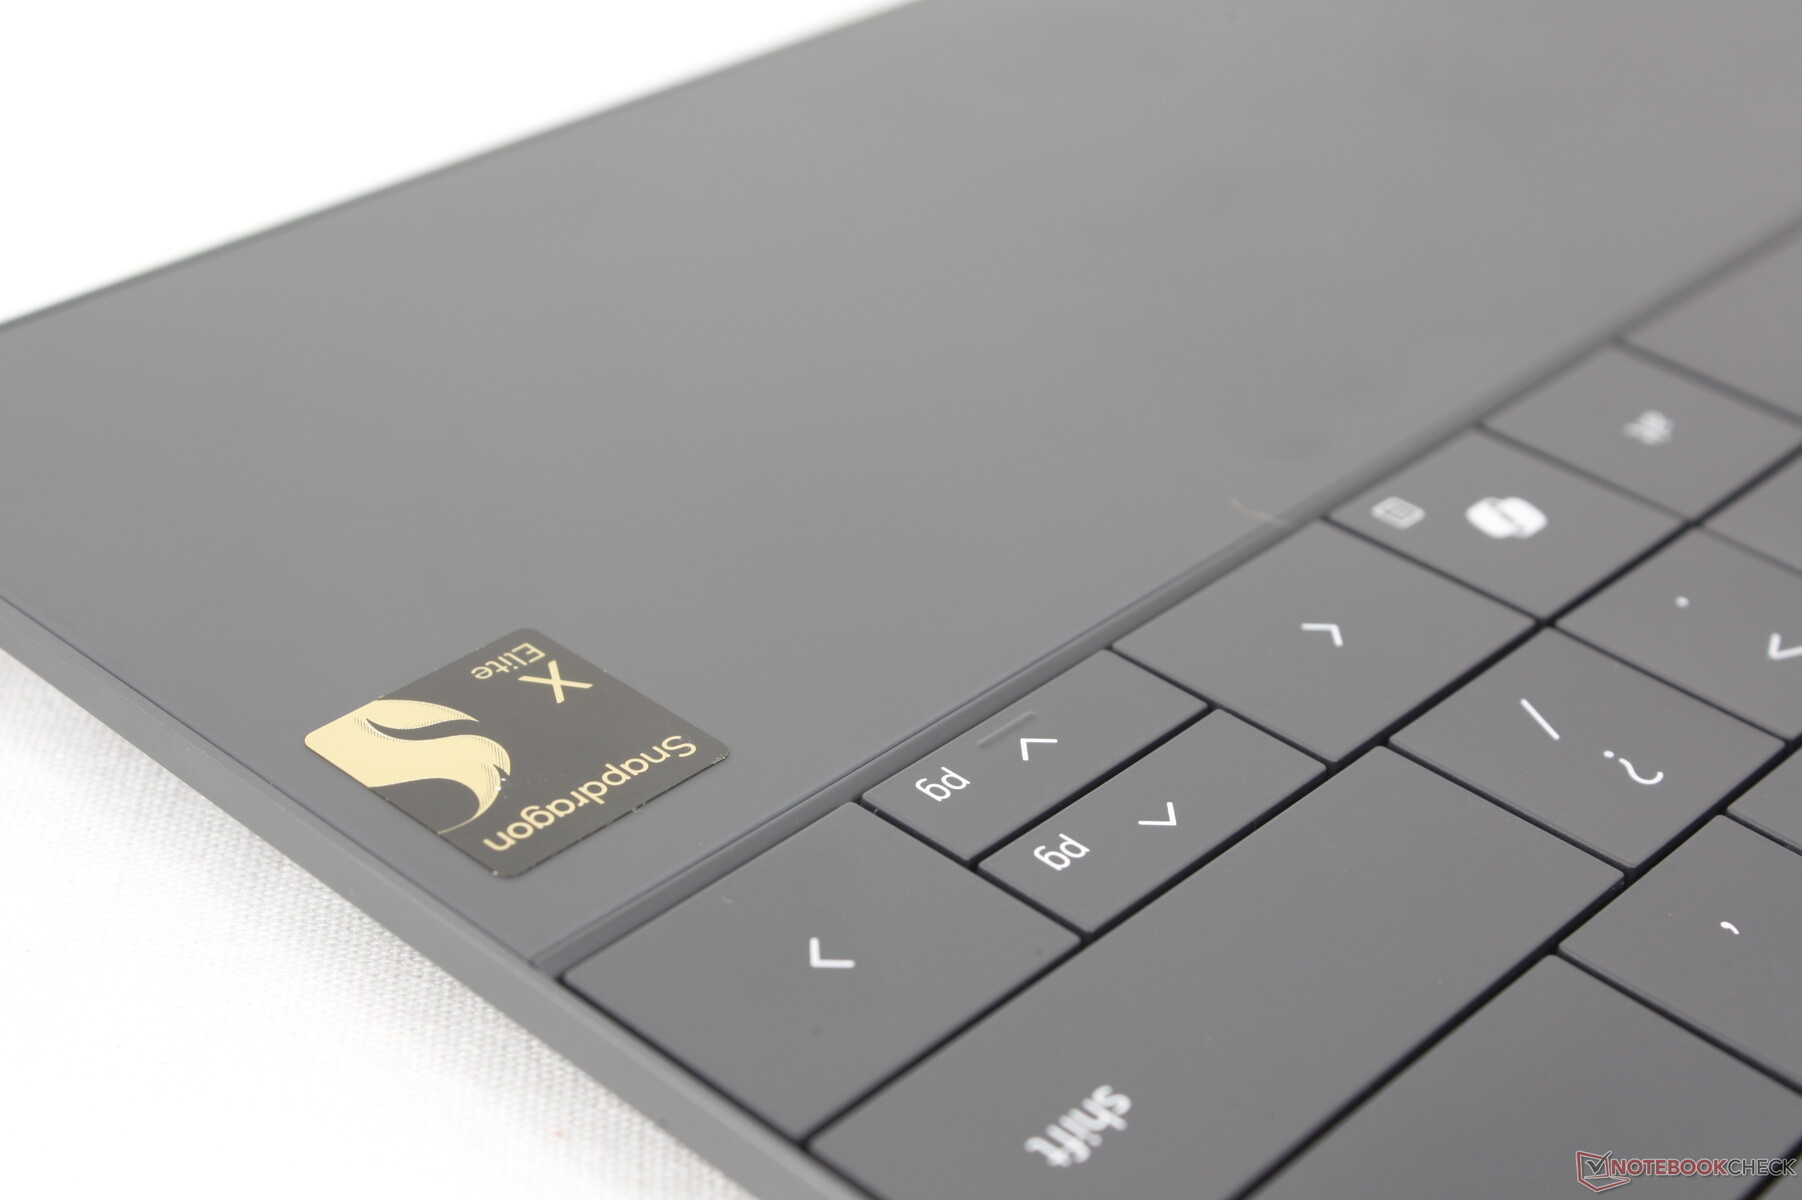
Что может быть лучше, чем продемонстрировать свой процессор на одном из самых популярных потребительских ноутбуков Dell? Корпус XPS 13 Plus 9320/9340 был переоборудован новейшим процессором Snapdragon X Elite, чтобы стать одним из немногих ноутбуков на базе Qualcomm для Windows, выпущенных в этом году. Модель под названием XPS 13 9345 с процессором Snapdragon в остальном визуально идентична существующей модели XPS 13 Plus 9320 или 9340 с традиционными процессорами Intel.
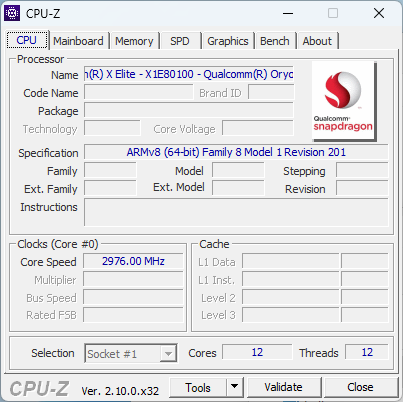
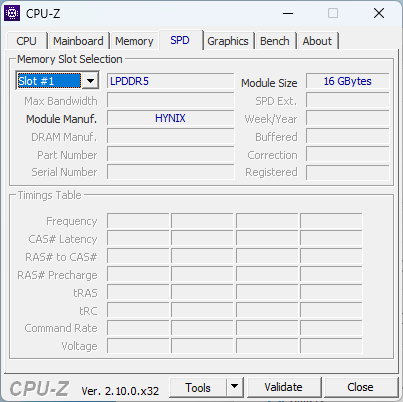
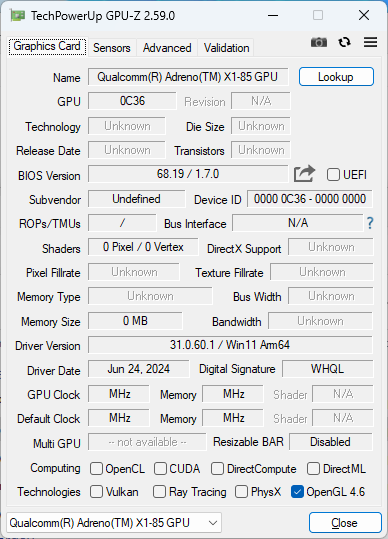
Наша обзорная конфигурация оснащена Snapdragon X1 Elite X1E-80-100, 16 ГБ оперативной памяти LPDDR5X-8448 и IPS-дисплеем 1200p 120 Гц по цене около $1300 USD. Доступны OLED-панели более высокого класса, а в некоторых регионах может быть установлен второй вариант процессора Snapdragon X1 Plus X1P, но интегрированный GPU остается неизменным во всех моделях.
Альтернативами XPS 13 9345 являются следующие модели Microsoft Surface Pro или Samsung Galaxy Book4 Edge 16 оба оснащены одним и тем же процессором Snapdragon X1 Elite X1E-80-100. Конечно, он также напрямую конкурирует с более традиционными 13- и 14-дюймовыми офисными субноутбуками, такими как Lenovo ThinkBook 13x G4, Asus ZenBook S13или собственный XPS 13 9340 от Dell.
Другие обзоры Dell:
Соперники
Рейтинг | Версия | Дата | Модель | Вес | Height | Размер | Разрешение | Цена |
|---|---|---|---|---|---|---|---|---|
| 84.5 % | v8 | August 2024 | Dell XPS 13 9345 SD X Elite X1E-80-100, Adreno X1-85 3.8 TFLOPS | 1.2 килог. | 15.3 мм | 13.40" | 1920x1200 | |
| 86.5 % v7 (old) | v7 (old) | May 2024 | Dell XPS 13 9340 Core Ultra 7 Ultra 7 155H, Arc 8-Core | 1.2 килог. | 15.3 мм | 13.40" | 1920x1200 | |
| 86.2 % | v8 | July 2024 | Microsoft Surface Laptop 7 13.8 Copilot+ SD X Elite X1E-80-100, Adreno X1-85 3.8 TFLOPS | 1.3 килог. | 17.5 мм | 13.80" | 2304x1536 | |
| 90.1 % v7 (old) | v7 (old) | October 2024 | Lenovo ThinkBook 13x G4 21KR0008GE Ultra 5 125H, Arc 7-Core | 1.2 килог. | 12.9 мм | 13.50" | 2880x1920 | |
| 82.3 % | v8 | July 2024 | HP EliteBook Ultra G1q 14 SD X Elite X1E-78-100, Adreno X1-85 3.8 TFLOPS | 1.3 килог. | 11.2 мм | 14.00" | 2240x1400 | |
| 85.4 % v7 (old) | v7 (old) | May 2023 | Asus ZenBook S13 OLED UX5304 i7-1355U, Iris Xe G7 96EUs | 1 килог. | 11.8 мм | 13.30" | 2880x1800 |
Hinweis: Мы провели актуализацию нашей рейтинговой системы, и результаты рейтинга версии 8 не могут быть сопоставлены с результатами рейтинга версии 7. Более подробная информация находится здесь verfügbar.
Примечание: Недавно мы обновили нашу систему рейтингов, и результаты 8-й версии не сравнимы с результатами 7-й версии. Дополнительная информация доступна здесь .
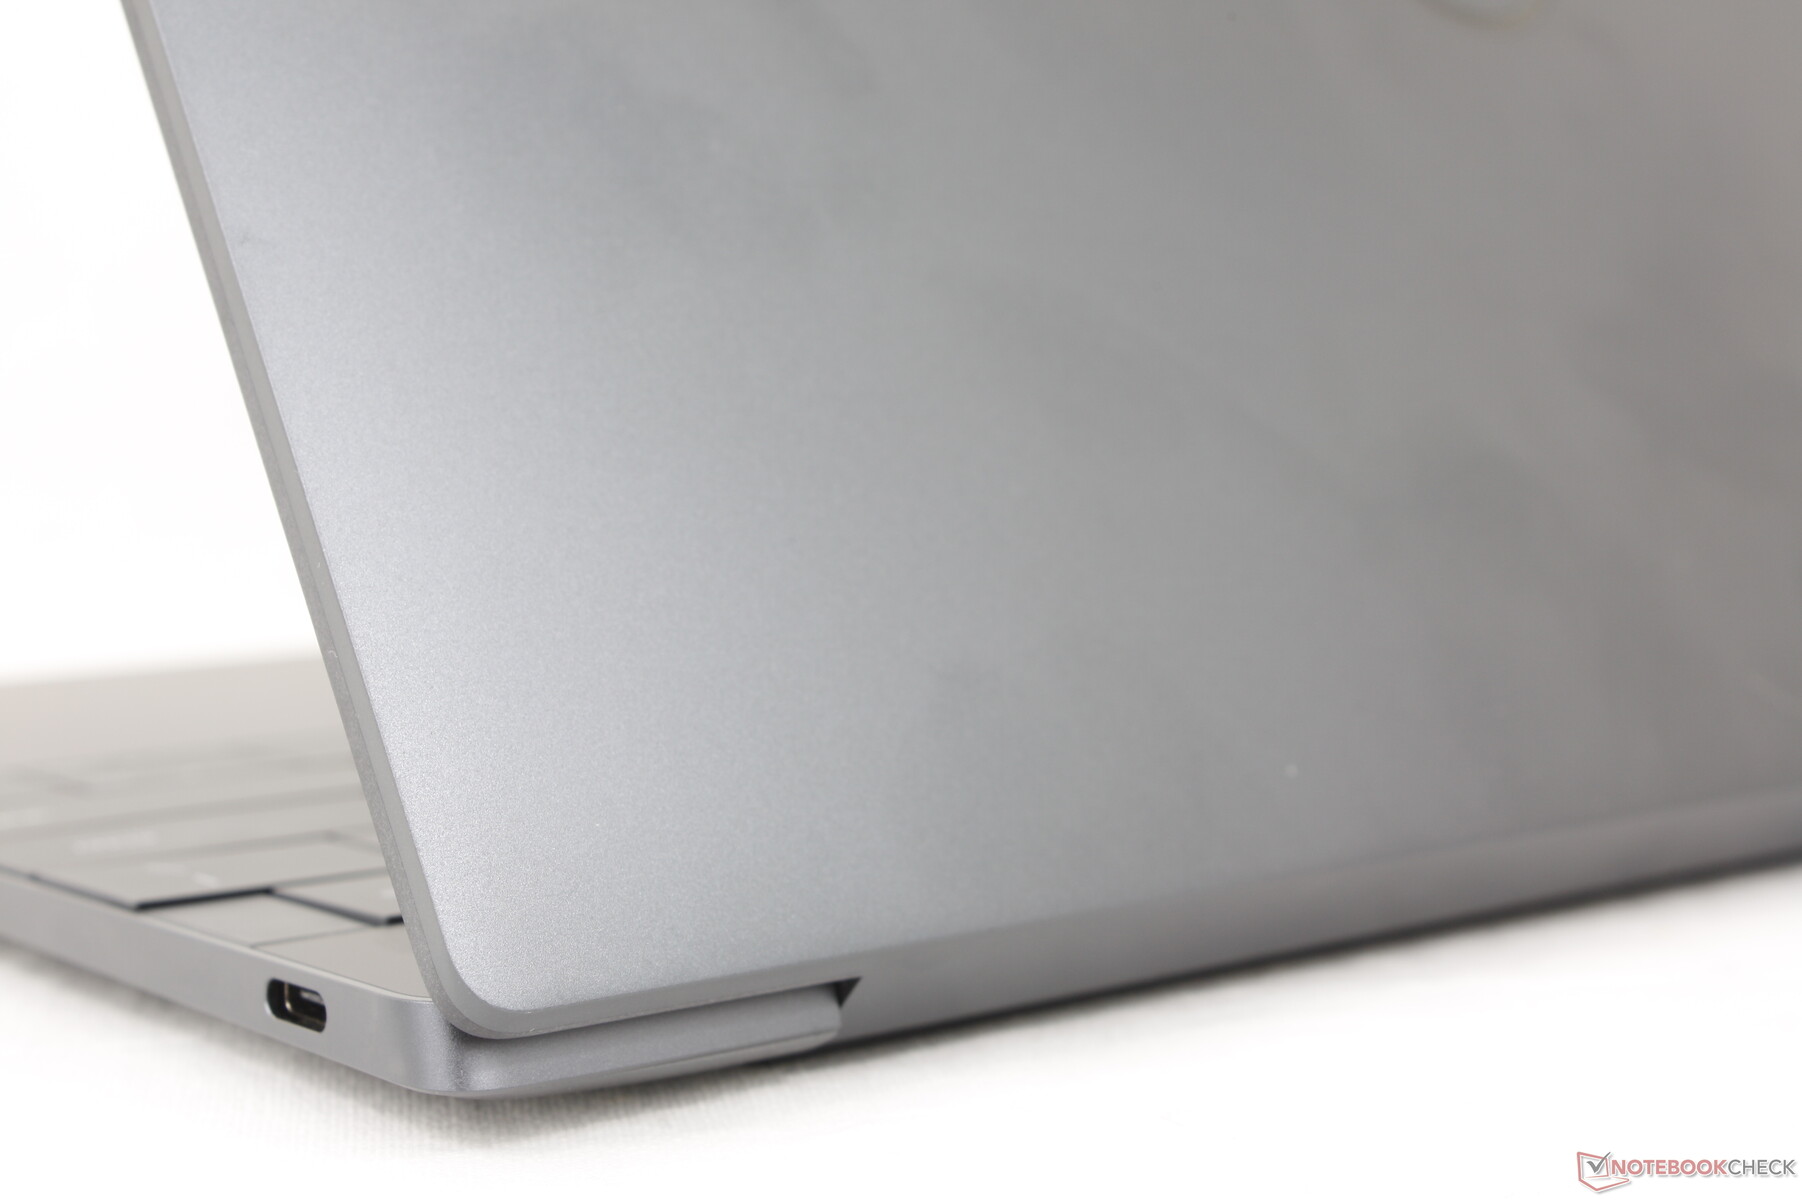
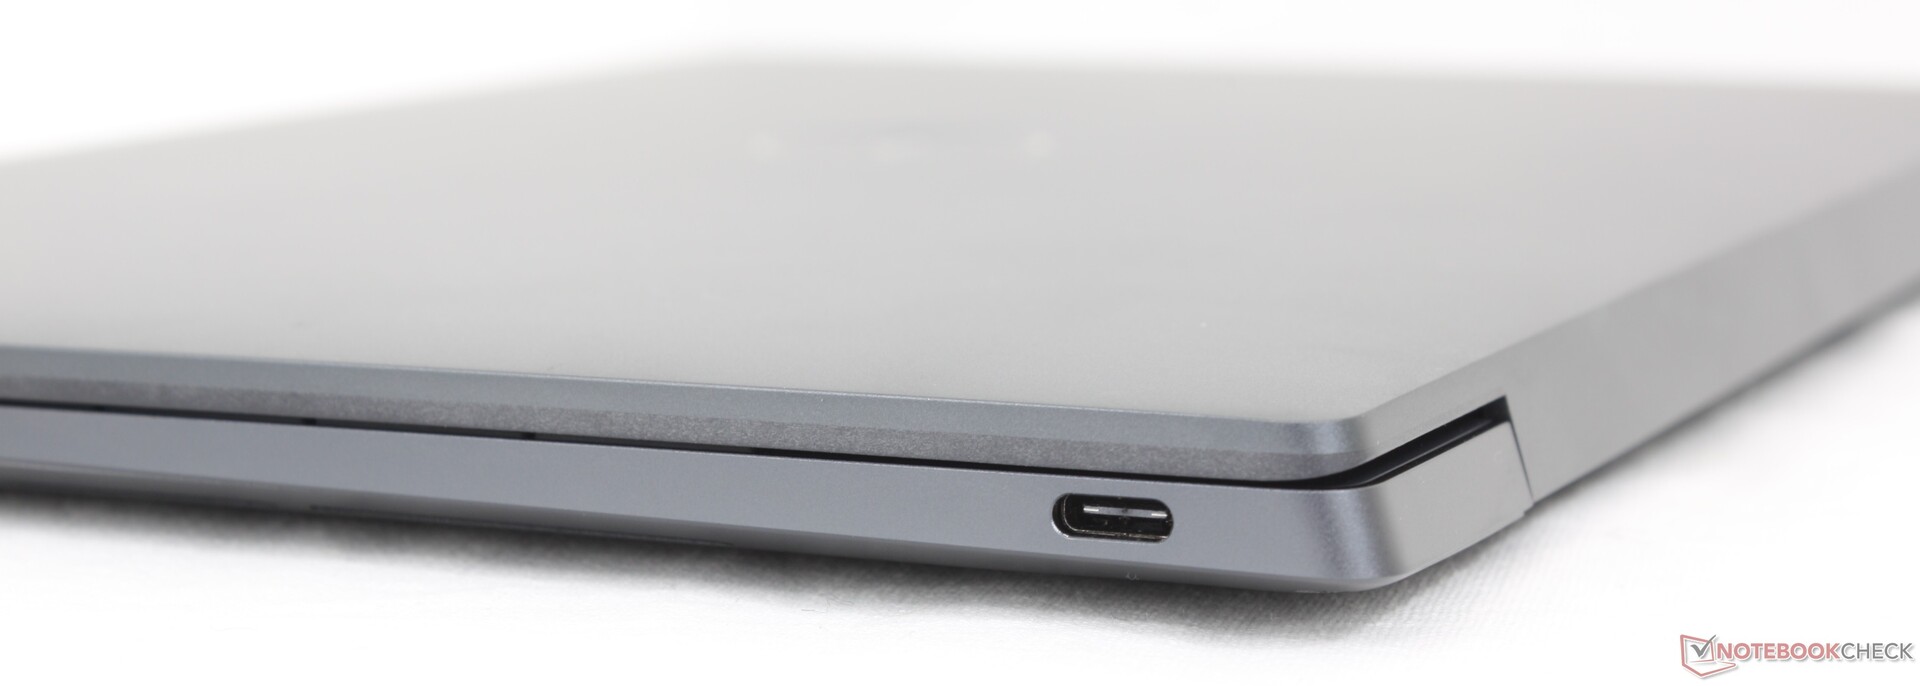
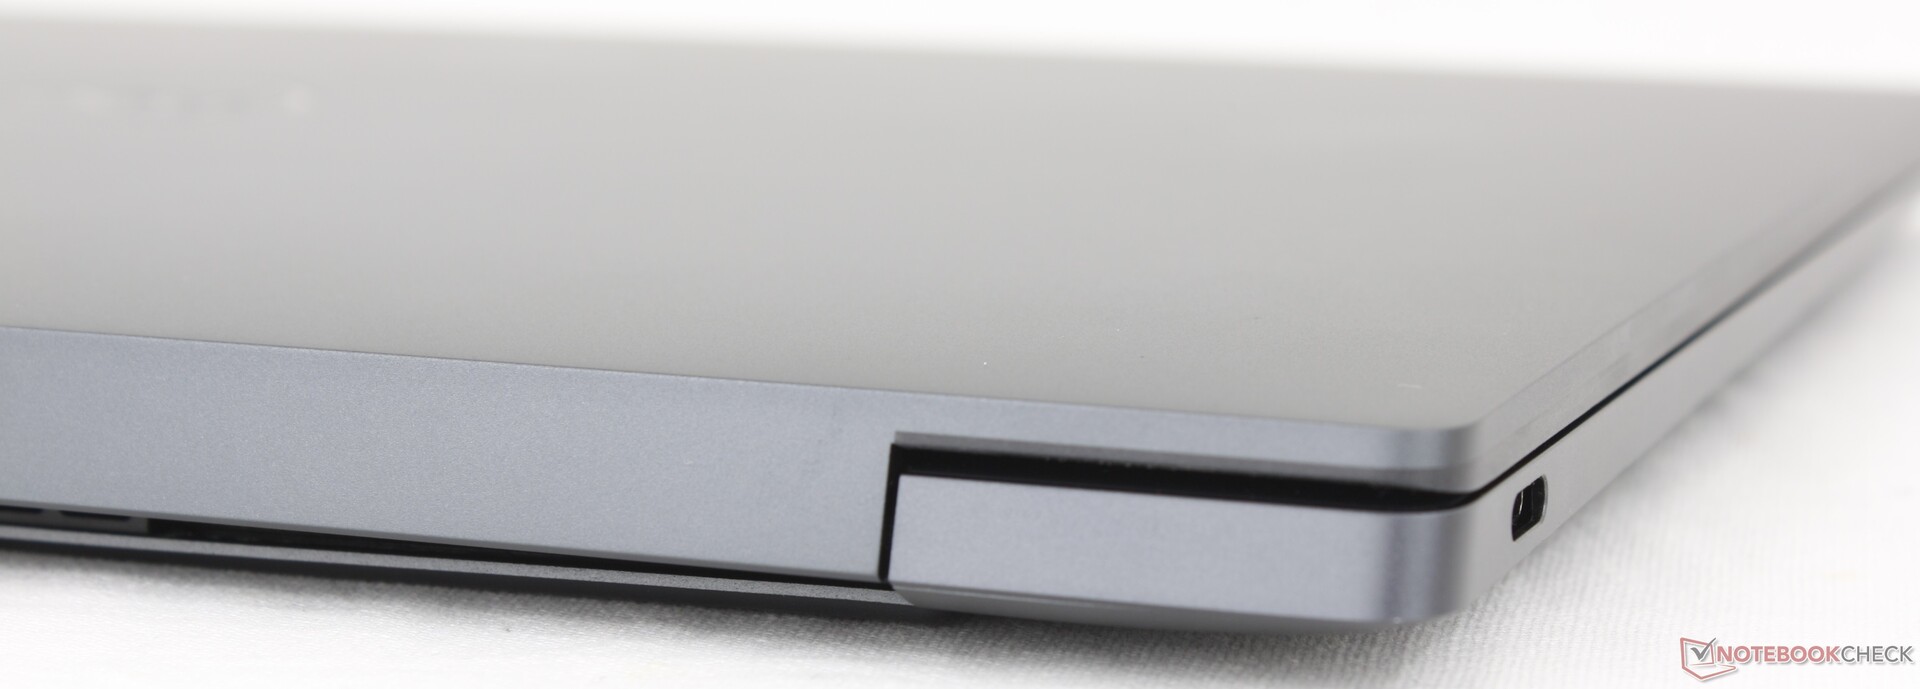
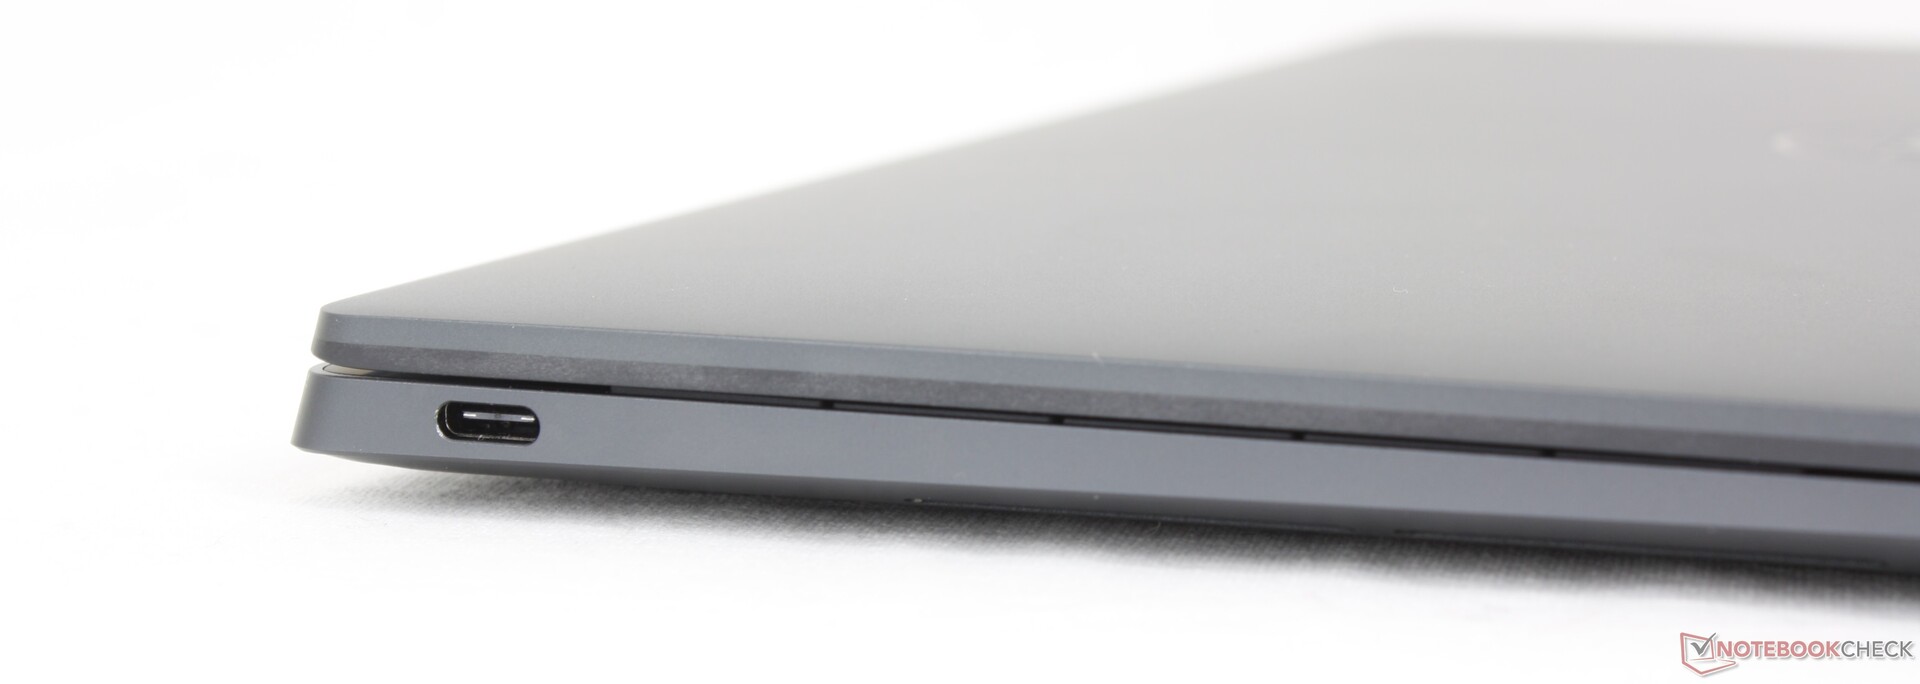
Дизайн и особенности - Знакомый стиль
Нет никаких внешних различий, отделяющих модель Qualcomm от модели Intel, поэтому наши комментарии по поводу модели Intel применимы и здесь. Неплохо было бы добавить несколько новых вариантов расцветки, но в данном случае используются все те же варианты Platinum и Graphite. Мы немного отдаем предпочтение варианту Platinum, поскольку его яркий белый цвет лучше скрывает отпечатки пальцев, чем более темный вариант Graphite нашего тестового устройства Qualcomm, особенно вдоль упоров для ладоней и внешней крышки.
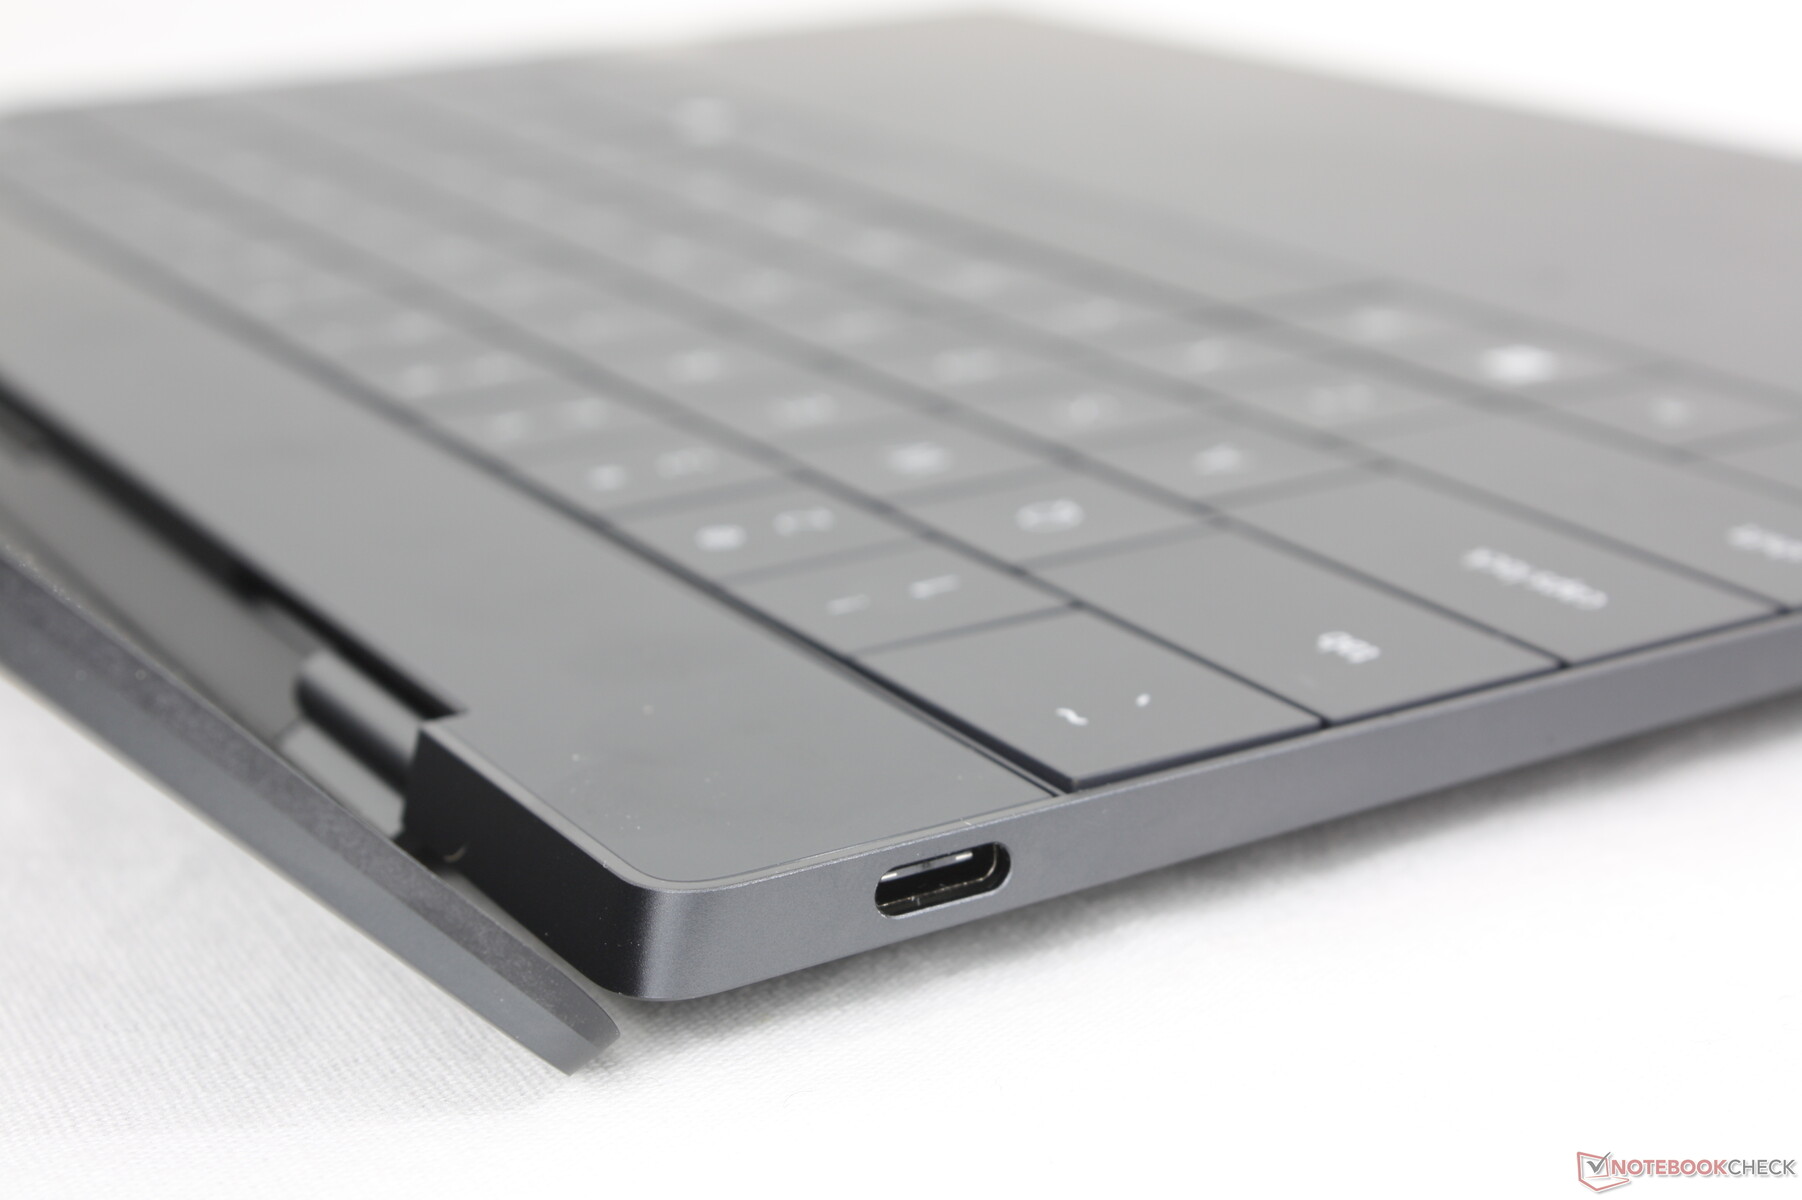
Оснащение
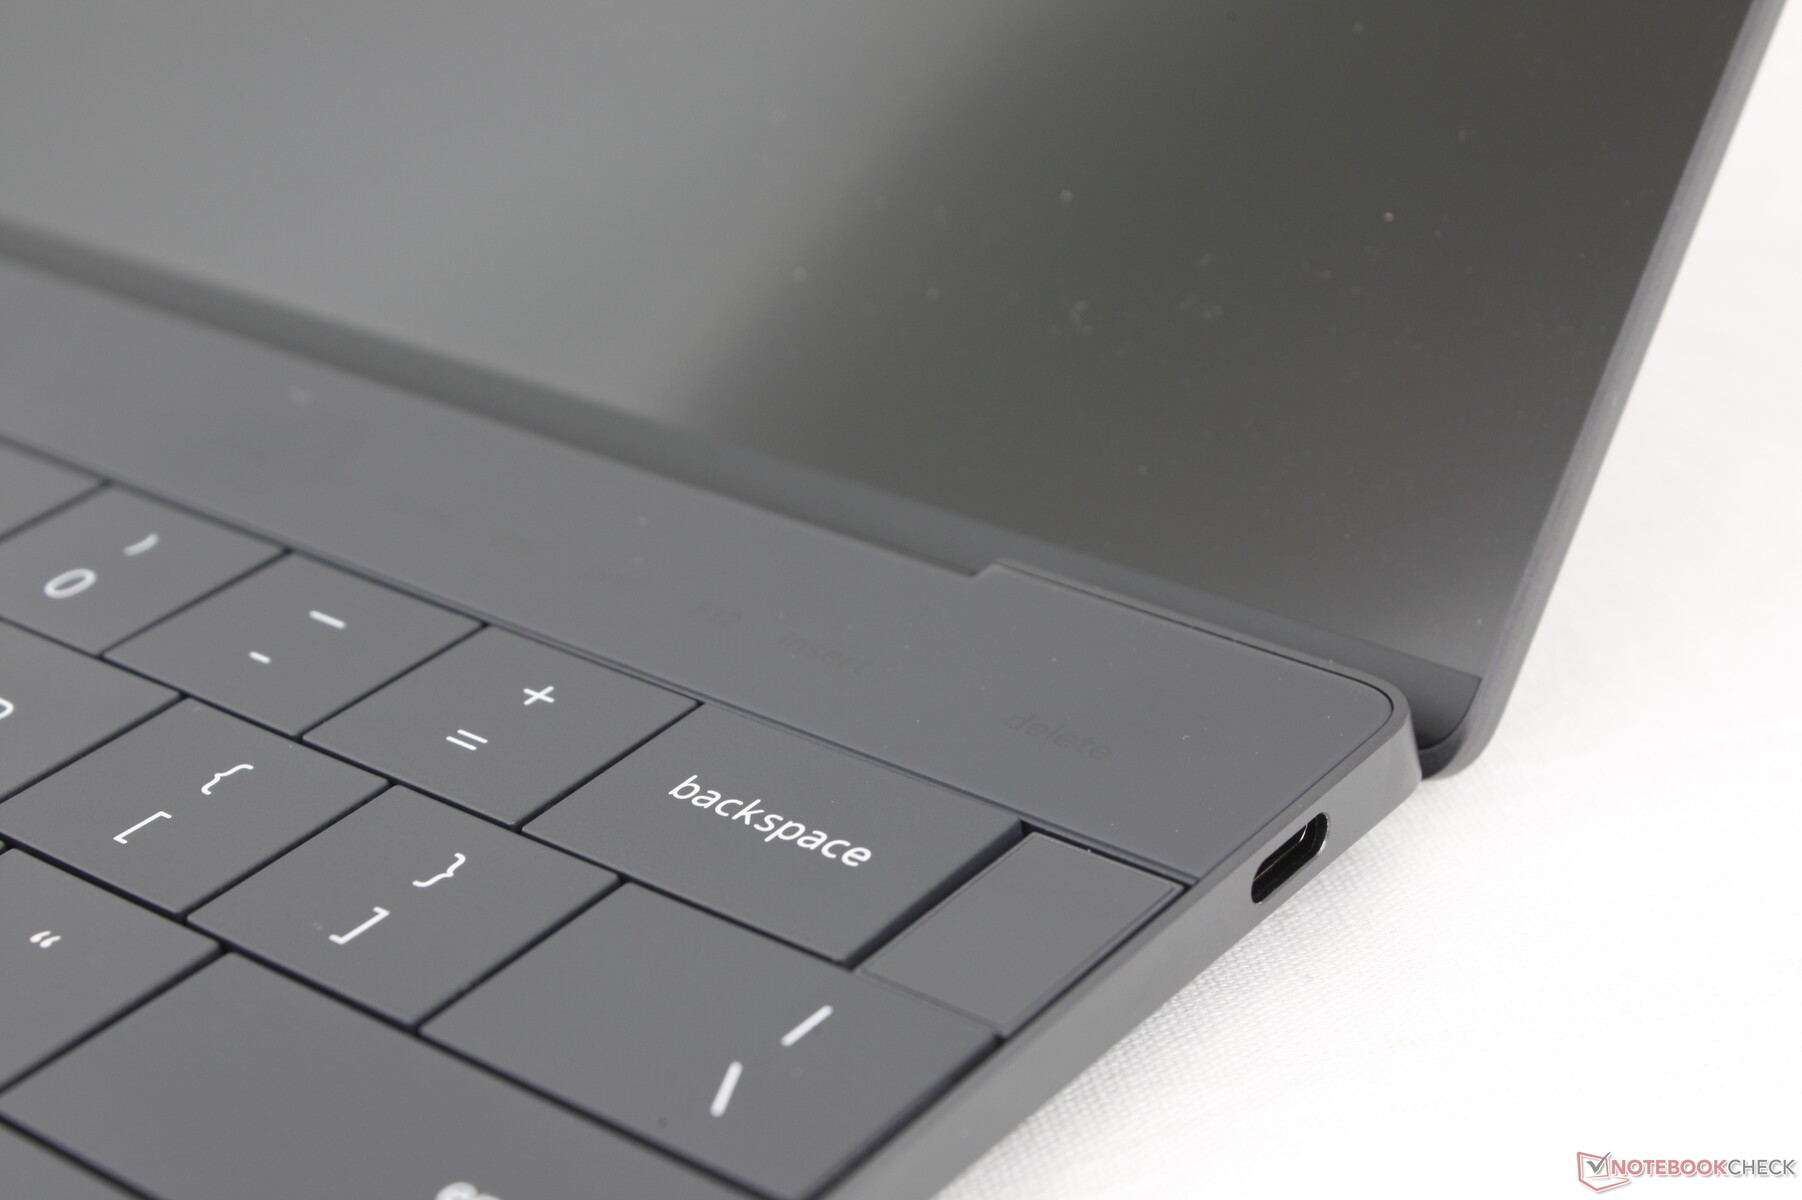
Здесь есть два порта USB-C 4.0, как и в Intel-версии XPS 13. Однако в этих портах отсутствует поддержка Thunderbolt, поэтому совместимость с eGPU не гарантируется. При попытке подключить наш Aorus RTX 2080 Ti Gaming Boxнапример, ноутбук Qualcomm не смог распознать eGPU, в то время как ПК с поддержкой Thunderbolt распознал бы его автоматически через Диспетчер устройств. Компания Qualcomm заявила, что любая поддержка и применимые драйверы будут зависеть от отдельных производителей eGPU, что не сулит ничего хорошего владельцам существующих eGPU.
Связь
Компания Dell заменила модуль BE200 в Intel XPS 13 на FastConnect 7800 в Qualcomm XPS 13. Модуль поддерживает подключение по Wi-Fi 7, что все еще редко встречается в большинстве семей. Тем не менее, производительность остается стабильной при подключении к нашему тестовому маршрутизатору Wi-Fi 6E AXE11000.
Веб-камера
В стандартную комплектацию модели входит та же 2 МП веб-камера, что и в XPS 13 9340, вместо 1 МП веб-камеры в оригинальном XPS 13 9320. Также встроен ИК-портрет для поддержки функции распознавания лиц Windows Hello. Однако крышка камеры или выключатель по-прежнему отсутствуют.


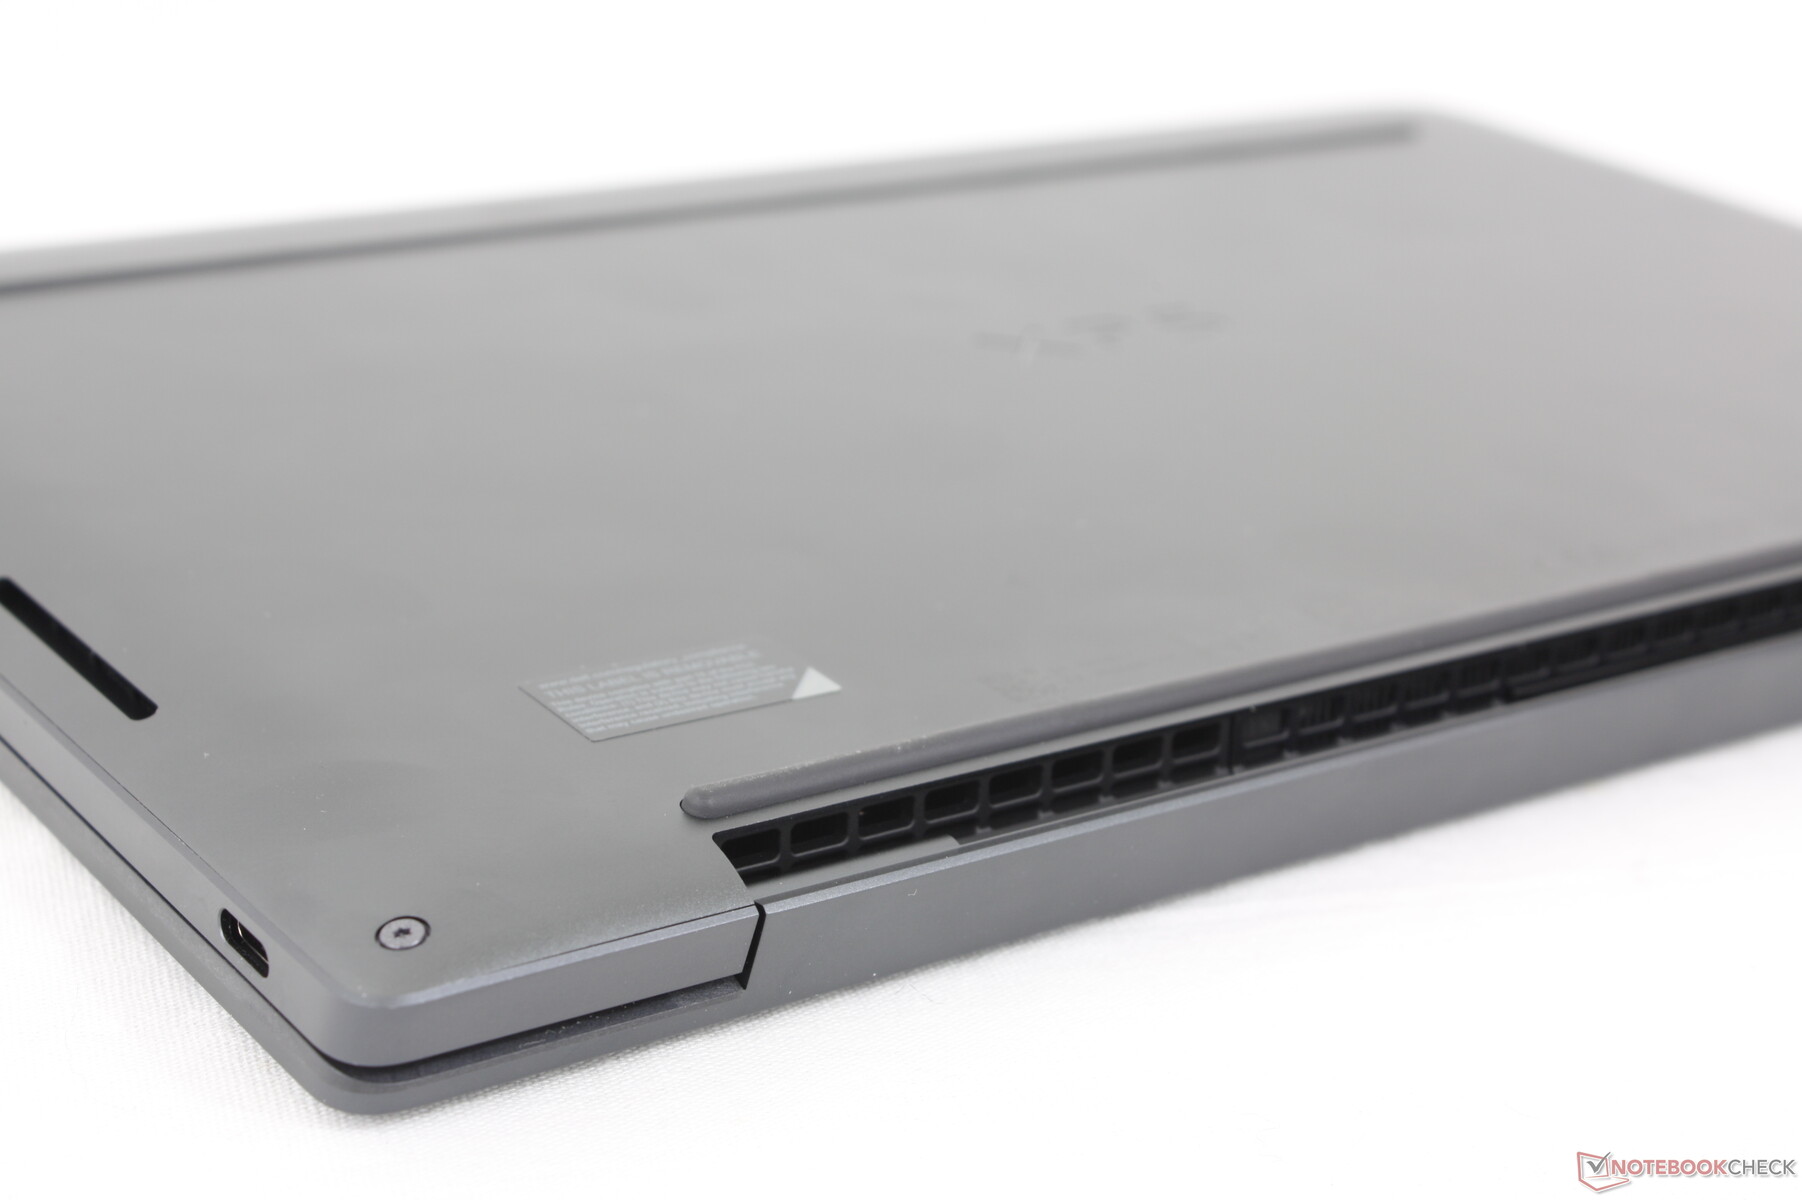
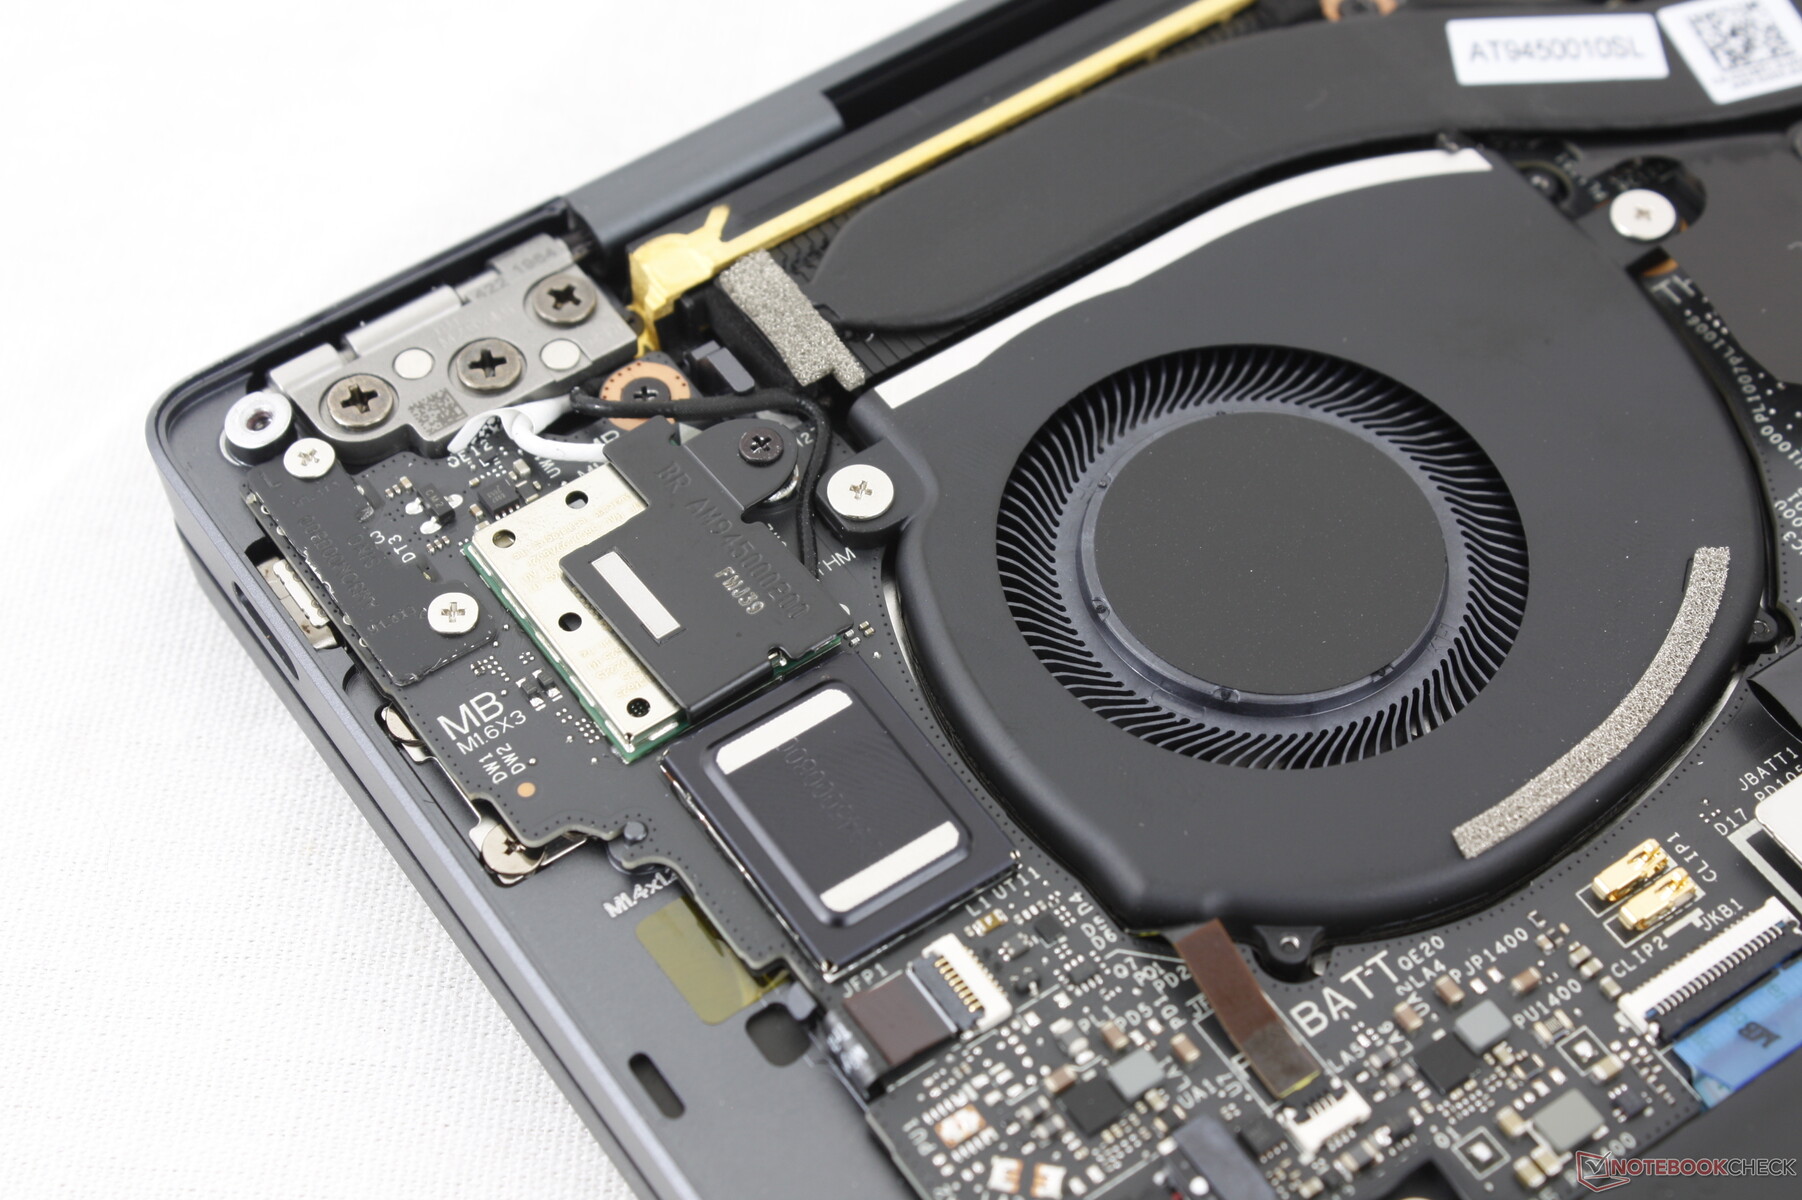
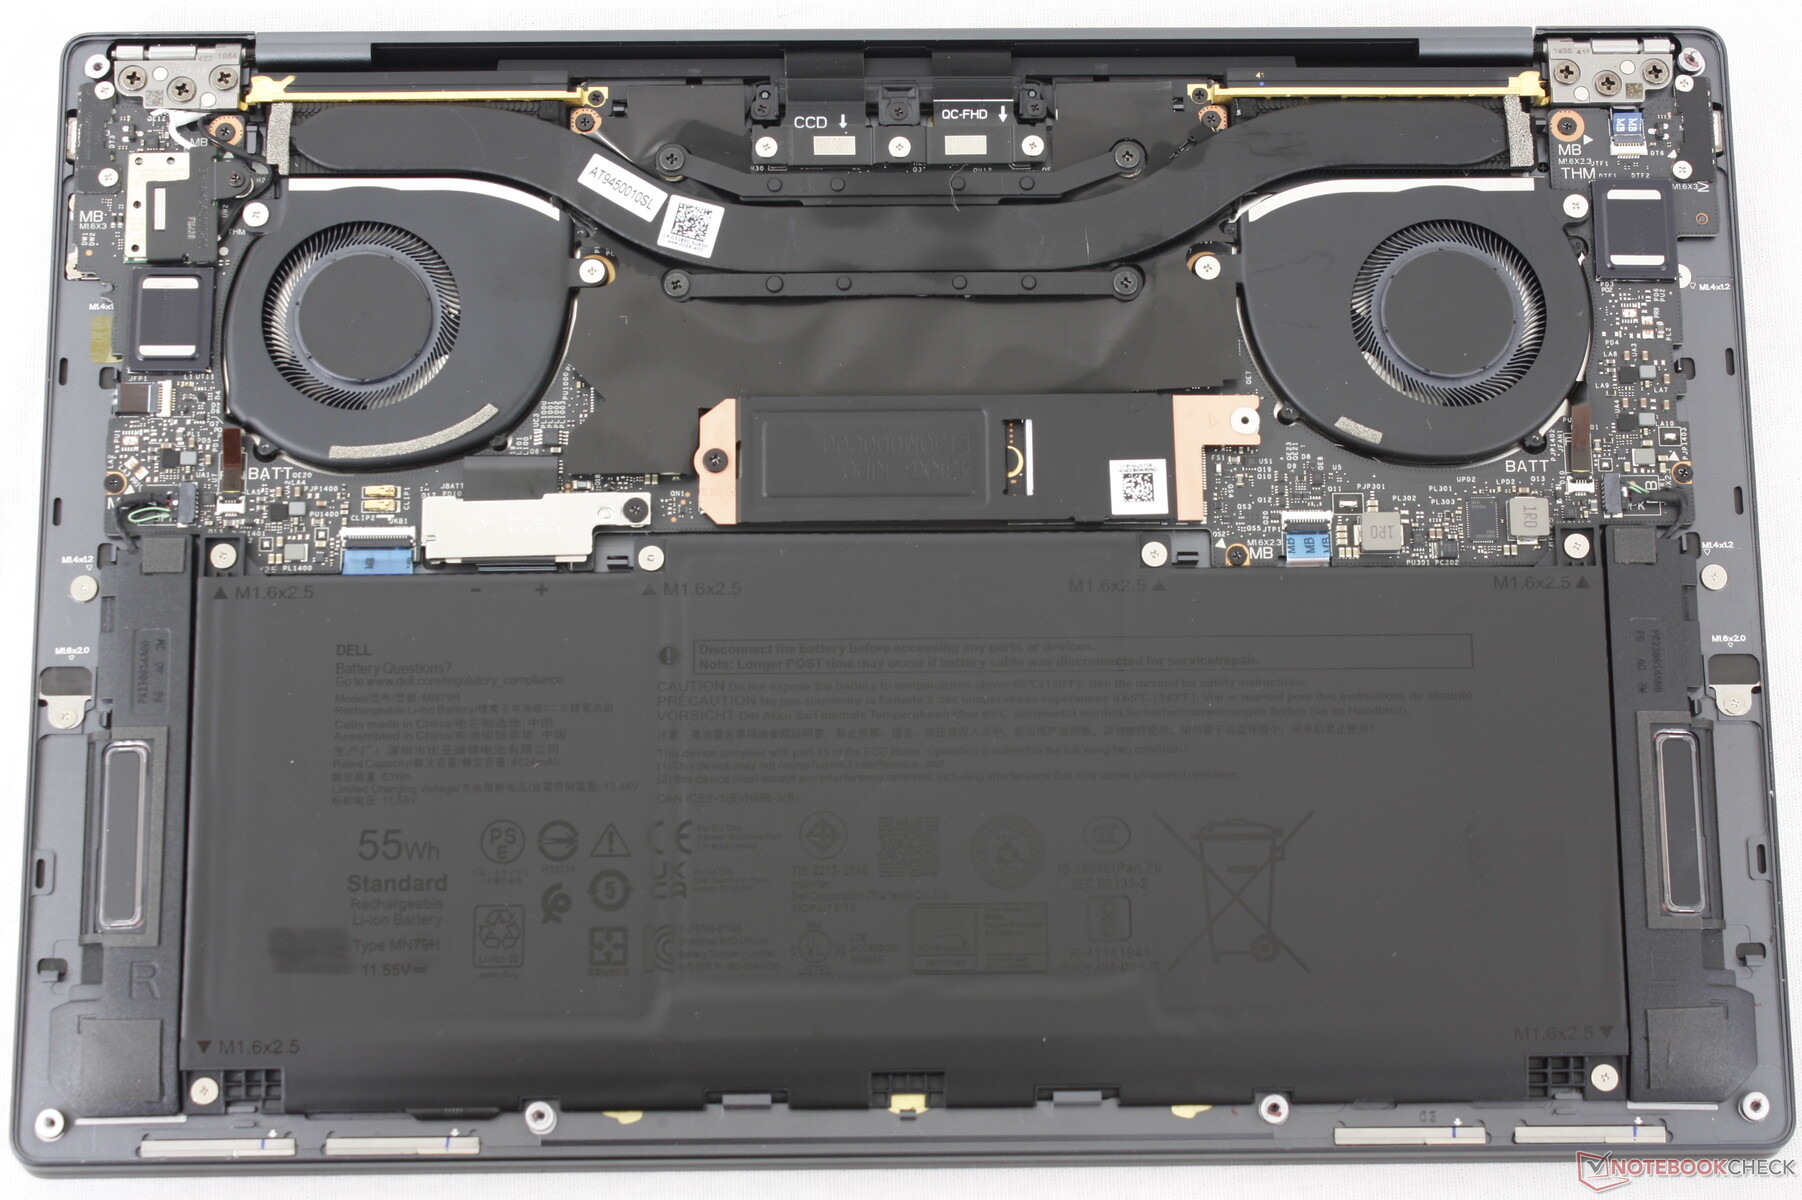
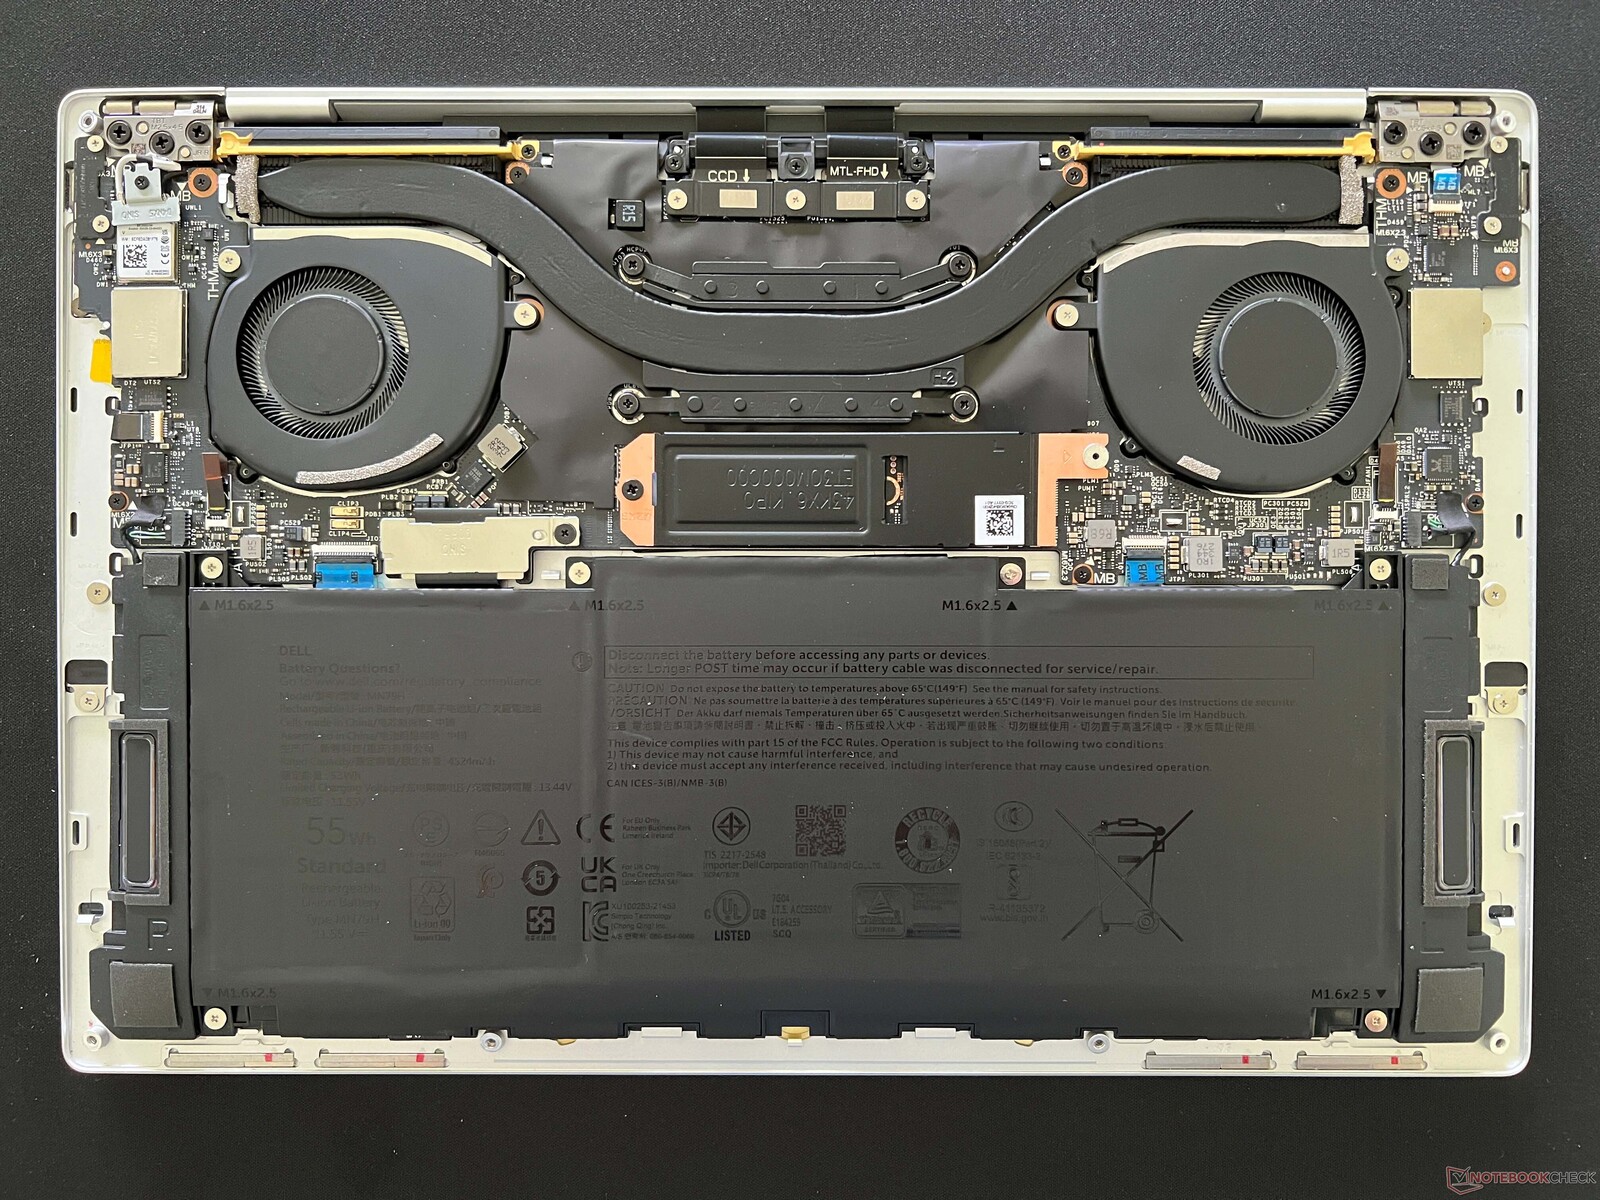
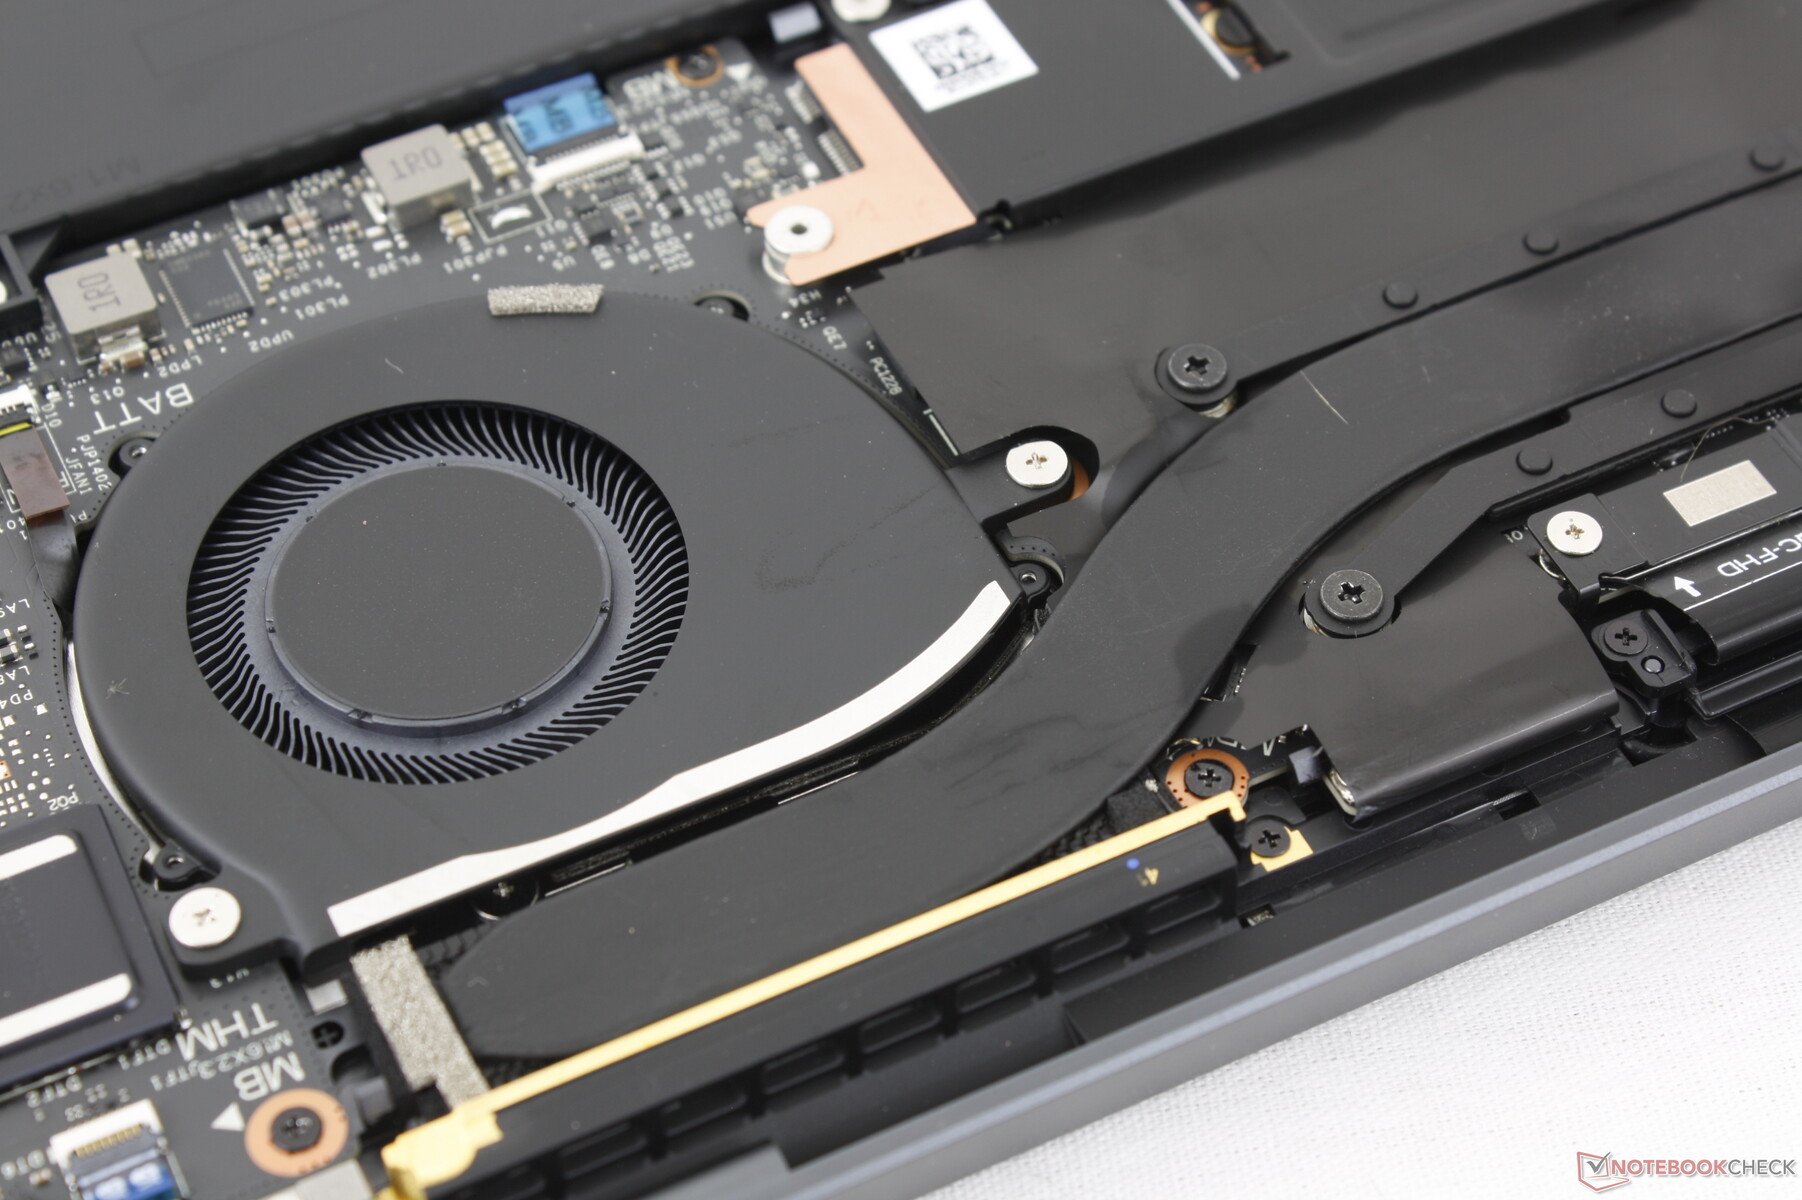
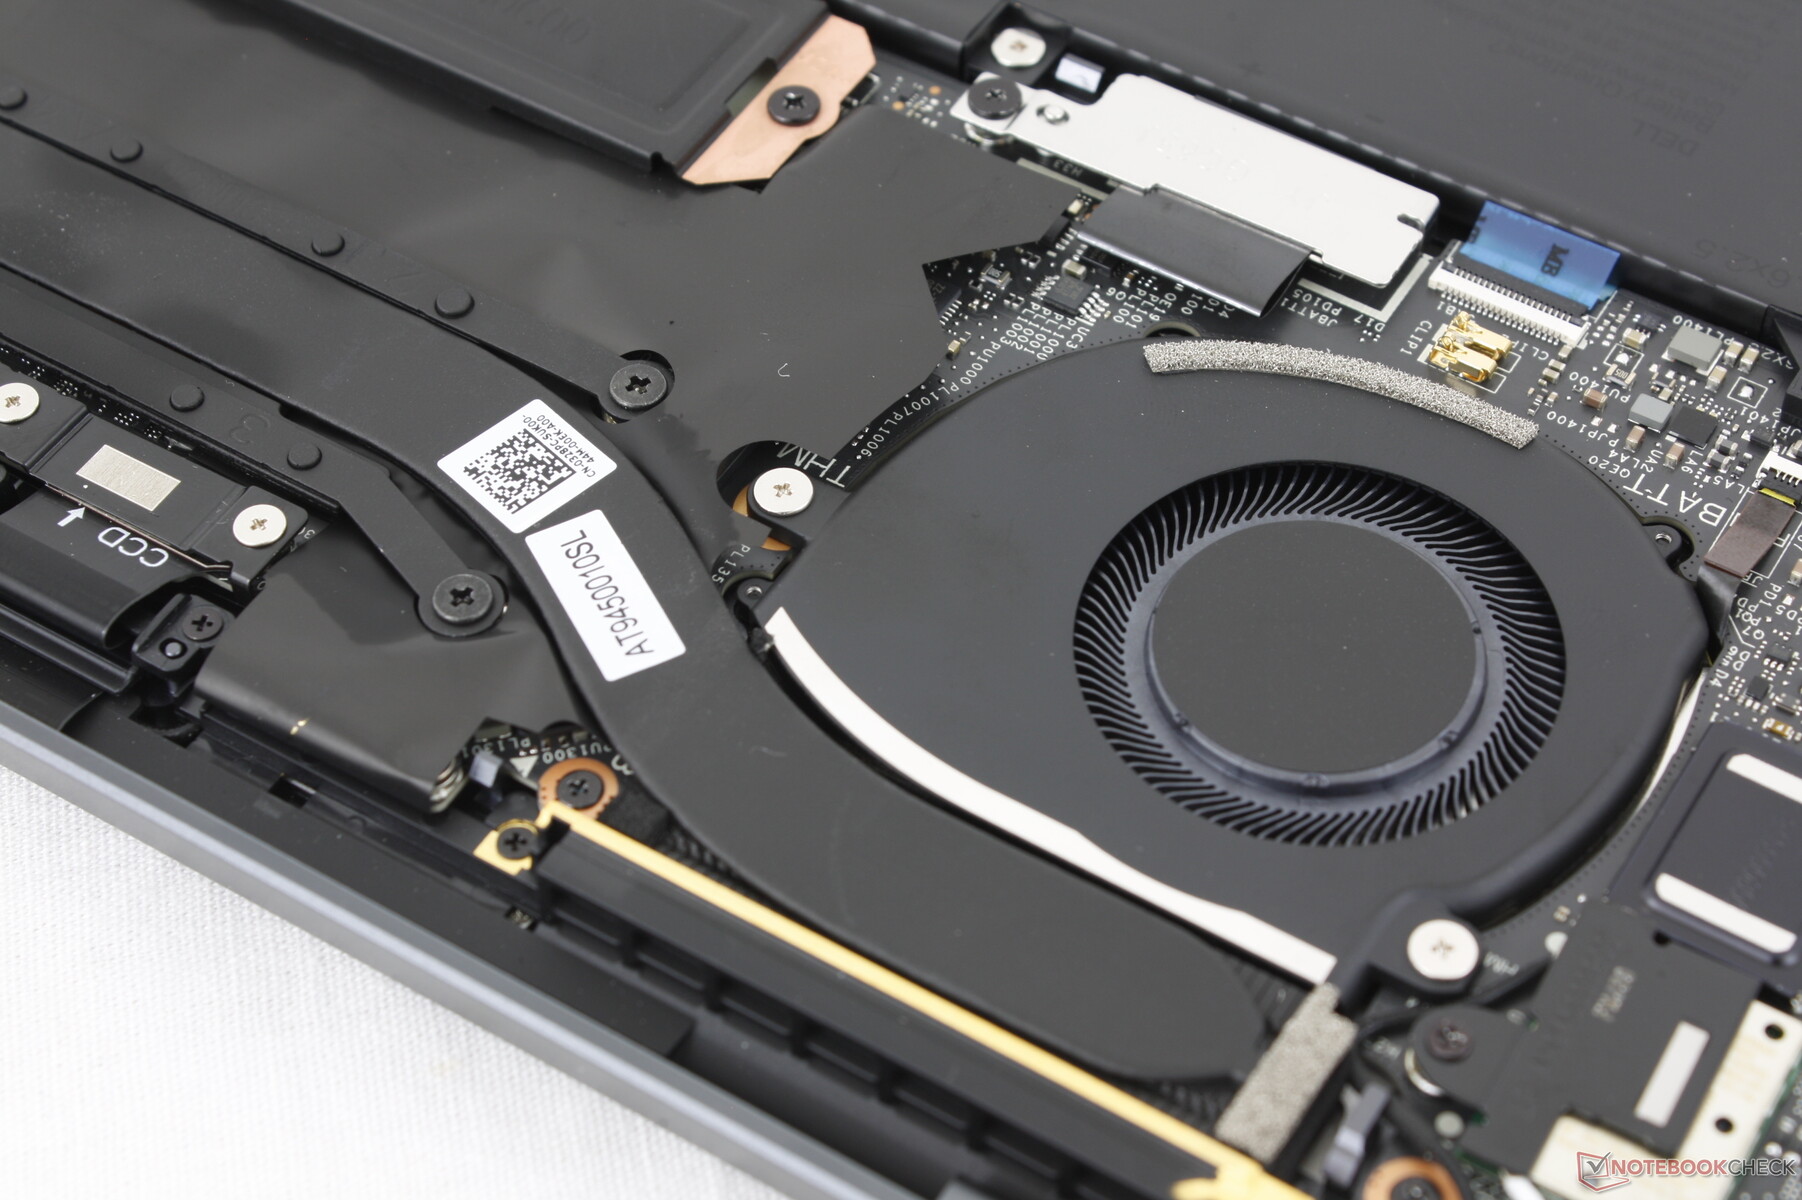
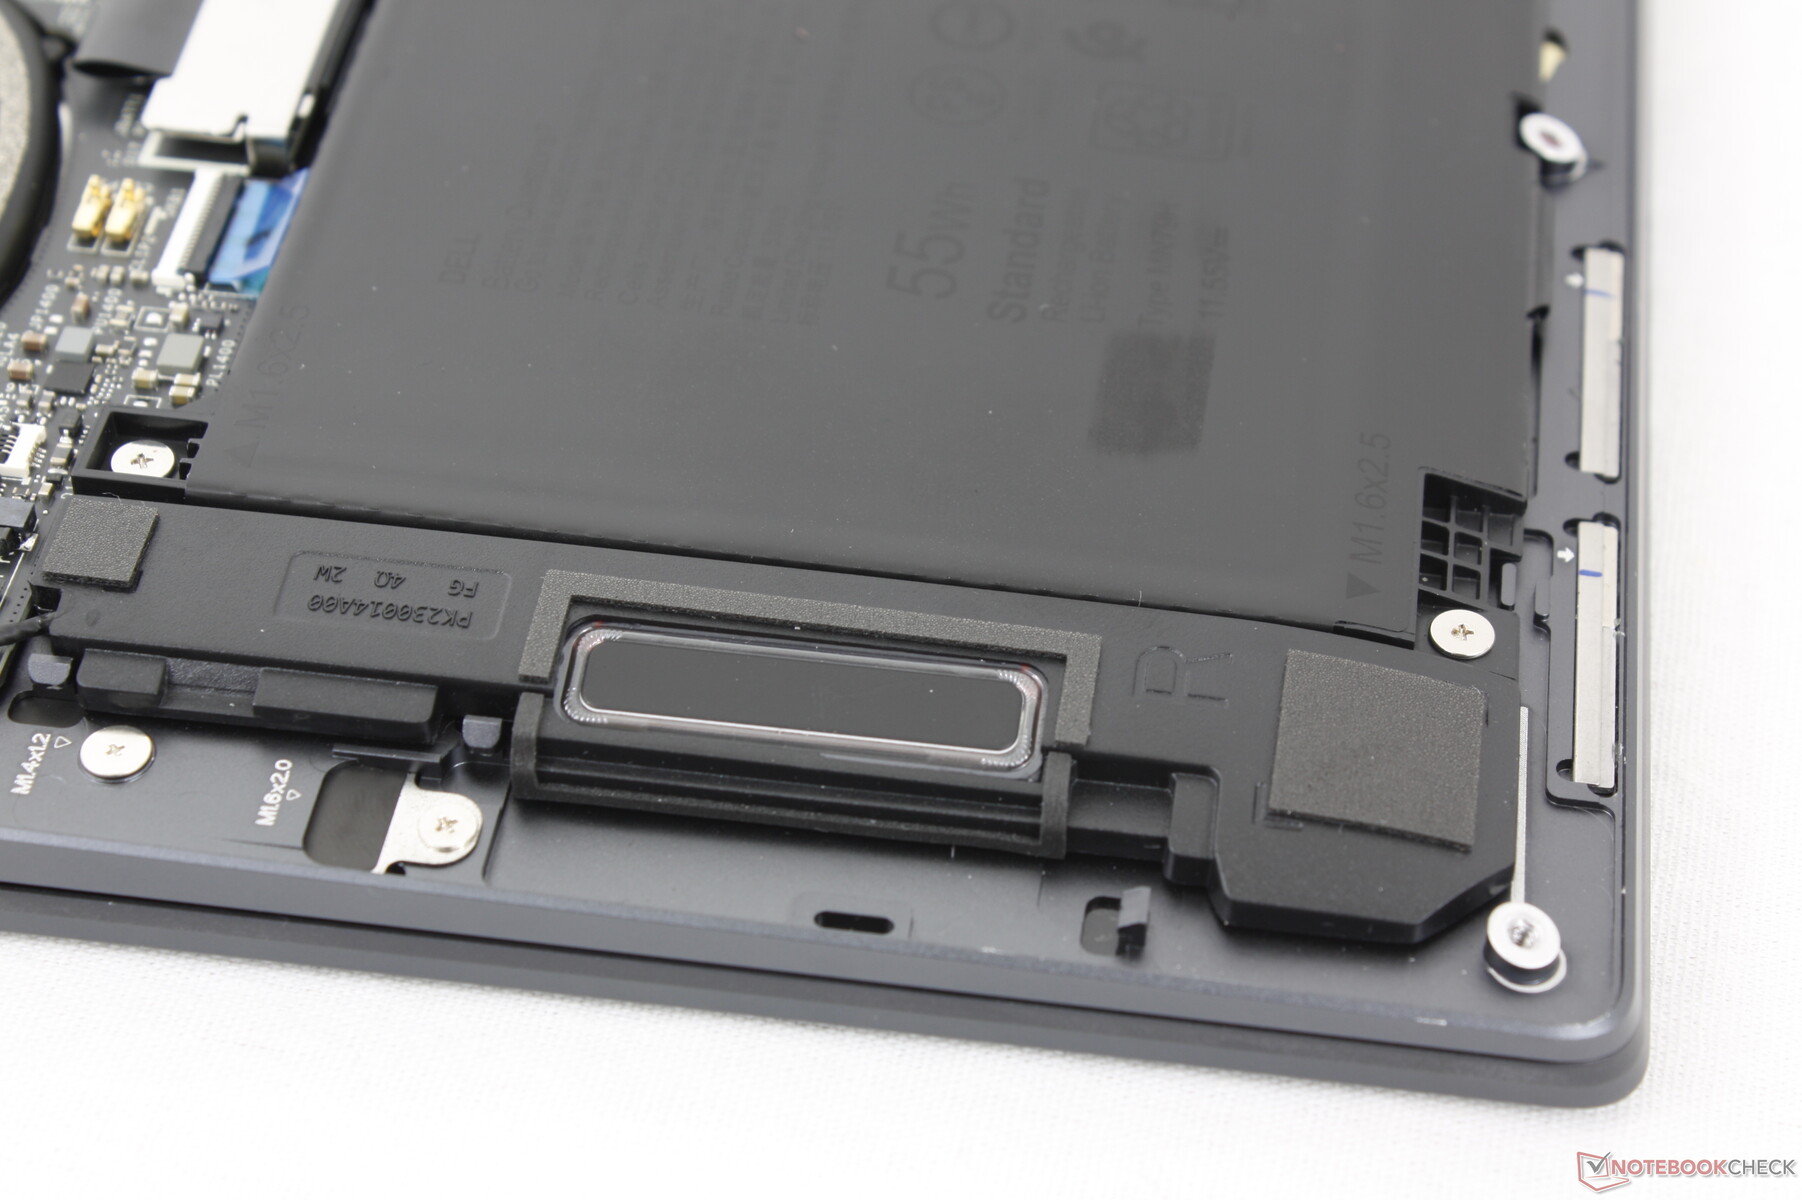
Обслуживание
Для снятия нижней панели требуется только отвертка Torx. В остальном модернизировать нечего, кроме единственного M.2 SSD, поскольку и оперативная память, и WLAN припаяны.
Экологичность
Упаковка состоит на 75% из переработанных материалов и на 25% из возобновляемых материалов, чтобы быть полностью пригодной для вторичной переработки. При изготовлении самого ноутбука было использовано не менее 20 процентов переработанного алюминия и стекла.
Аксессуары и гарантия
В коробке нет никаких дополнений, кроме сетевого адаптера и документов, в то время как модели XPS на базе Intel часто включают в себя переходник с USB-C на USB-A бесплатно.
При покупке в США действует обычная годовая ограниченная гарантия производителя.
Устройства ввода - Красивее, но удобнее ли?
Клавиатура
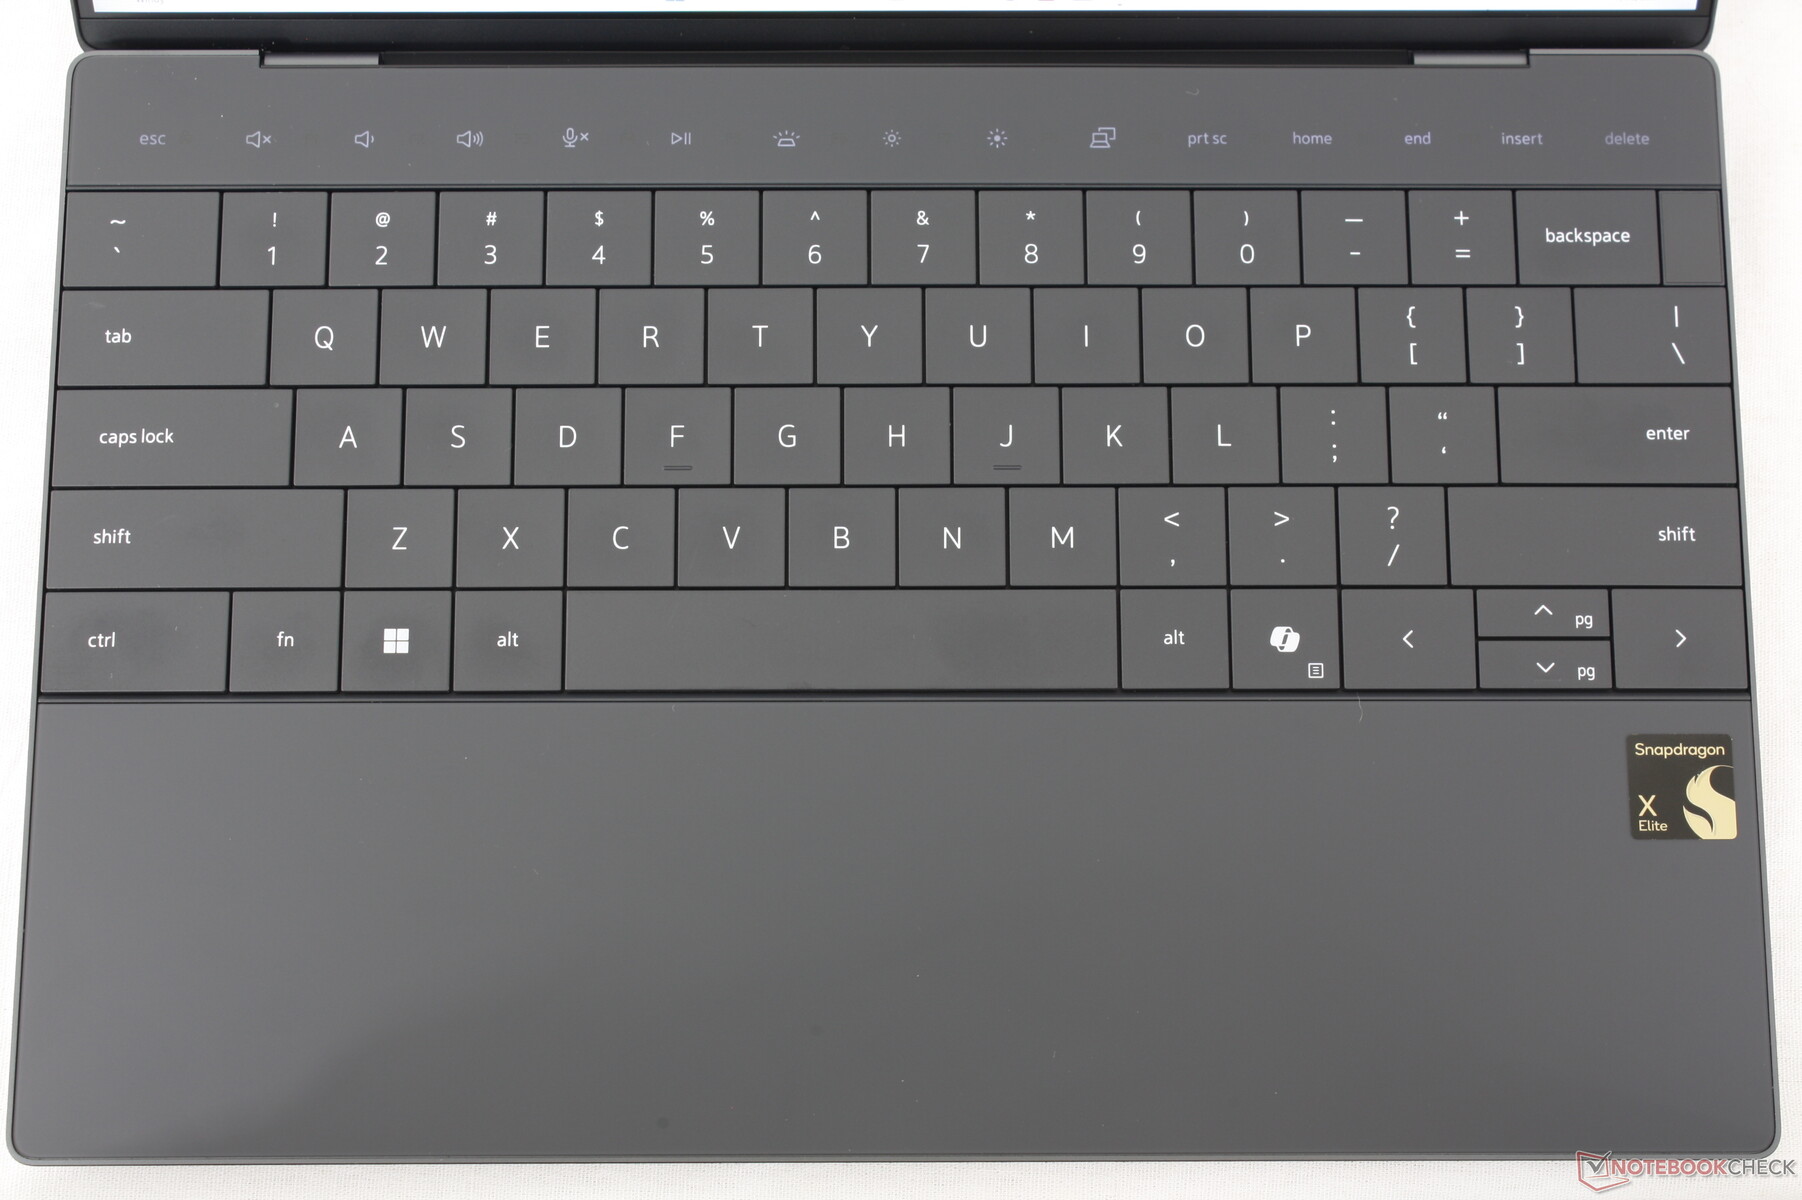
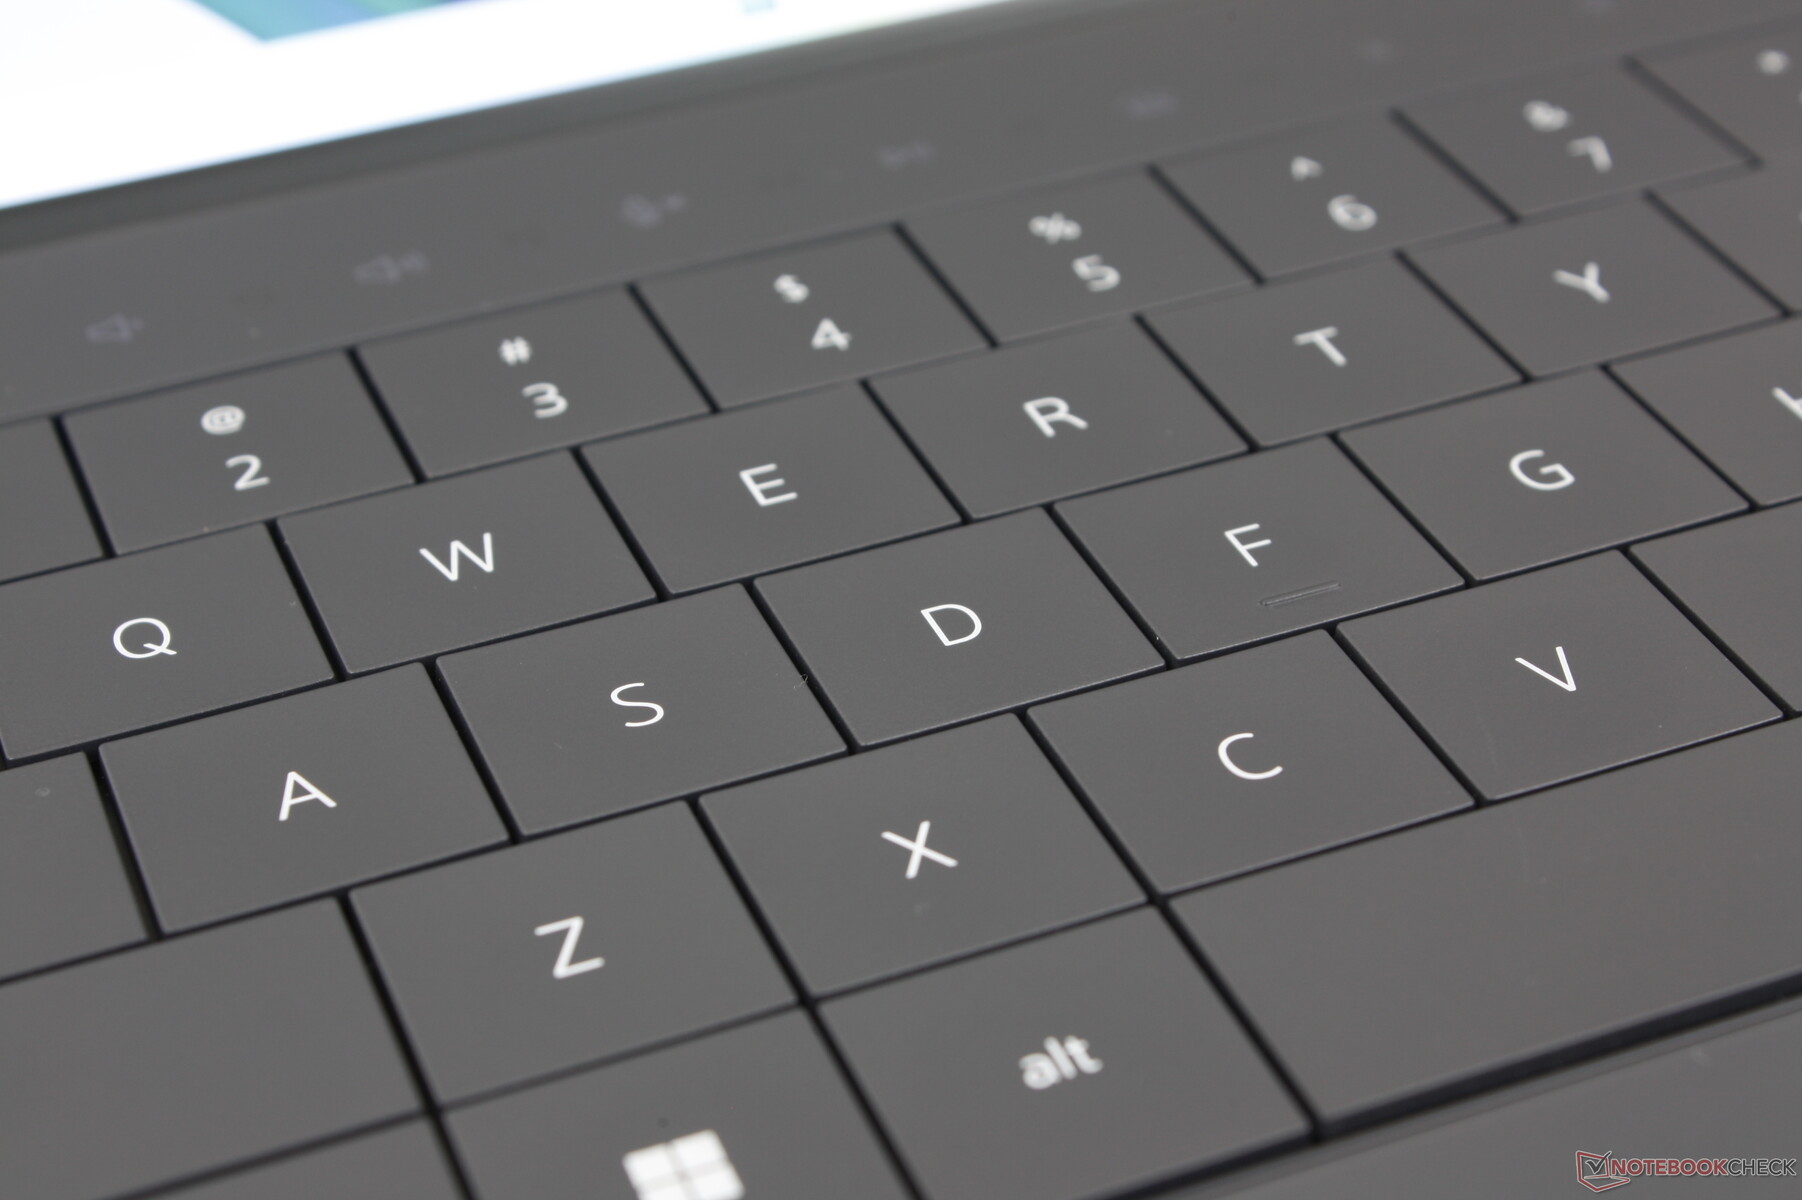
К клавиатуре с нулевым ходом клавиш нужно привыкнуть, если сравнивать ее с традиционными клавиатурами большинства других субноутбуков. Ход клавиш даже меньше, чем обычно, всего 1,0 мм, а обратная связь относительно мягкая, что делает набор текста более приятным. Разница между XPS 13 9345 и более упругими клавишами на HP Spectre x360 14 ощущается как день и ночь HP Spectre x360 14.
Функциональные клавиши с поддержкой сенсорного ввода также неоднозначны. Несколько лет назад Lenovo внедрила нечто подобное в свою серию ThinkPad, после чего быстро отказалась от этой идеи, и поэтому немного удивительно видеть, как они вновь появились у конкурирующего производителя. Основная проблема заключается в том, что клавиши чувствительны даже к малейшим прикосновениям, что может привести к случайному вводу.
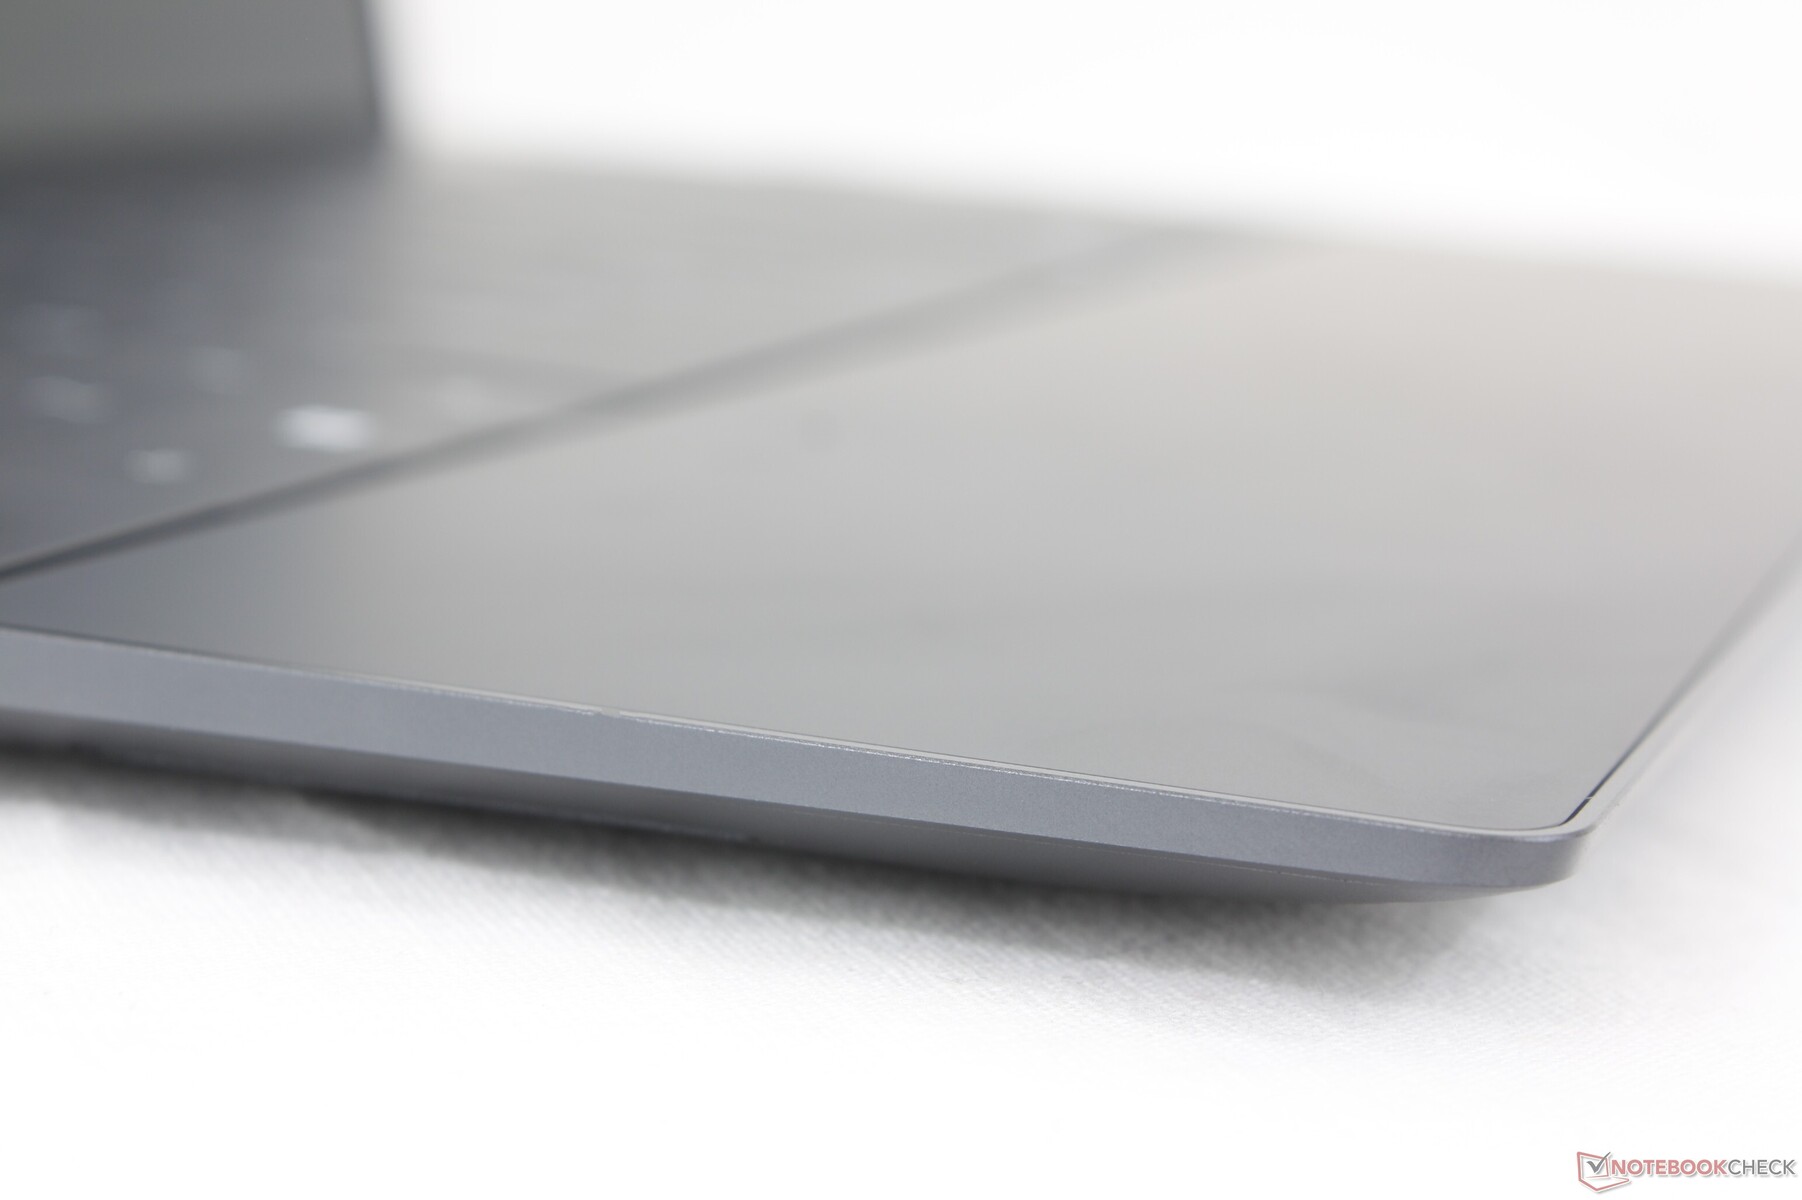
Тачпад
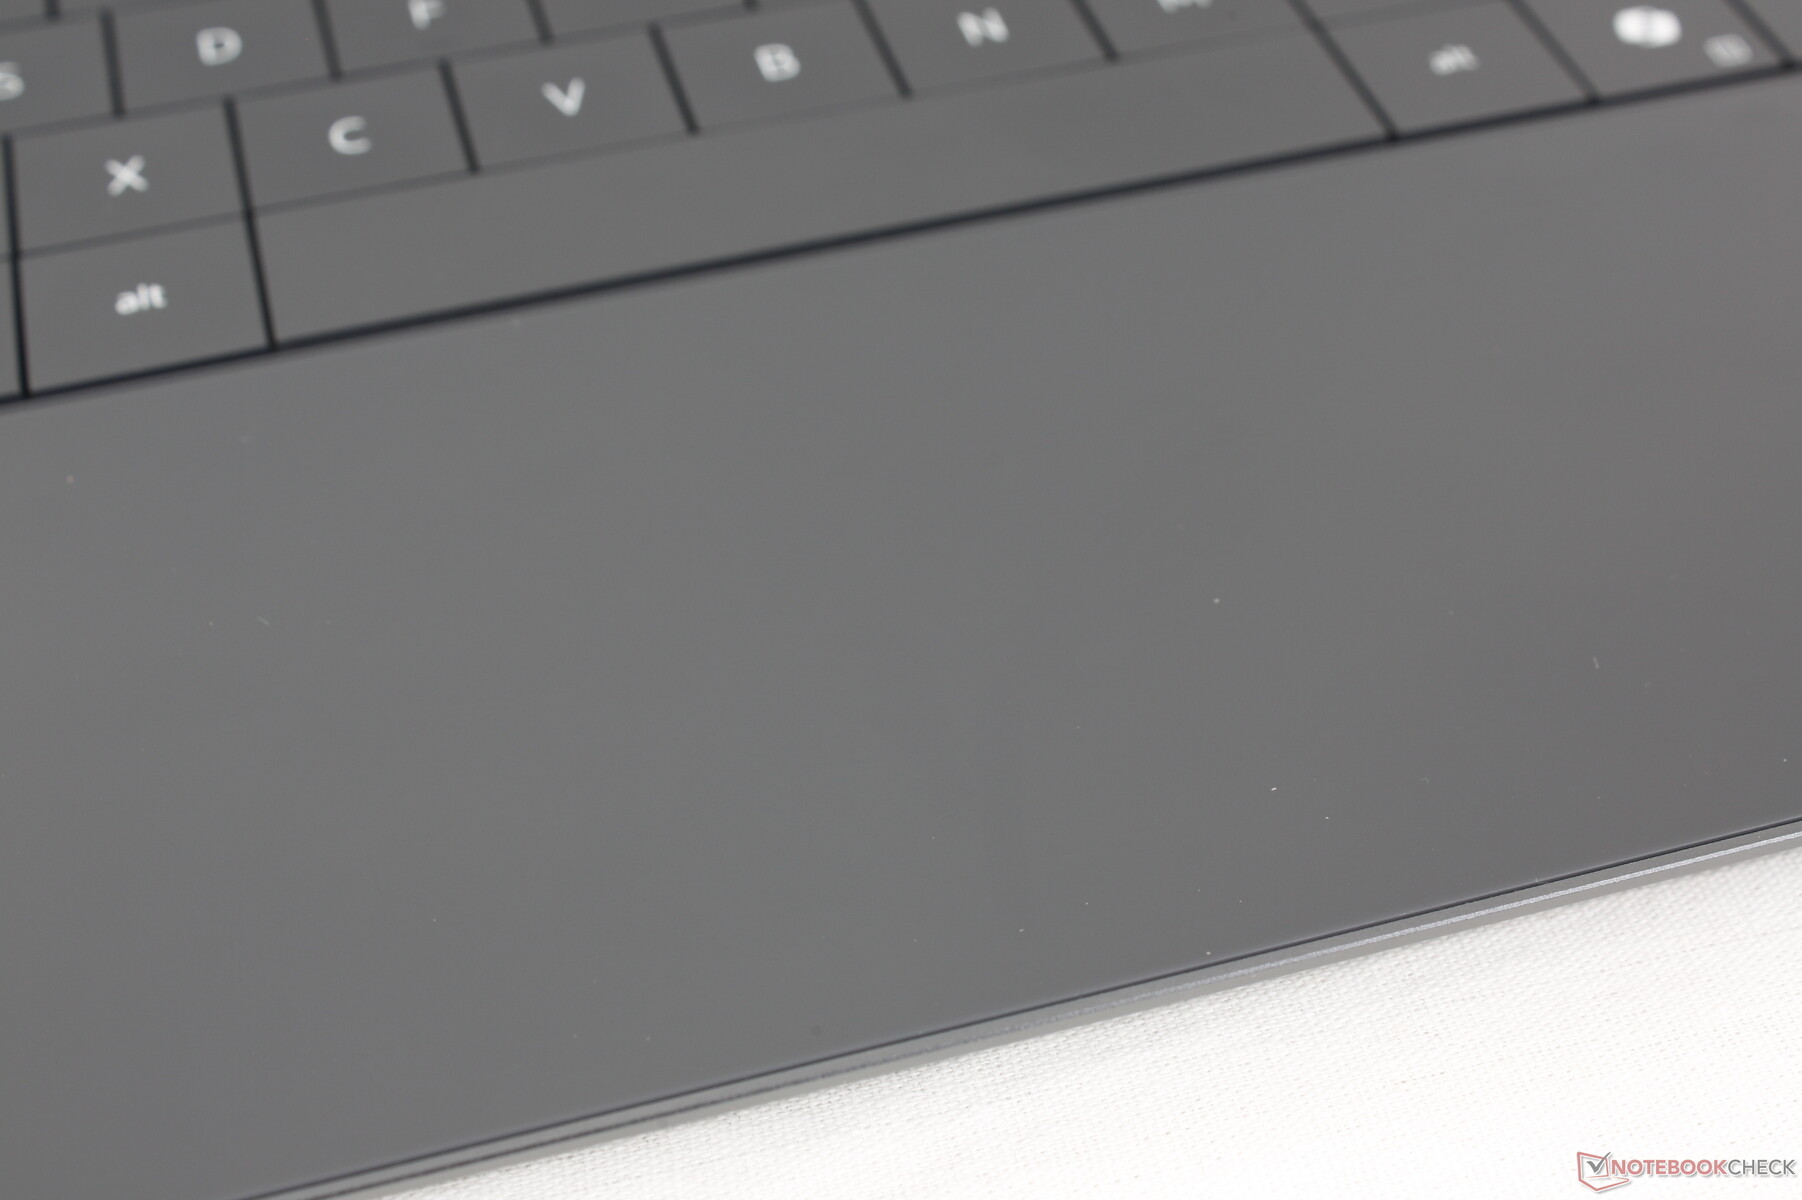
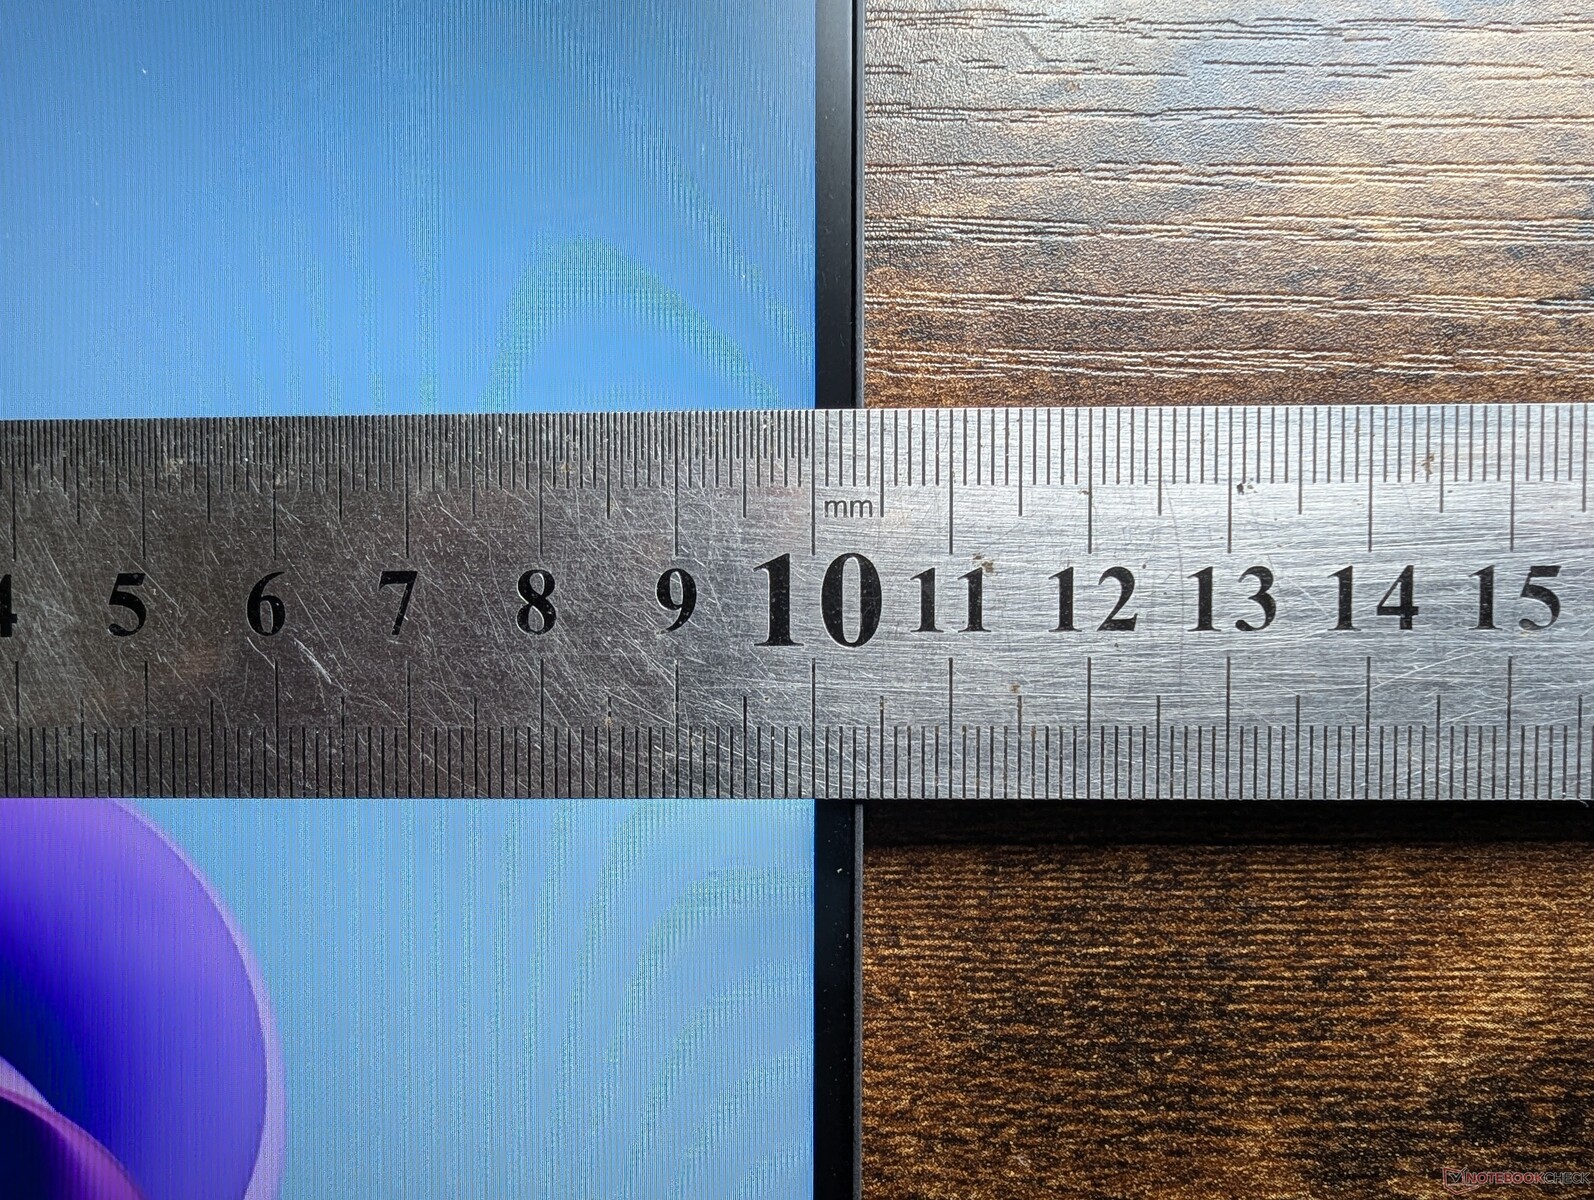
Невидимый кликпад XPS стал печально известен своей недружелюбностью к пользователю, и эта тенденция продолжается в модели с Snapdragon. Хотя полезная площадь поверхности довольно велика для 13-дюймового форм-фактора и составляет примерно 11,5 x 7,5 см, щелчки не приносят удовлетворения из-за слабой обратной связи. Хуже того, сила, необходимая для нажатия, намного меньше, чем на большинстве других ноутбуков, что приводит к множеству случайных нажатий и перетаскиваний, когда Вы просто пытаетесь переместить курсор. Мы надеялись на некоторые улучшения в этом отношении после двух лет работы с этим дизайном, но, к сожалению, это не так.

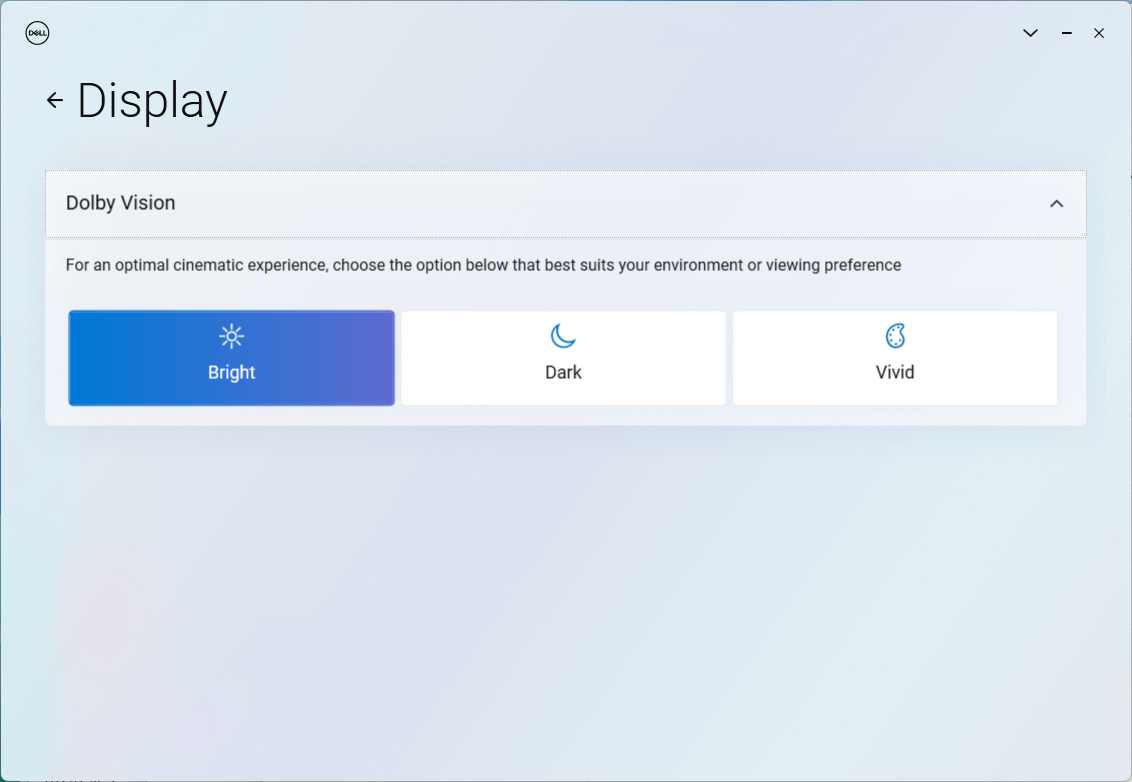
Дисплей
Доступны три варианта дисплея. Наша обзорная конфигурация поставляется с выделенным жирным шрифтом вариантом.
- 1920 x 1200, IPS, 120 Гц, несенсорный, матовый
- 2560 x 1600, IPS, 120 Гц, сенсорный, глянцевый
- 2880 x 1800, OLED, 60 Гц, сенсорный, глянцевый
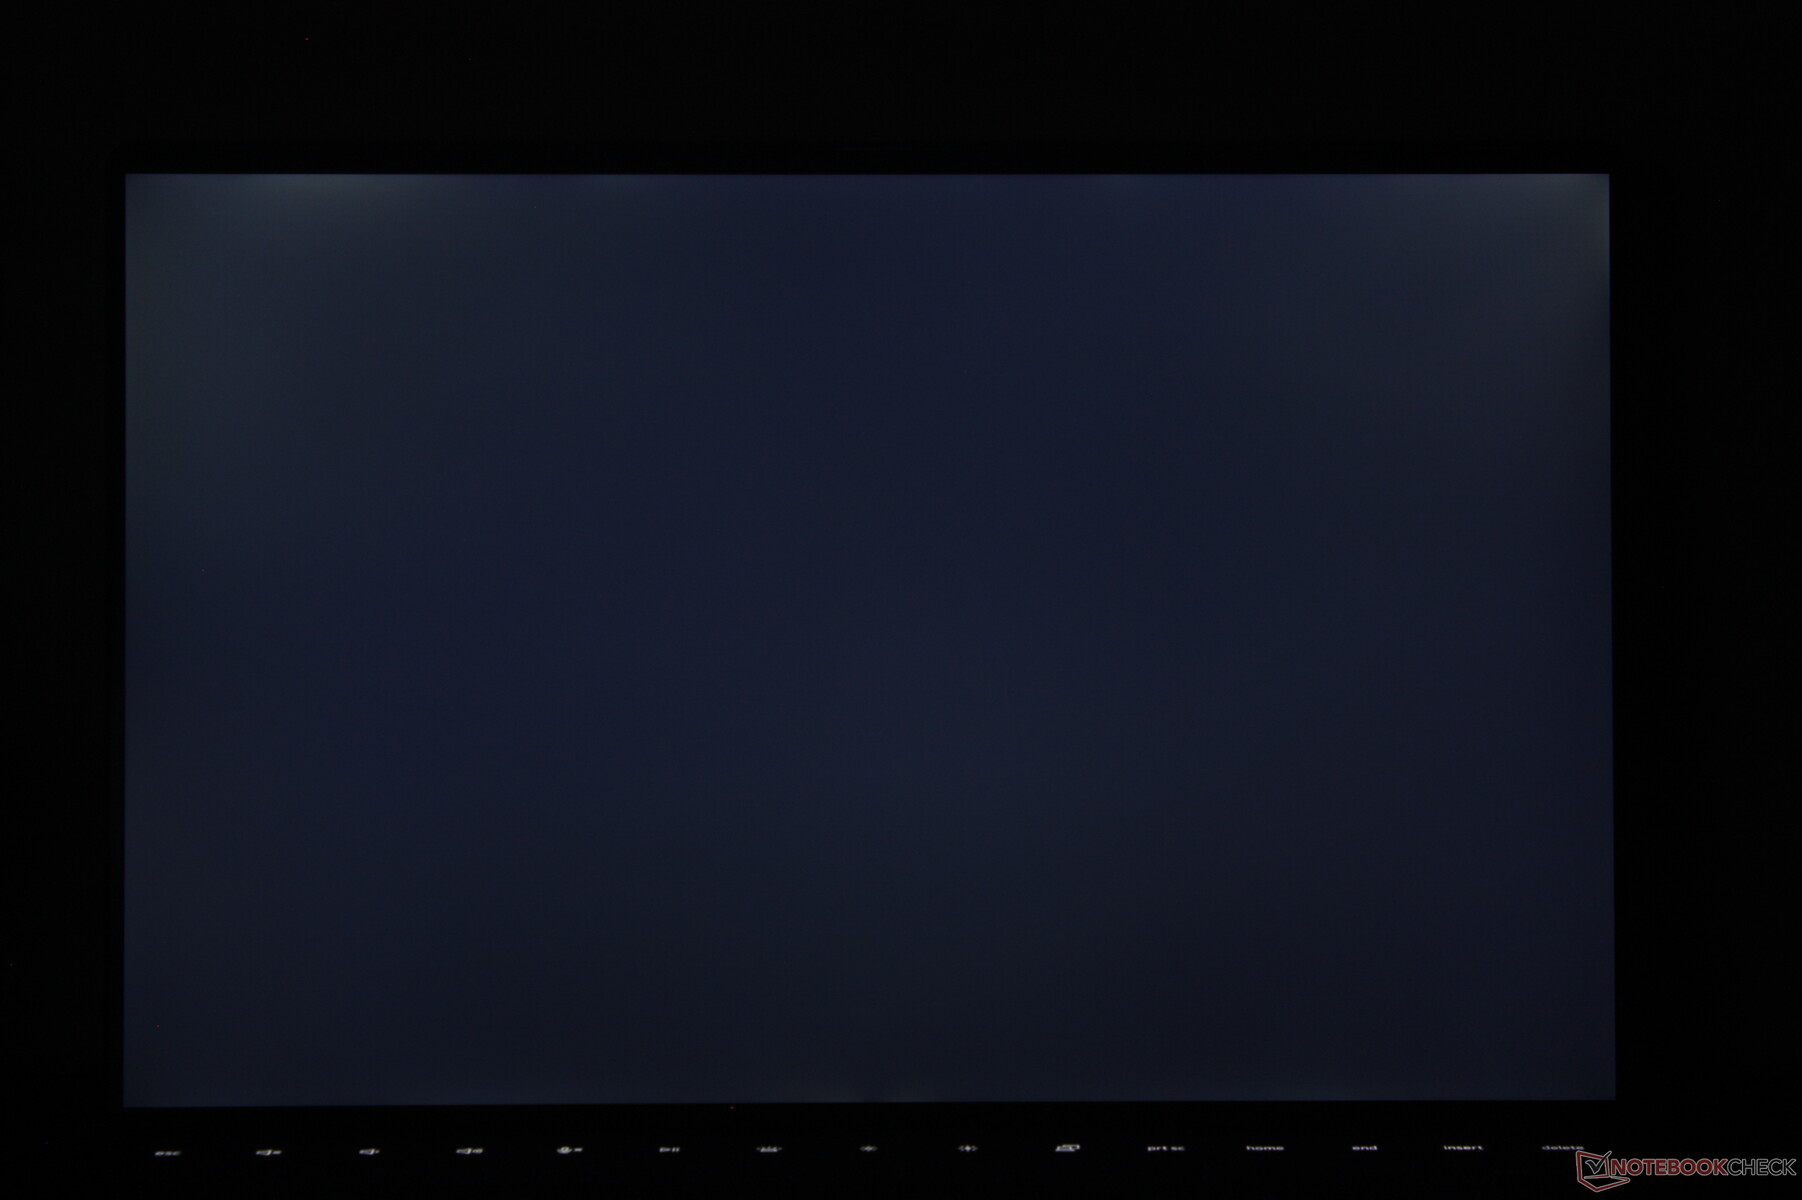
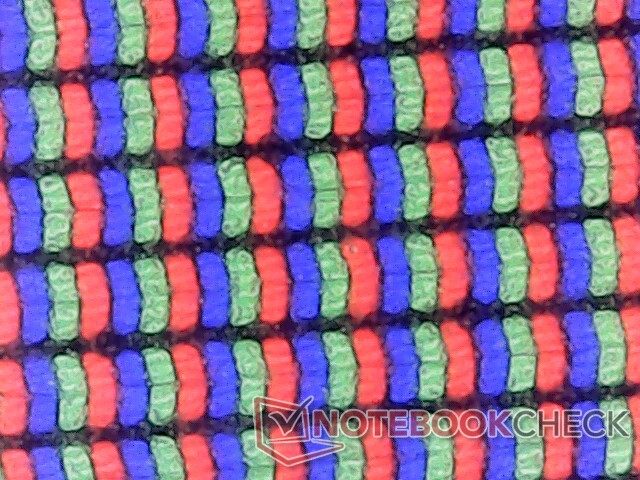
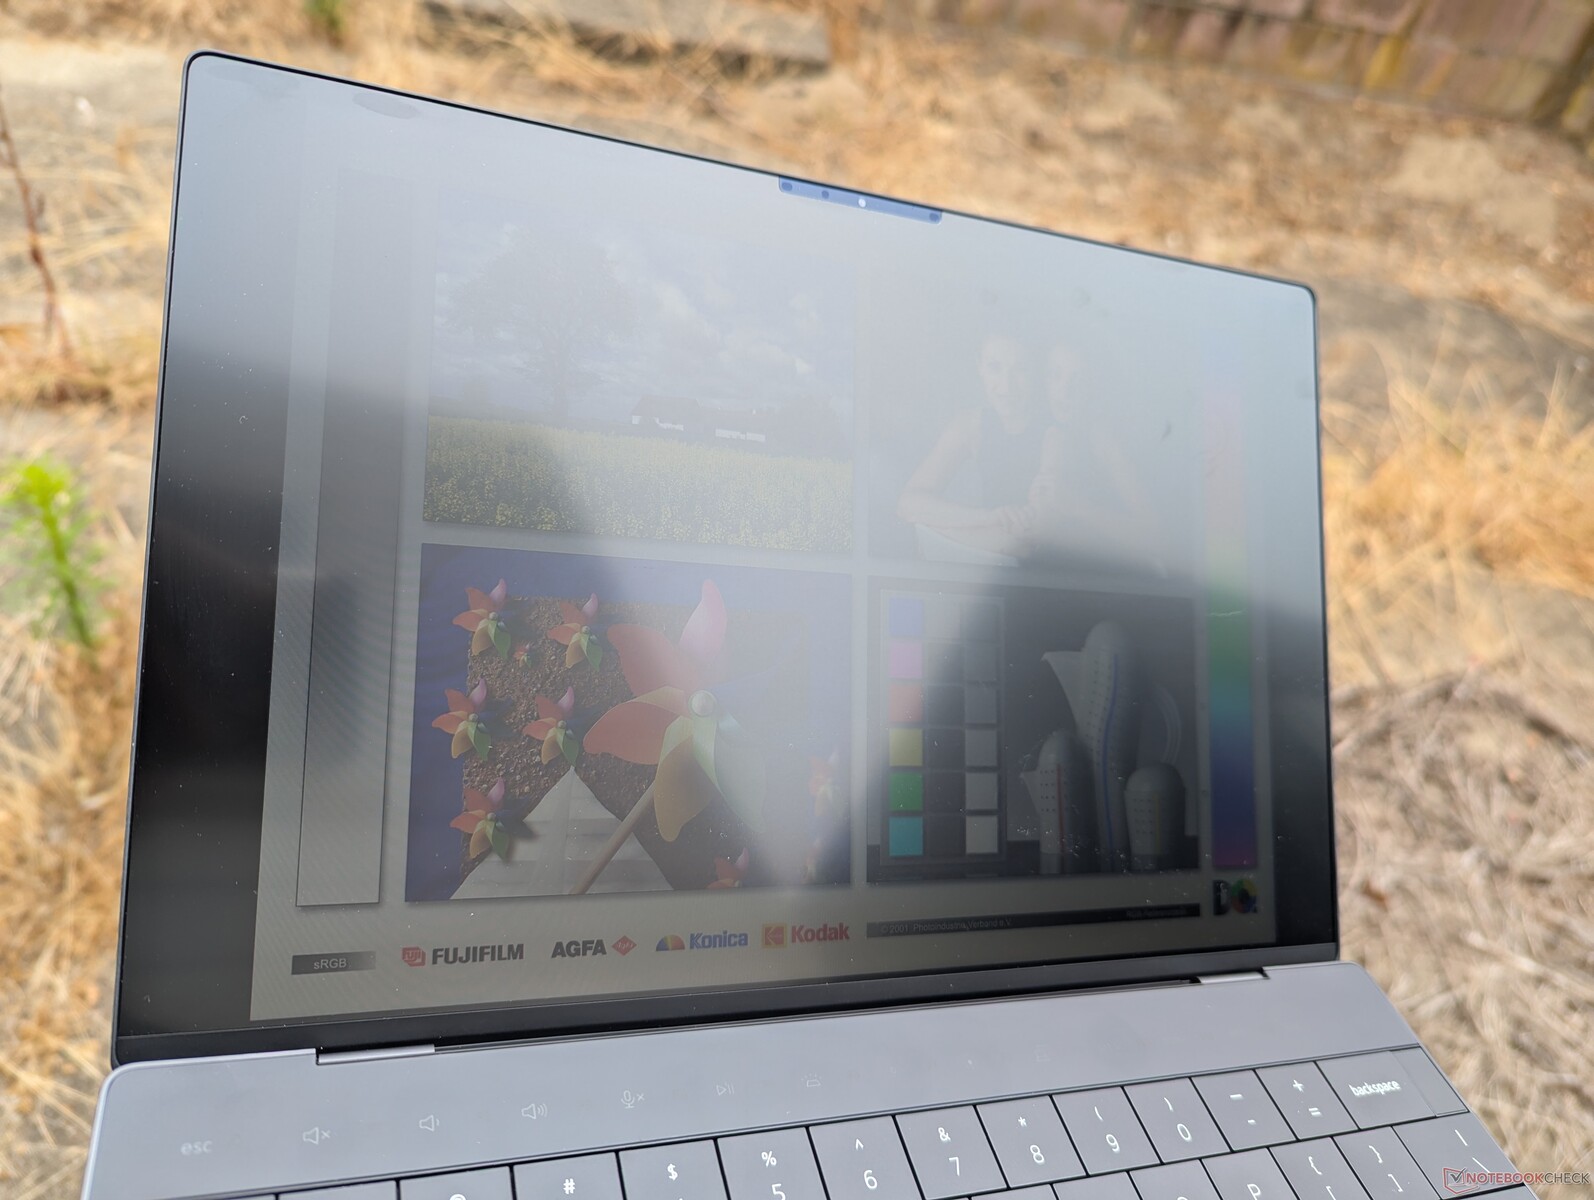
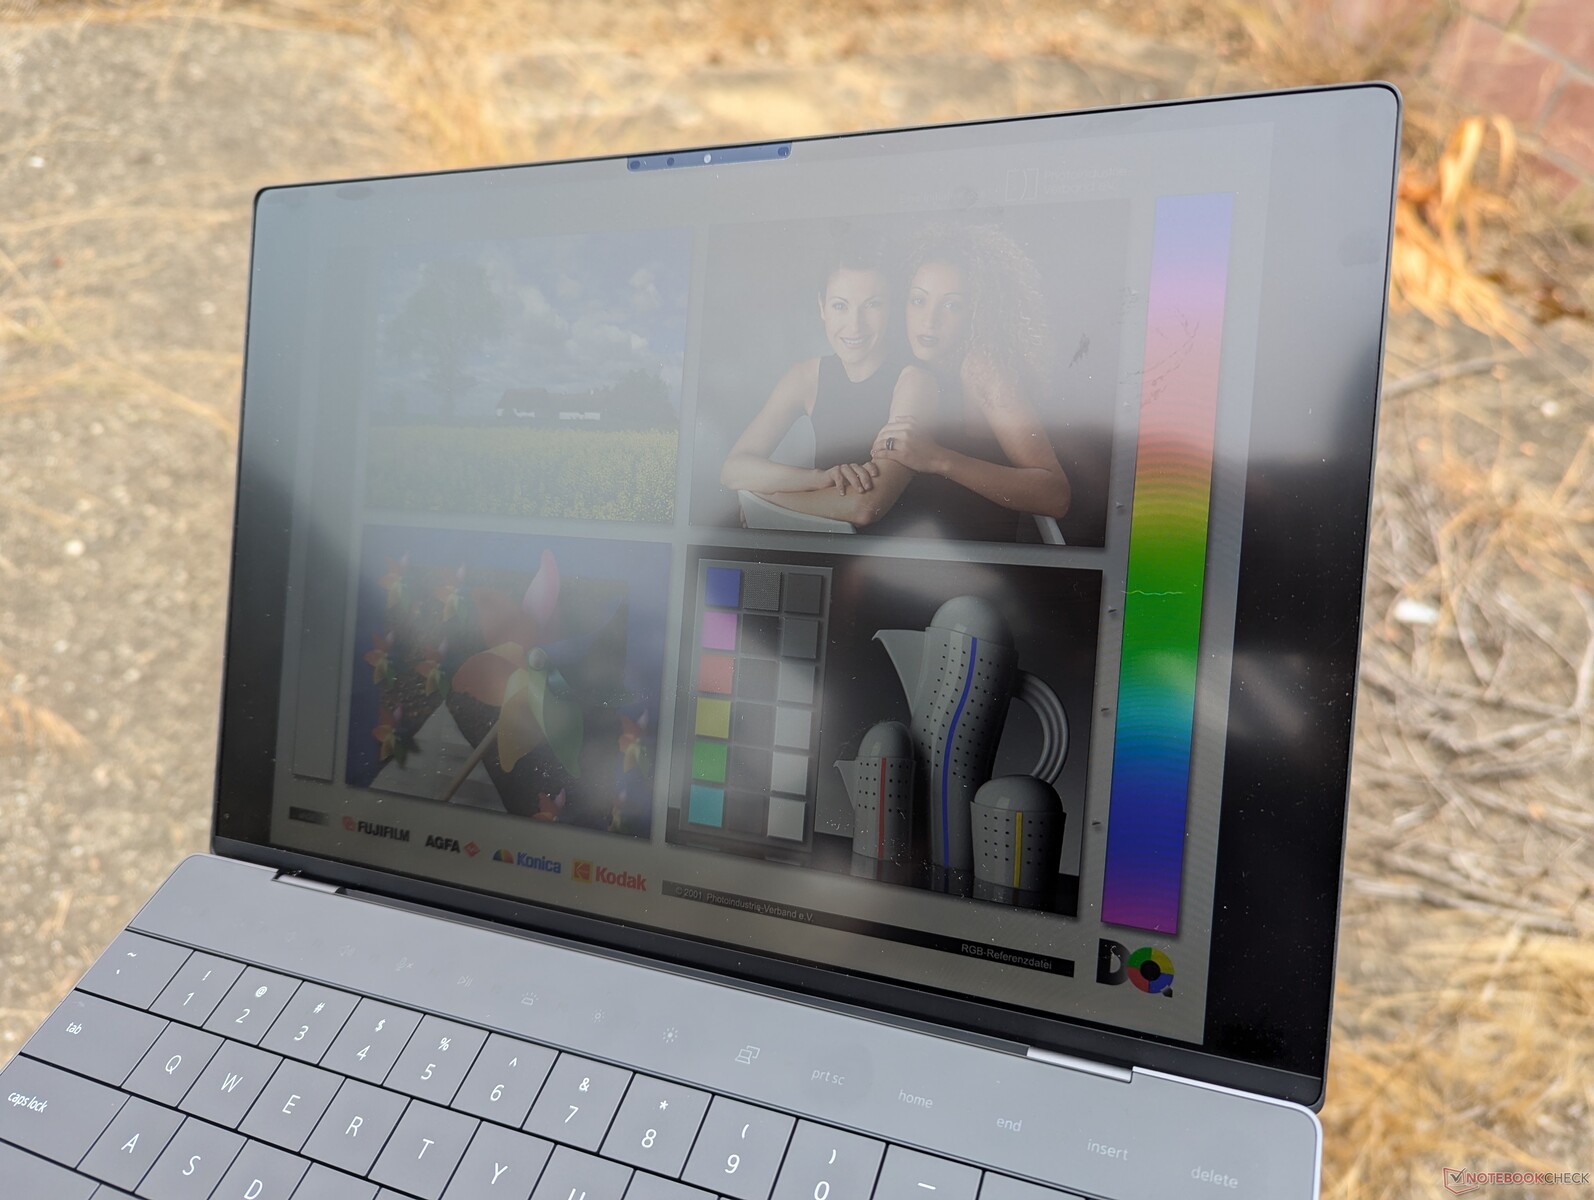
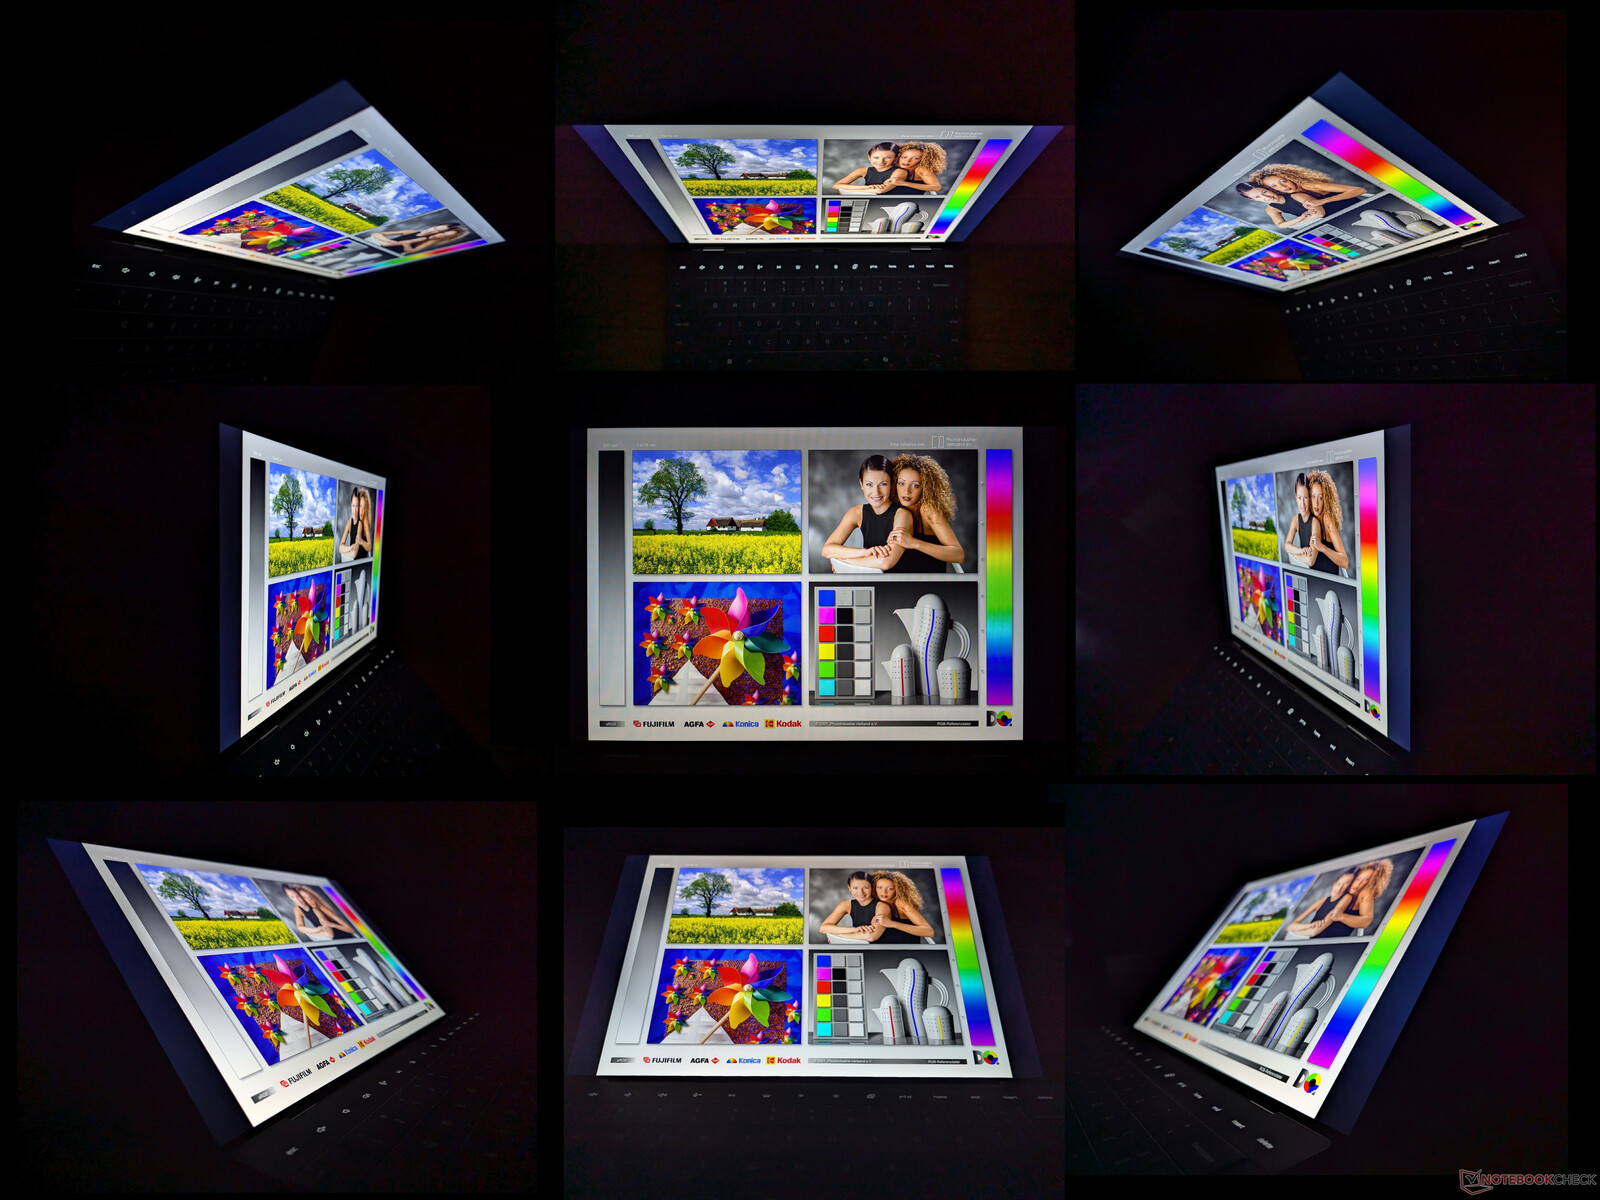
Все указывает на то, что наша панель с частотой 120 Гц - это та же самая панель, которая используется в XPS 13 на базе Intel. Все, начиная с поддержки VRR до 30 Гц, адекватного времени отклика и максимальной яркости в 500 нит, аналогично характеристикам нашего недавнего тестового устройства Core Ultra 7 XPS 13. Наиболее примечательным является высокий коэффициент контрастности - почти 2000:1 по сравнению с 1000:1 у большинства IPS-панелей, установленных на других ноутбуках. Дисплеи в моделях XPS всегда были одними из лучших в классе, поэтому даже самый дешевый вариант IPS все равно выглядит фантастически.
Цветовой охват ограничен >95% sRGB, если используется базовый вариант, а цвета DCI-P3 предназначены для более дорогих 1600p IPS и 1800p OLED панелей. Пользователи могут захотеть отключить функцию Adaptive Color, чтобы предотвратить любые незначительные изменения цвета при редактировании фотографий.
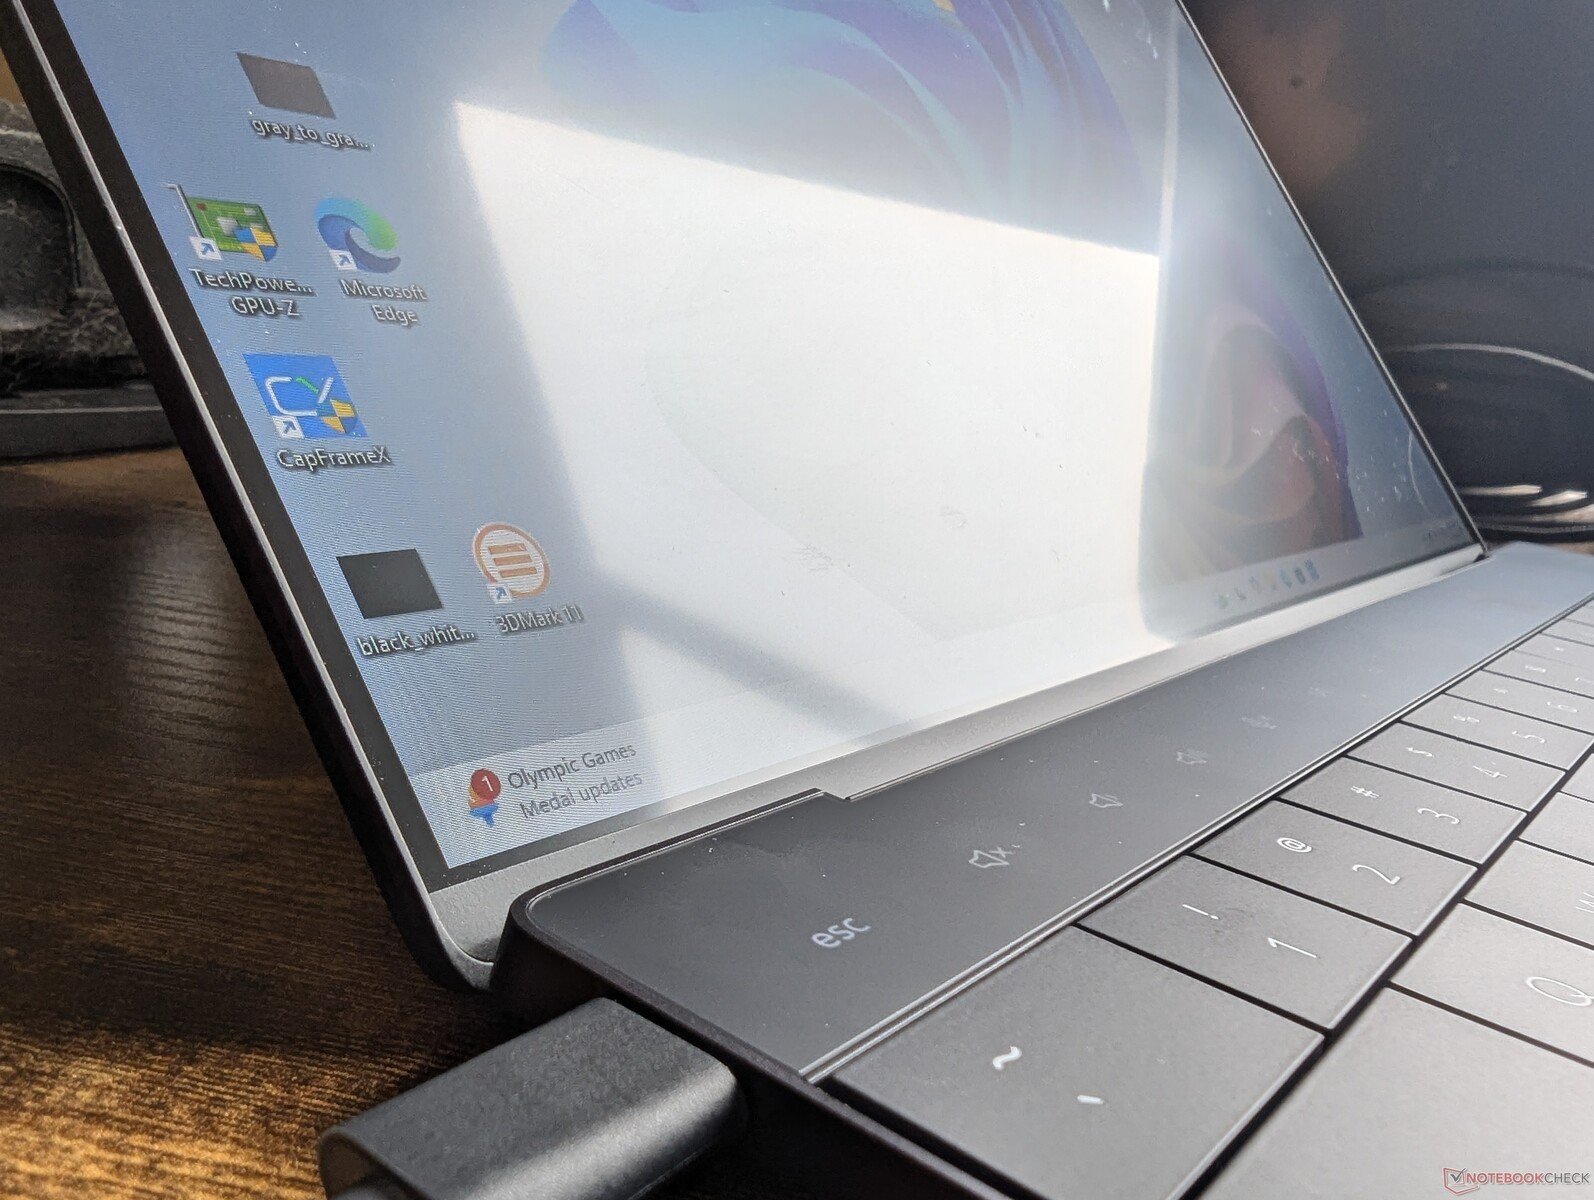
Стоит отметить относительно высокий минимальный уровень яркости 49 нит, который мы заметили и на нашей модели Core i7. Для сравнения, дисплеи большинства других ноутбуков при минимальной яркости обычно достигают 15 нит или меньше. Более высокая яркость дисплея Dell может вызывать усталость глаз при просмотре в темном помещении. Эта потенциальная проблема отсутствует в конфигурации OLED, которая может достигать гораздо более низких уровней яркости.
| |||||||||||||||||||||||||
Равномерность подсветки: 86 %
От батареи: 518.3 cd/m²
Контрастность: 1993:1 (Уровень чёрного: 0.26 cd/m²)
ΔE Color 3.4 | 0.5-29.43 Ø4.87
ΔE Greyscale 4.2 | 0.5-98 Ø5.1
71.7% AdobeRGB 1998 (Argyll 2.2.0 3D)
97.8% sRGB (Argyll 2.2.0 3D)
69.4% Display P3 (Argyll 2.2.0 3D)
Gamma: 2.29
| Dell XPS 13 9345 IPS, 1920x1200, 13.4", 120 Hz | Dell XPS 13 9340 Core Ultra 7 SHP1593, IPS, 1920x1200, 13.4", 120 Hz | Microsoft Surface Laptop 7 13.8 Copilot+ LQ138P1JX61, IPS, 2304x1536, 13.8", 120 Hz | Lenovo ThinkBook 13x G4 21KR0008GE LEN135WQ+, IPS, 2880x1920, 13.5", 120 Hz | HP EliteBook Ultra G1q 14 IPS, 2240x1400, 14", 60 Hz | Asus ZenBook S13 OLED UX5304 SDC417B, OLED, 2880x1800, 13.3", 60 Hz | |
|---|---|---|---|---|---|---|
| Display | 0% | 21% | -4% | 27% | ||
| Display P3 Coverage | 69.4 | 69.4 0% | 97.8 41% | 65.5 -6% | 99.7 44% | |
| sRGB Coverage | 97.8 | 97.8 0% | 98.2 0% | 97.3 -1% | 100 2% | |
| AdobeRGB 1998 Coverage | 71.7 | 71.7 0% | 87.3 22% | 67.7 -6% | 96.9 35% | |
| Response Times | -25% | 5% | 32% | 27% | 94% | |
| Response Time Grey 50% / Grey 80% * | 35.2 ? | 43.2 ? -23% | 38.9 ? -11% | 27.3 ? 22% | 22.8 ? 35% | 2 ? 94% |
| Response Time Black / White * | 21.8 ? | 27.6 ? -27% | 17.4 ? 20% | 12.8 ? 41% | 17.9 ? 18% | 1.6 ? 93% |
| PWM Frequency | 240 ? | |||||
| Параметры экрана | -6% | 16% | 10% | -58% | 27% | |
| Яркость в центре | 518.3 | 429 -17% | 606 17% | 539 4% | 341.4 -34% | 361 -30% |
| Brightness | 487 | 407 -16% | 592 22% | 513 5% | 315 -35% | 365 -25% |
| Brightness Distribution | 86 | 90 5% | 94 9% | 89 3% | 87 1% | 98 14% |
| Уровень чёрного * | 0.26 | 0.28 -8% | 0.43 -65% | 0.38 -46% | 0.39 -50% | |
| Контрастность | 1993 | 1532 -23% | 1409 -29% | 1418 -29% | 875 -56% | |
| Colorchecker Delta E * | 3.4 | 2.6 24% | 1.3 62% | 1.4 59% | 5.63 -66% | 1.2 65% |
| Colorchecker dE 2000 max. * | 5.68 | 6.6 -16% | 2.1 63% | 3.5 38% | 11.94 -110% | 1.9 67% |
| Delta E для серого * | 4.2 | 4 5% | 2.1 50% | 2.2 48% | 8.8 -110% | 1.2 71% |
| Гамма | 2.29 96% | 2.23 99% | 2.16 102% | 2.19 100% | 2.14 103% | 2.27 97% |
| CCT | 7235 90% | 7332 89% | 6842 95% | 6710 97% | 6034 108% | 6486 100% |
| Colorchecker dE 2000 calibrated * | 1.4 | 0.7 | ||||
| Среднее значение | -10% /
-7% | 14% /
15% | 13% /
10% | -16% /
-41% | 49% /
39% |
* ... меньше = лучше
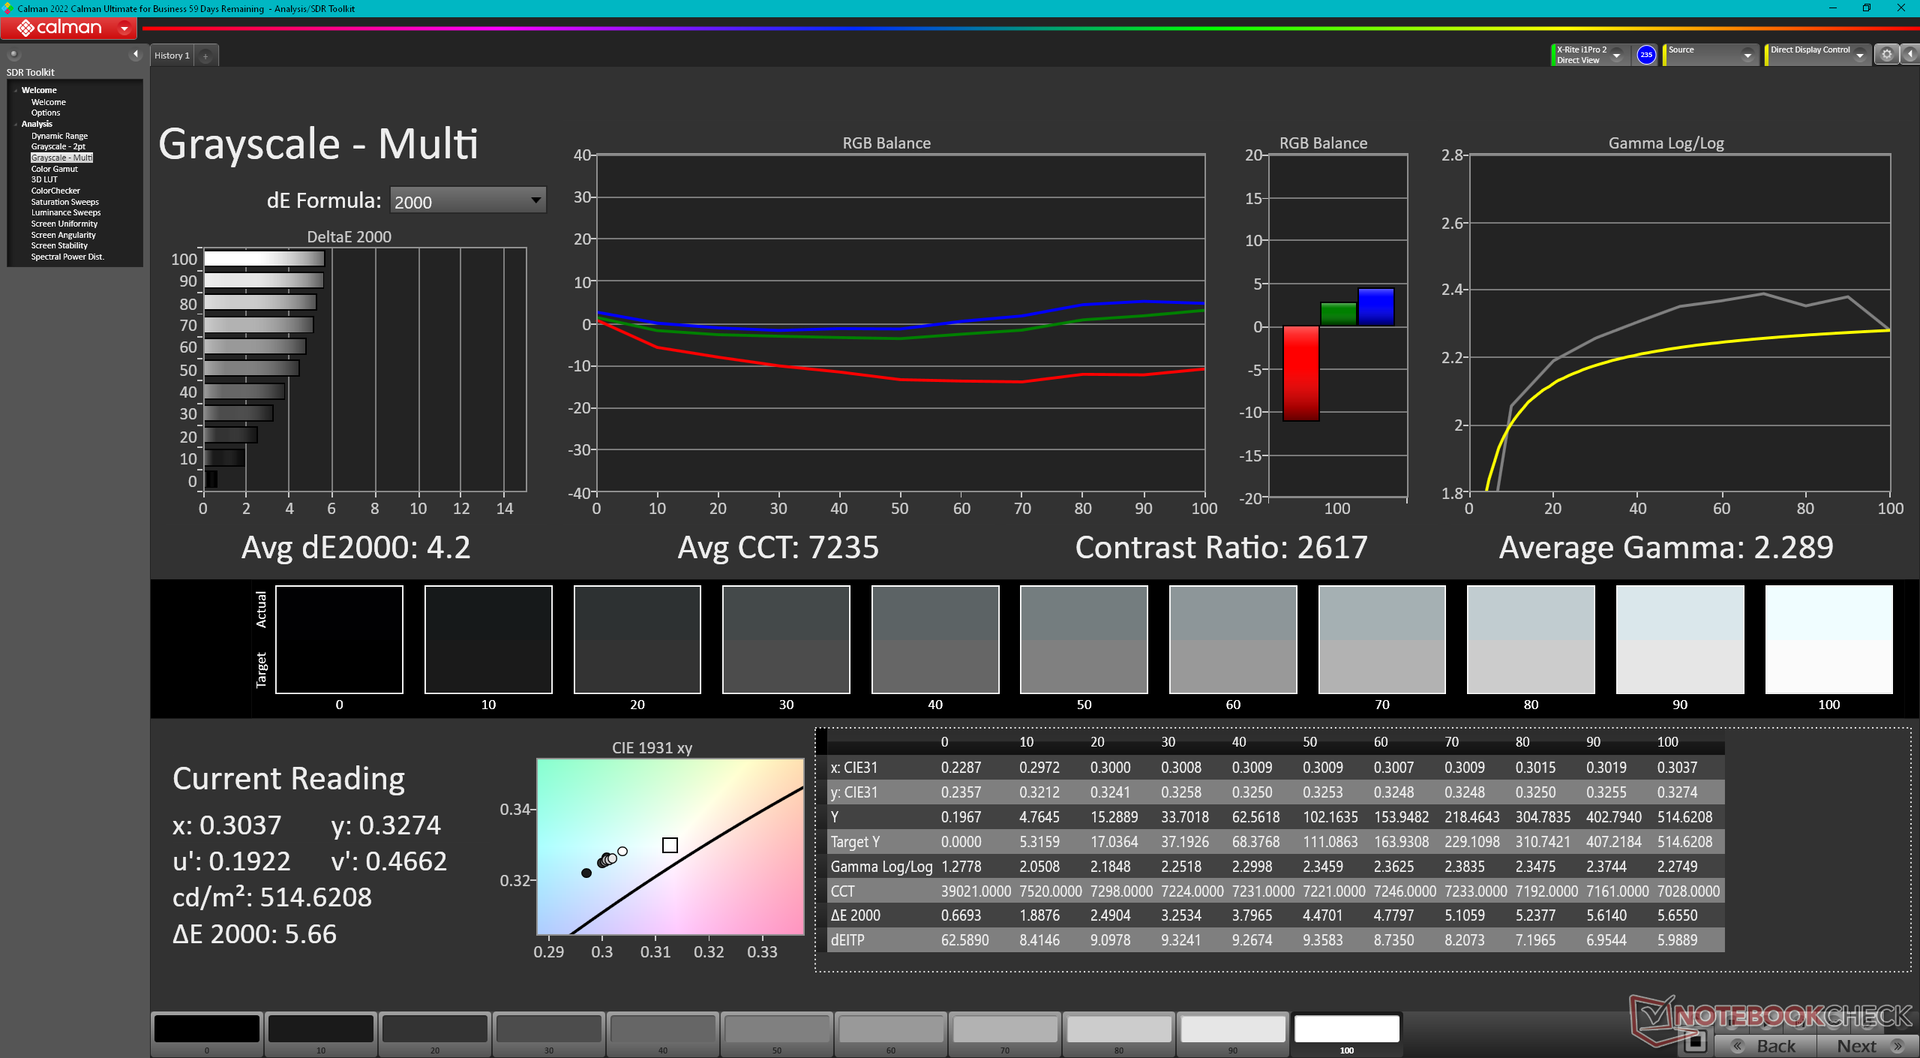
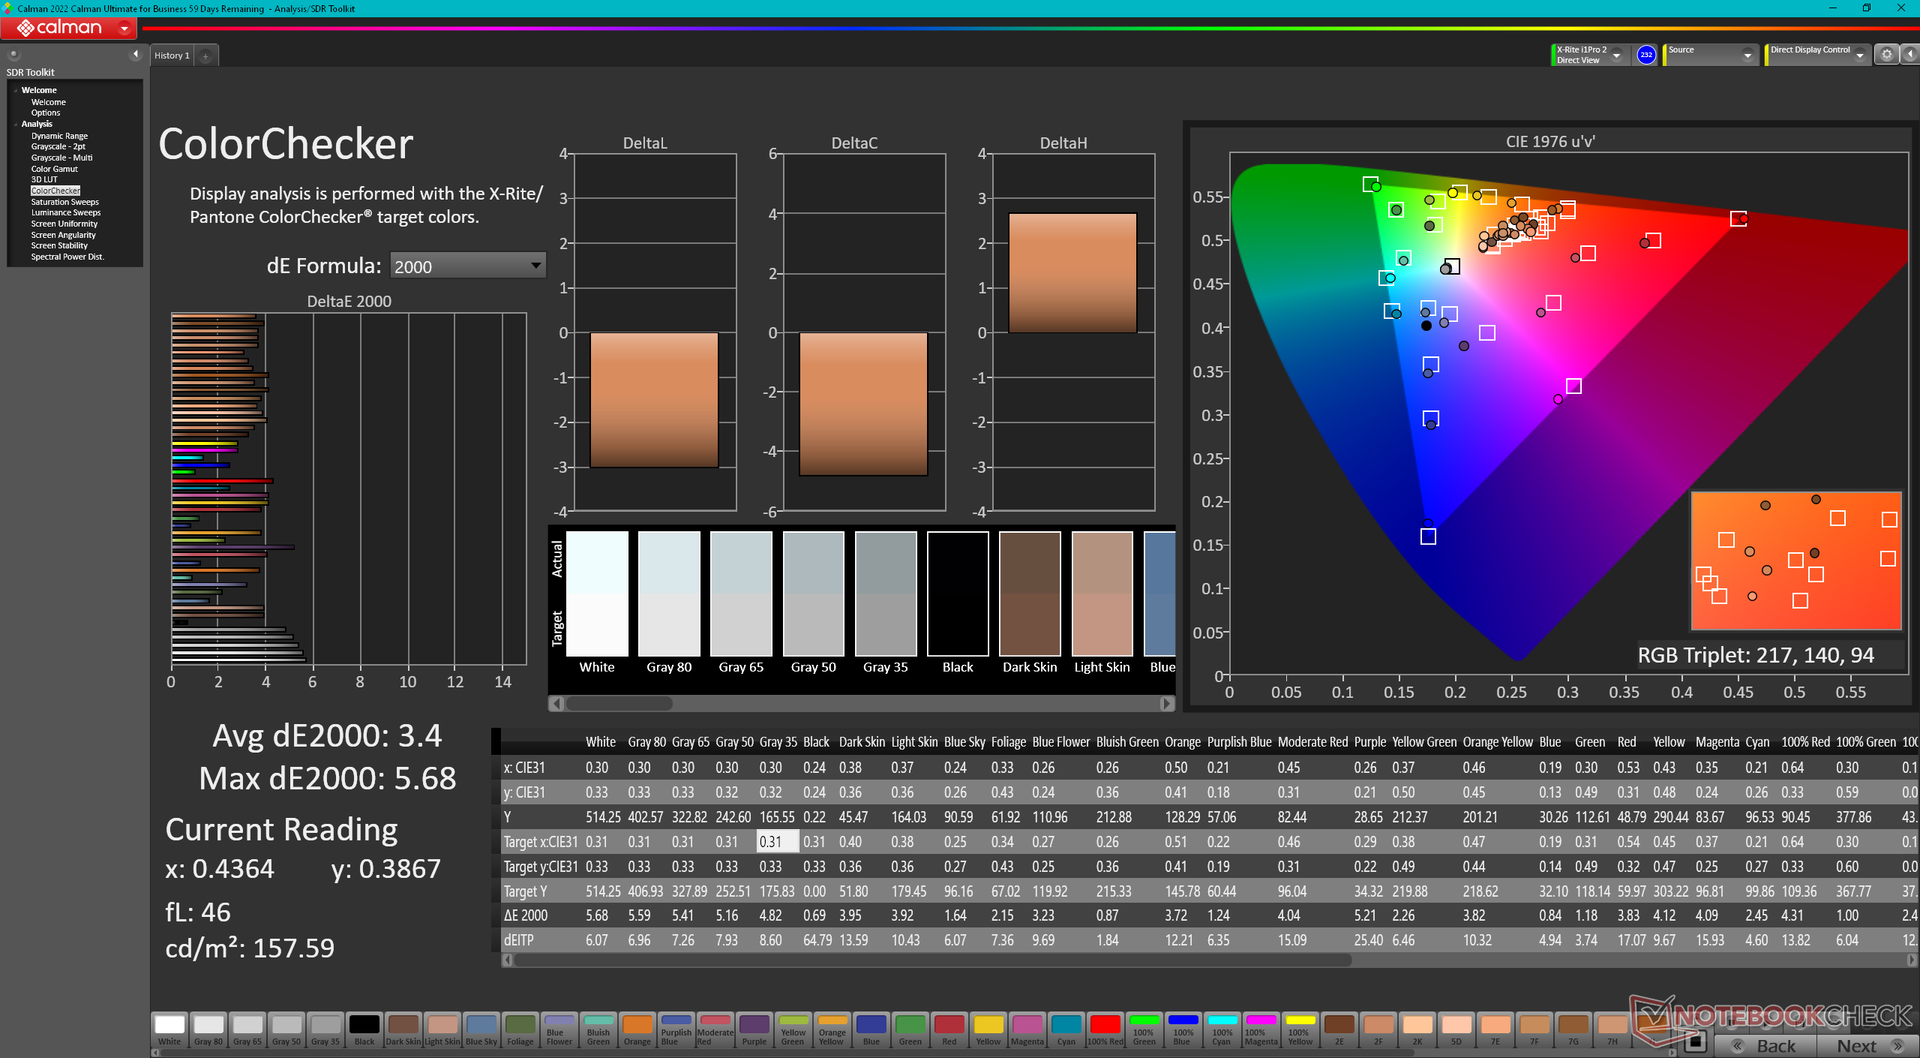
Наш колориметр X-Rite показывает, что дисплей нацелен на sRGB с приличными средними значениями дельтаЕ серого и цвета - 4,2 и 3,4, соответственно. Цветовая температура, однако, немного слишком холодная - 7235, что снижает точность цветопередачи на низких уровнях насыщенности. Жаль, что Dell не калибрует панель на заводе, поскольку большинство калибровочных программ пока не совместимы с ARM, включая i1Profiler.

Дисплей: тест на время отклика
| ↔ Перемена цвета пикселей, чёрный - белый (1) и белый - чёрный (2) | ||
|---|---|---|
| 21.8 ms ... стадия 1 ↗ и стадия 2 ↘ в сумме | ↗ 10.5 ms стадия 1 | 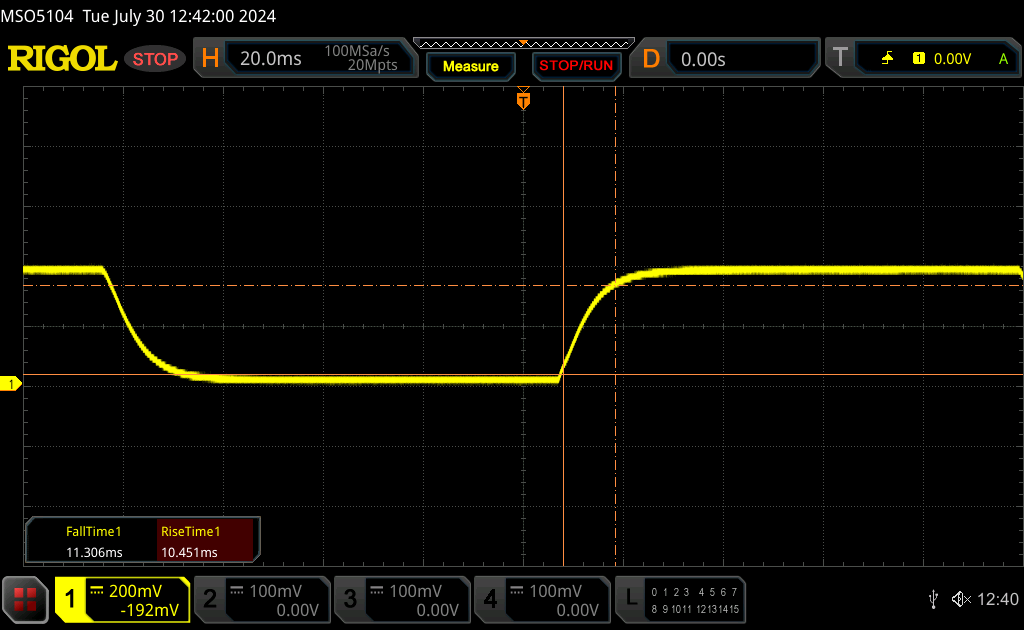 |
| ↘ 11.3 ms стадия 2 | ||
| Это неплохое время отклика. Оно подходит для игр и подобных применений, хоть и не идеально. Для сравнения, самый лучший результат среди всех известных нам устройств равен 0.1 миллисек., самый худший - 240 миллисек. » 45% экранов из нашей базы данных показали более хороший результат. Таким образом, тестируемое устройство попадает в условную середину рейтинга (показывает результат на уровне среднего, то есть 20.8 миллисек.) | ||
| ↔ Перемена цвета пикселей, серый 50% - серый 80% (1) и серый 80% - серый 50% (2) | ||
| 35.2 ms ... стадия 1 ↗ и стадия 2 ↘ в сумме | ↗ 15.2 ms стадия 1 | 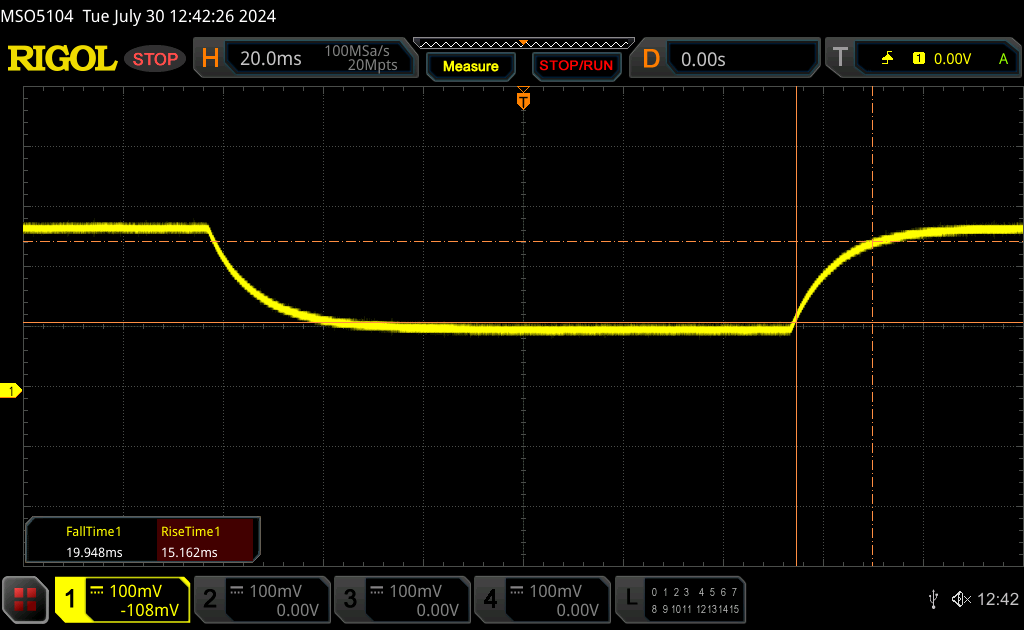 |
| ↘ 20 ms стадия 2 | ||
| Это очень большое время отклика. Экран явно не ориентирован на игры и подобные применения. Для сравнения, самый лучший результат среди всех известных нам устройств равен 0.165 миллисек., самый худший - 636 миллисек. » 46% экранов из нашей базы данных показали более хороший результат. Таким образом, тестируемое устройство попадает в условную середину рейтинга (показывает результат на уровне среднего, то есть 32.5 миллисек.) | ||
Тест на мерцание
| Ура! ШИМ не обнаружено | 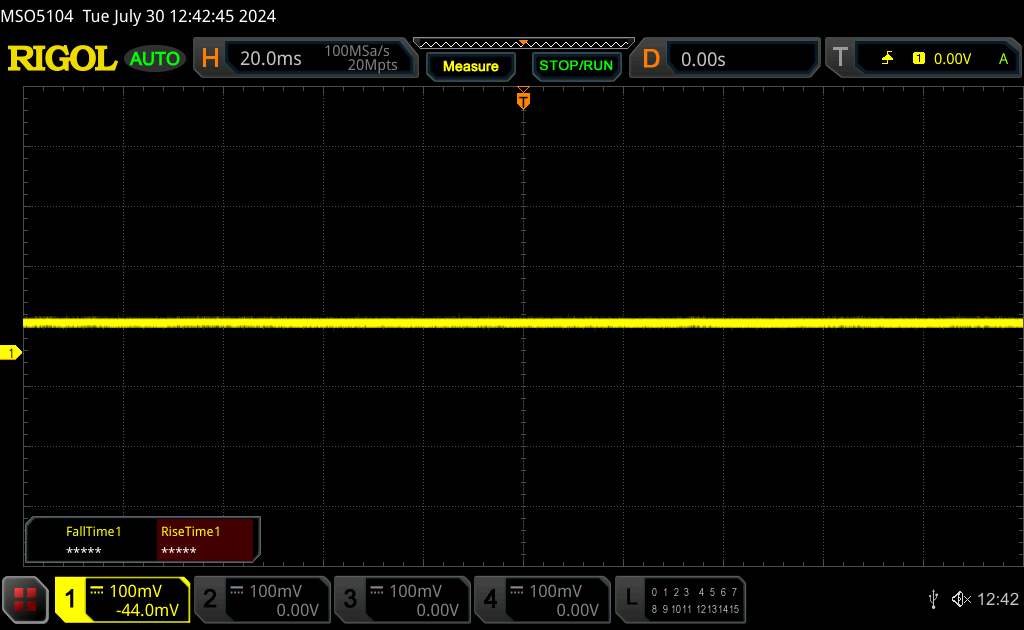 | ||
Для сравнения, 53 % известных нам устройств не применяют PWM для изменения яркости, а среди тех, где PWM используется, типичная частота модуляции составляет 8516 Гц (мин. 5 Гц, макс. 343500 Гц). | |||

Производительность
Параметры тестирования
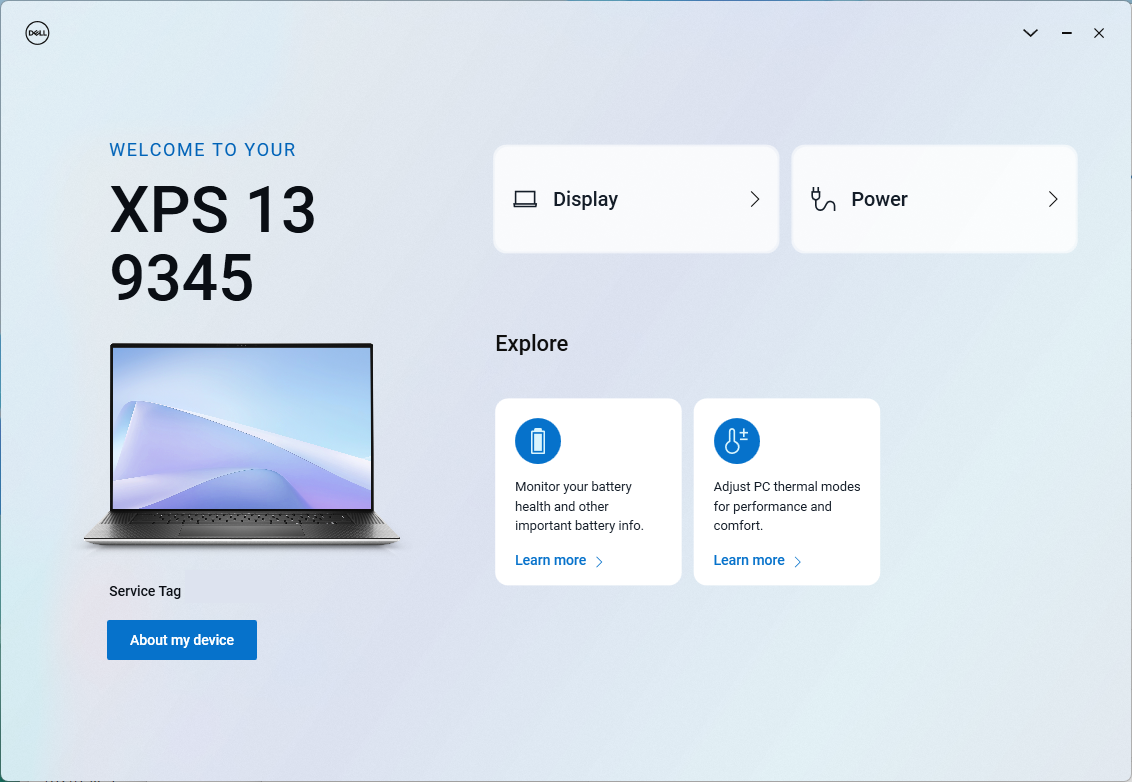
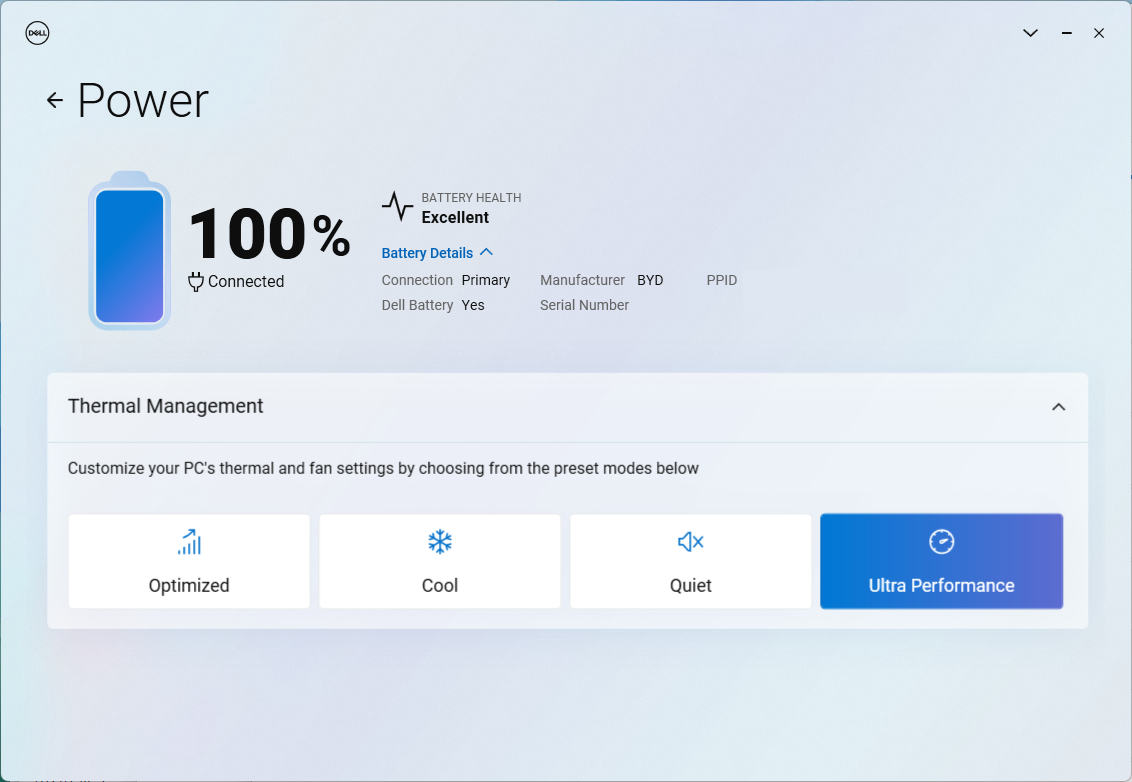
Мы перевели Windows и MyDell в режим производительности перед выполнением приведенных ниже бенчмарков. Программа MyDell была переработана в модели Snapdragon и стала более простой в использовании по сравнению с аналогичным ПО на XPS 13 на базе Intel. Некоторые функции, которые раньше были доступны в этом ПО, например, обнаружение присутствия, были перенесены в меню питания и батареи Windows.
Процессор
Производительность в значительной степени зависит от того, является ли приложение родным или эмулированным. Например, процессор демонстрирует превосходство в CineBench 2024 и GeekBench 6, поскольку оба эти приложения были оптимизированы для среды ARM. Наш Snapdragon X Elite X1E-80-100 превзошел бы Core Ultra 7 155H как в многопоточных, так и в однопоточных операциях в таких условиях. В противном случае эмулированные бенчмарки вернут наш процессор Snapdragon на уровень производительности, более близкий к старшим моделям Core i5-1240P или Core i7-1260P. Другими словами, процессор Qualcomm может быть конкурентоспособным по сравнению с Core Ultra 7 155H, как любит утверждать производитель, но условия и приложения должны быть подходящими, чтобы эти преимущества раскрылись.
Согласованность производительности между процессорами Snapdragon также бывает трудно измерить. В нашем примере Snapdragon X Elite X1E-80-100 с комфортом превзошел бы Snapdragon X Elite X1E-78-100 в EliteBook Ultra G1q 14 в CineBench 2024, но в CineBench R23 и R15 все наоборот.
Многопоточный тест CB15
Cinebench 2024: CPU Multi Core | CPU Single Core
Cinebench R23: Multi Core | Single Core
Cinebench R20: CPU (Multi Core) | CPU (Single Core)
Cinebench R15: CPU Multi 64Bit | CPU Single 64Bit
Blender: v2.79 BMW27 CPU
7-Zip 18.03: 7z b 4 | 7z b 4 -mmt1
Geekbench 6.4: Multi-Core | Single-Core
HWBOT x265 Benchmark v2.2: 4k Preset
LibreOffice : 20 Documents To PDF
R Benchmark 2.5: Overall mean
| CPU Performance Rating | |
| Dell XPS 14 2024 OLED | |
| Dell XPS 13 9340 Core Ultra 7 | |
| Dell XPS 13 Plus 9320 Core i7-1360P -4! | |
| Dell XPS 13 Plus 9320 i7-1280P OLED -4! | |
| Dell XPS 13 Plus 9320 4K -4! | |
| Microsoft Surface Laptop 7 13.8 Copilot+ | |
| Dell XPS 13 9345 | |
| Усредн. модель с Qualcomm Snapdragon X Elite X1E-80-100 | |
| HP EliteBook Ultra G1q 14 | |
| Medion SPRCHRGD 14 S1 Elite | |
| Dell XPS 13 Plus 9320 i5-1240p -4! | |
| Lenovo ThinkPad T14s Gen 6 21N10007GE | |
| Dell XPS 13 9315 2-in-1 Core i5-1230U -4! | |
| Dell XPS 13 9315, i5-1230U -8! | |
| Dell XPS 13 9310 Core i7 4K -4! | |
| Dell XPS 13 9310 OLED -4! | |
| Dell XPS 13 9310 2-in-1 -5! | |
| Dell XPS 13 9305 Core i5 FHD -6! | |
| Cinebench 2024 / CPU Multi Core | |
| Dell XPS 13 9345 | |
| Microsoft Surface Laptop 7 13.8 Copilot+ | |
| Усредн. модель с Qualcomm Snapdragon X Elite X1E-80-100 (621 - 927, n=7) | |
| Medion SPRCHRGD 14 S1 Elite | |
| HP EliteBook Ultra G1q 14 | |
| Lenovo ThinkPad T14s Gen 6 21N10007GE | |
| Dell XPS 13 9340 Core Ultra 7 | |
| Dell XPS 14 2024 OLED | |
| Cinebench 2024 / CPU Single Core | |
| Microsoft Surface Laptop 7 13.8 Copilot+ | |
| Усредн. модель с Qualcomm Snapdragon X Elite X1E-80-100 (122 - 123, n=7) | |
| Dell XPS 13 9345 | |
| Lenovo ThinkPad T14s Gen 6 21N10007GE | |
| Medion SPRCHRGD 14 S1 Elite | |
| HP EliteBook Ultra G1q 14 | |
| Dell XPS 14 2024 OLED | |
| Dell XPS 13 9340 Core Ultra 7 | |
| Geekbench 6.4 / Multi-Core | |
| Lenovo ThinkPad T14s Gen 6 21N10007GE | |
| Dell XPS 13 9345 | |
| Medion SPRCHRGD 14 S1 Elite | |
| Microsoft Surface Laptop 7 13.8 Copilot+ | |
| Dell XPS 14 2024 OLED | |
| HP EliteBook Ultra G1q 14 | |
| Усредн. модель с Qualcomm Snapdragon X Elite X1E-80-100 (7596 - 14998, n=9) | |
| Dell XPS 13 9340 Core Ultra 7 | |
| Geekbench 6.4 / Single-Core | |
| Dell XPS 13 9345 | |
| Microsoft Surface Laptop 7 13.8 Copilot+ | |
| Усредн. модель с Qualcomm Snapdragon X Elite X1E-80-100 (1896 - 2845, n=9) | |
| Lenovo ThinkPad T14s Gen 6 21N10007GE | |
| Medion SPRCHRGD 14 S1 Elite | |
| Dell XPS 14 2024 OLED | |
| Dell XPS 13 9340 Core Ultra 7 | |
| HP EliteBook Ultra G1q 14 | |
Cinebench 2024: CPU Multi Core | CPU Single Core
Cinebench R23: Multi Core | Single Core
Cinebench R20: CPU (Multi Core) | CPU (Single Core)
Cinebench R15: CPU Multi 64Bit | CPU Single 64Bit
Blender: v2.79 BMW27 CPU
7-Zip 18.03: 7z b 4 | 7z b 4 -mmt1
Geekbench 6.4: Multi-Core | Single-Core
HWBOT x265 Benchmark v2.2: 4k Preset
LibreOffice : 20 Documents To PDF
R Benchmark 2.5: Overall mean
* ... меньше = лучше
AIDA64: FP32 Ray-Trace | FPU Julia | CPU SHA3 | CPU Queen | FPU SinJulia | FPU Mandel | CPU AES | CPU ZLib | FP64 Ray-Trace | CPU PhotoWorxx
| Performance Rating | |
| Dell XPS 13 9340 Core Ultra 7 | |
| Lenovo ThinkBook 13x G4 21KR0008GE | |
| Microsoft Surface Laptop 7 13.8 Copilot+ | |
| Dell XPS 13 9345 | |
| HP EliteBook Ultra G1q 14 | |
| Усредн. модель с Qualcomm Snapdragon X Elite X1E-80-100 | |
| Asus ZenBook S13 OLED UX5304 | |
| AIDA64 / FP32 Ray-Trace | |
| Dell XPS 13 9340 Core Ultra 7 | |
| Lenovo ThinkBook 13x G4 21KR0008GE | |
| HP EliteBook Ultra G1q 14 | |
| Microsoft Surface Laptop 7 13.8 Copilot+ | |
| Dell XPS 13 9345 | |
| Усредн. модель с Qualcomm Snapdragon X Elite X1E-80-100 (2184 - 7469, n=7) | |
| Asus ZenBook S13 OLED UX5304 | |
| AIDA64 / FPU Julia | |
| Dell XPS 13 9340 Core Ultra 7 | |
| Lenovo ThinkBook 13x G4 21KR0008GE | |
| Asus ZenBook S13 OLED UX5304 | |
| Microsoft Surface Laptop 7 13.8 Copilot+ | |
| Dell XPS 13 9345 | |
| HP EliteBook Ultra G1q 14 | |
| Усредн. модель с Qualcomm Snapdragon X Elite X1E-80-100 (5687 - 26391, n=7) | |
| AIDA64 / CPU SHA3 | |
| HP EliteBook Ultra G1q 14 | |
| Microsoft Surface Laptop 7 13.8 Copilot+ | |
| Dell XPS 13 9340 Core Ultra 7 | |
| Dell XPS 13 9345 | |
| Усредн. модель с Qualcomm Snapdragon X Elite X1E-80-100 (2607 - 3122, n=7) | |
| Lenovo ThinkBook 13x G4 21KR0008GE | |
| Asus ZenBook S13 OLED UX5304 | |
| AIDA64 / CPU Queen | |
| Lenovo ThinkBook 13x G4 21KR0008GE | |
| Dell XPS 13 9340 Core Ultra 7 | |
| Microsoft Surface Laptop 7 13.8 Copilot+ | |
| Усредн. модель с Qualcomm Snapdragon X Elite X1E-80-100 (67219 - 69762, n=7) | |
| Dell XPS 13 9345 | |
| HP EliteBook Ultra G1q 14 | |
| Asus ZenBook S13 OLED UX5304 | |
| AIDA64 / FPU SinJulia | |
| Dell XPS 13 9340 Core Ultra 7 | |
| Lenovo ThinkBook 13x G4 21KR0008GE | |
| Asus ZenBook S13 OLED UX5304 | |
| Microsoft Surface Laptop 7 13.8 Copilot+ | |
| Dell XPS 13 9345 | |
| Усредн. модель с Qualcomm Snapdragon X Elite X1E-80-100 (1521 - 2357, n=7) | |
| HP EliteBook Ultra G1q 14 | |
| AIDA64 / FPU Mandel | |
| Dell XPS 13 9340 Core Ultra 7 | |
| Lenovo ThinkBook 13x G4 21KR0008GE | |
| Asus ZenBook S13 OLED UX5304 | |
| HP EliteBook Ultra G1q 14 | |
| Microsoft Surface Laptop 7 13.8 Copilot+ | |
| Усредн. модель с Qualcomm Snapdragon X Elite X1E-80-100 (10117 - 15669, n=7) | |
| Dell XPS 13 9345 | |
| AIDA64 / CPU AES | |
| HP EliteBook Ultra G1q 14 | |
| Dell XPS 13 9340 Core Ultra 7 | |
| Microsoft Surface Laptop 7 13.8 Copilot+ | |
| Усредн. модель с Qualcomm Snapdragon X Elite X1E-80-100 (39956 - 71089, n=7) | |
| Dell XPS 13 9345 | |
| Lenovo ThinkBook 13x G4 21KR0008GE | |
| Asus ZenBook S13 OLED UX5304 | |
| AIDA64 / CPU ZLib | |
| Dell XPS 13 9340 Core Ultra 7 | |
| HP EliteBook Ultra G1q 14 | |
| Microsoft Surface Laptop 7 13.8 Copilot+ | |
| Dell XPS 13 9345 | |
| Усредн. модель с Qualcomm Snapdragon X Elite X1E-80-100 (398 - 802, n=7) | |
| Lenovo ThinkBook 13x G4 21KR0008GE | |
| Asus ZenBook S13 OLED UX5304 | |
| AIDA64 / FP64 Ray-Trace | |
| Dell XPS 13 9340 Core Ultra 7 | |
| Lenovo ThinkBook 13x G4 21KR0008GE | |
| Microsoft Surface Laptop 7 13.8 Copilot+ | |
| Dell XPS 13 9345 | |
| Усредн. модель с Qualcomm Snapdragon X Elite X1E-80-100 (2581 - 4044, n=7) | |
| Asus ZenBook S13 OLED UX5304 | |
| HP EliteBook Ultra G1q 14 | |
| AIDA64 / CPU PhotoWorxx | |
| Dell XPS 13 9340 Core Ultra 7 | |
| Lenovo ThinkBook 13x G4 21KR0008GE | |
| Asus ZenBook S13 OLED UX5304 | |
| Microsoft Surface Laptop 7 13.8 Copilot+ | |
| Dell XPS 13 9345 | |
| Усредн. модель с Qualcomm Snapdragon X Elite X1E-80-100 (28474 - 38707, n=7) | |
| HP EliteBook Ultra G1q 14 | |
Производительность системы
WebXPRT и Kraken, которые работают в браузере Edge, оптимизированном для ARM, оценивают наш Qualcomm XPS выше, чем Intel XPS, с приличным отрывом.
WebXPRT 3: Overall
WebXPRT 4: Overall
Mozilla Kraken 1.1: Total
| CrossMark / Overall | |
| Dell XPS 13 9340 Core Ultra 7 | |
| Asus ZenBook S13 OLED UX5304 | |
| Lenovo ThinkBook 13x G4 21KR0008GE | |
| Microsoft Surface Laptop 7 13.8 Copilot+ | |
| Усредн. модель с Qualcomm Snapdragon X Elite X1E-80-100, Qualcomm SD X Adreno X1-85 3.8 TFLOPS (1356 - 1443, n=7) | |
| Dell XPS 13 9345 | |
| HP EliteBook Ultra G1q 14 | |
| CrossMark / Productivity | |
| Dell XPS 13 9340 Core Ultra 7 | |
| Asus ZenBook S13 OLED UX5304 | |
| Lenovo ThinkBook 13x G4 21KR0008GE | |
| Microsoft Surface Laptop 7 13.8 Copilot+ | |
| Усредн. модель с Qualcomm Snapdragon X Elite X1E-80-100, Qualcomm SD X Adreno X1-85 3.8 TFLOPS (1271 - 1375, n=7) | |
| Dell XPS 13 9345 | |
| HP EliteBook Ultra G1q 14 | |
| CrossMark / Creativity | |
| Dell XPS 13 9340 Core Ultra 7 | |
| Lenovo ThinkBook 13x G4 21KR0008GE | |
| Asus ZenBook S13 OLED UX5304 | |
| Microsoft Surface Laptop 7 13.8 Copilot+ | |
| Усредн. модель с Qualcomm Snapdragon X Elite X1E-80-100, Qualcomm SD X Adreno X1-85 3.8 TFLOPS (1402 - 1537, n=7) | |
| Dell XPS 13 9345 | |
| HP EliteBook Ultra G1q 14 | |
| CrossMark / Responsiveness | |
| Dell XPS 13 9340 Core Ultra 7 | |
| Asus ZenBook S13 OLED UX5304 | |
| Microsoft Surface Laptop 7 13.8 Copilot+ | |
| Усредн. модель с Qualcomm Snapdragon X Elite X1E-80-100, Qualcomm SD X Adreno X1-85 3.8 TFLOPS (1237 - 1401, n=7) | |
| Lenovo ThinkBook 13x G4 21KR0008GE | |
| Dell XPS 13 9345 | |
| HP EliteBook Ultra G1q 14 | |
| WebXPRT 3 / Overall | |
| Усредн. модель с Qualcomm Snapdragon X Elite X1E-80-100, Qualcomm SD X Adreno X1-85 3.8 TFLOPS (430 - 455, n=7) | |
| Microsoft Surface Laptop 7 13.8 Copilot+ | |
| Dell XPS 13 9345 | |
| HP EliteBook Ultra G1q 14 | |
| Asus ZenBook S13 OLED UX5304 | |
| Dell XPS 13 9340 Core Ultra 7 | |
| Lenovo ThinkBook 13x G4 21KR0008GE | |
| WebXPRT 4 / Overall | |
| Dell XPS 13 9345 | |
| Усредн. модель с Qualcomm Snapdragon X Elite X1E-80-100, Qualcomm SD X Adreno X1-85 3.8 TFLOPS (295 - 324, n=7) | |
| Microsoft Surface Laptop 7 13.8 Copilot+ | |
| HP EliteBook Ultra G1q 14 | |
| Dell XPS 13 9340 Core Ultra 7 | |
| Asus ZenBook S13 OLED UX5304 | |
| Lenovo ThinkBook 13x G4 21KR0008GE | |
| Mozilla Kraken 1.1 / Total | |
| Lenovo ThinkBook 13x G4 21KR0008GE | |
| Dell XPS 13 9340 Core Ultra 7 | |
| Asus ZenBook S13 OLED UX5304 | |
| HP EliteBook Ultra G1q 14 | |
| Dell XPS 13 9345 | |
| Усредн. модель с Qualcomm Snapdragon X Elite X1E-80-100, Qualcomm SD X Adreno X1-85 3.8 TFLOPS (391 - 422, n=7) | |
| Microsoft Surface Laptop 7 13.8 Copilot+ | |
* ... меньше = лучше
| AIDA64 / Memory Copy | |
| Dell XPS 13 9340 Core Ultra 7 | |
| Lenovo ThinkBook 13x G4 21KR0008GE | |
| Dell XPS 13 9345 | |
| Microsoft Surface Laptop 7 13.8 Copilot+ | |
| Asus ZenBook S13 OLED UX5304 | |
| Усредн. модель с Qualcomm Snapdragon X Elite X1E-80-100 (44795 - 63495, n=7) | |
| HP EliteBook Ultra G1q 14 | |
| AIDA64 / Memory Read | |
| Dell XPS 13 9345 | |
| Microsoft Surface Laptop 7 13.8 Copilot+ | |
| Усредн. модель с Qualcomm Snapdragon X Elite X1E-80-100 (58855 - 125604, n=7) | |
| Dell XPS 13 9340 Core Ultra 7 | |
| Lenovo ThinkBook 13x G4 21KR0008GE | |
| HP EliteBook Ultra G1q 14 | |
| Asus ZenBook S13 OLED UX5304 | |
| AIDA64 / Memory Write | |
| Dell XPS 13 9340 Core Ultra 7 | |
| Asus ZenBook S13 OLED UX5304 | |
| Lenovo ThinkBook 13x G4 21KR0008GE | |
| Dell XPS 13 9345 | |
| Microsoft Surface Laptop 7 13.8 Copilot+ | |
| Усредн. модель с Qualcomm Snapdragon X Elite X1E-80-100 (37270 - 45265, n=7) | |
| HP EliteBook Ultra G1q 14 | |
| AIDA64 / Memory Latency | |
| Lenovo ThinkBook 13x G4 21KR0008GE | |
| Dell XPS 13 9340 Core Ultra 7 | |
| Asus ZenBook S13 OLED UX5304 | |
| Усредн. модель с Qualcomm Snapdragon X Elite X1E-80-100 (7.4 - 8.8, n=5) | |
| HP EliteBook Ultra G1q 14 | |
| Dell XPS 13 9345 | |
| Microsoft Surface Laptop 7 13.8 Copilot+ | |
* ... меньше = лучше
Хранение данных
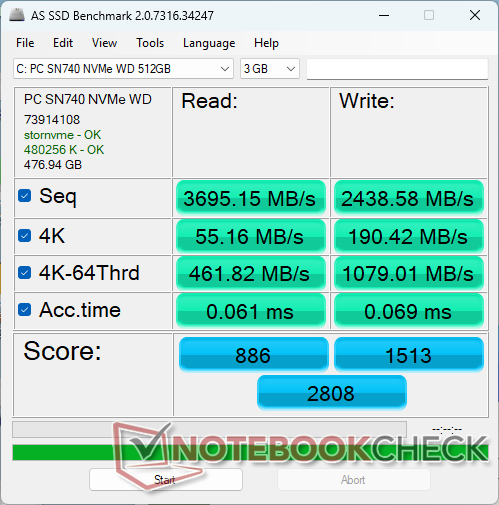
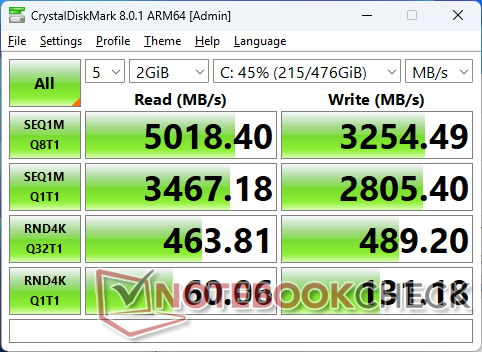
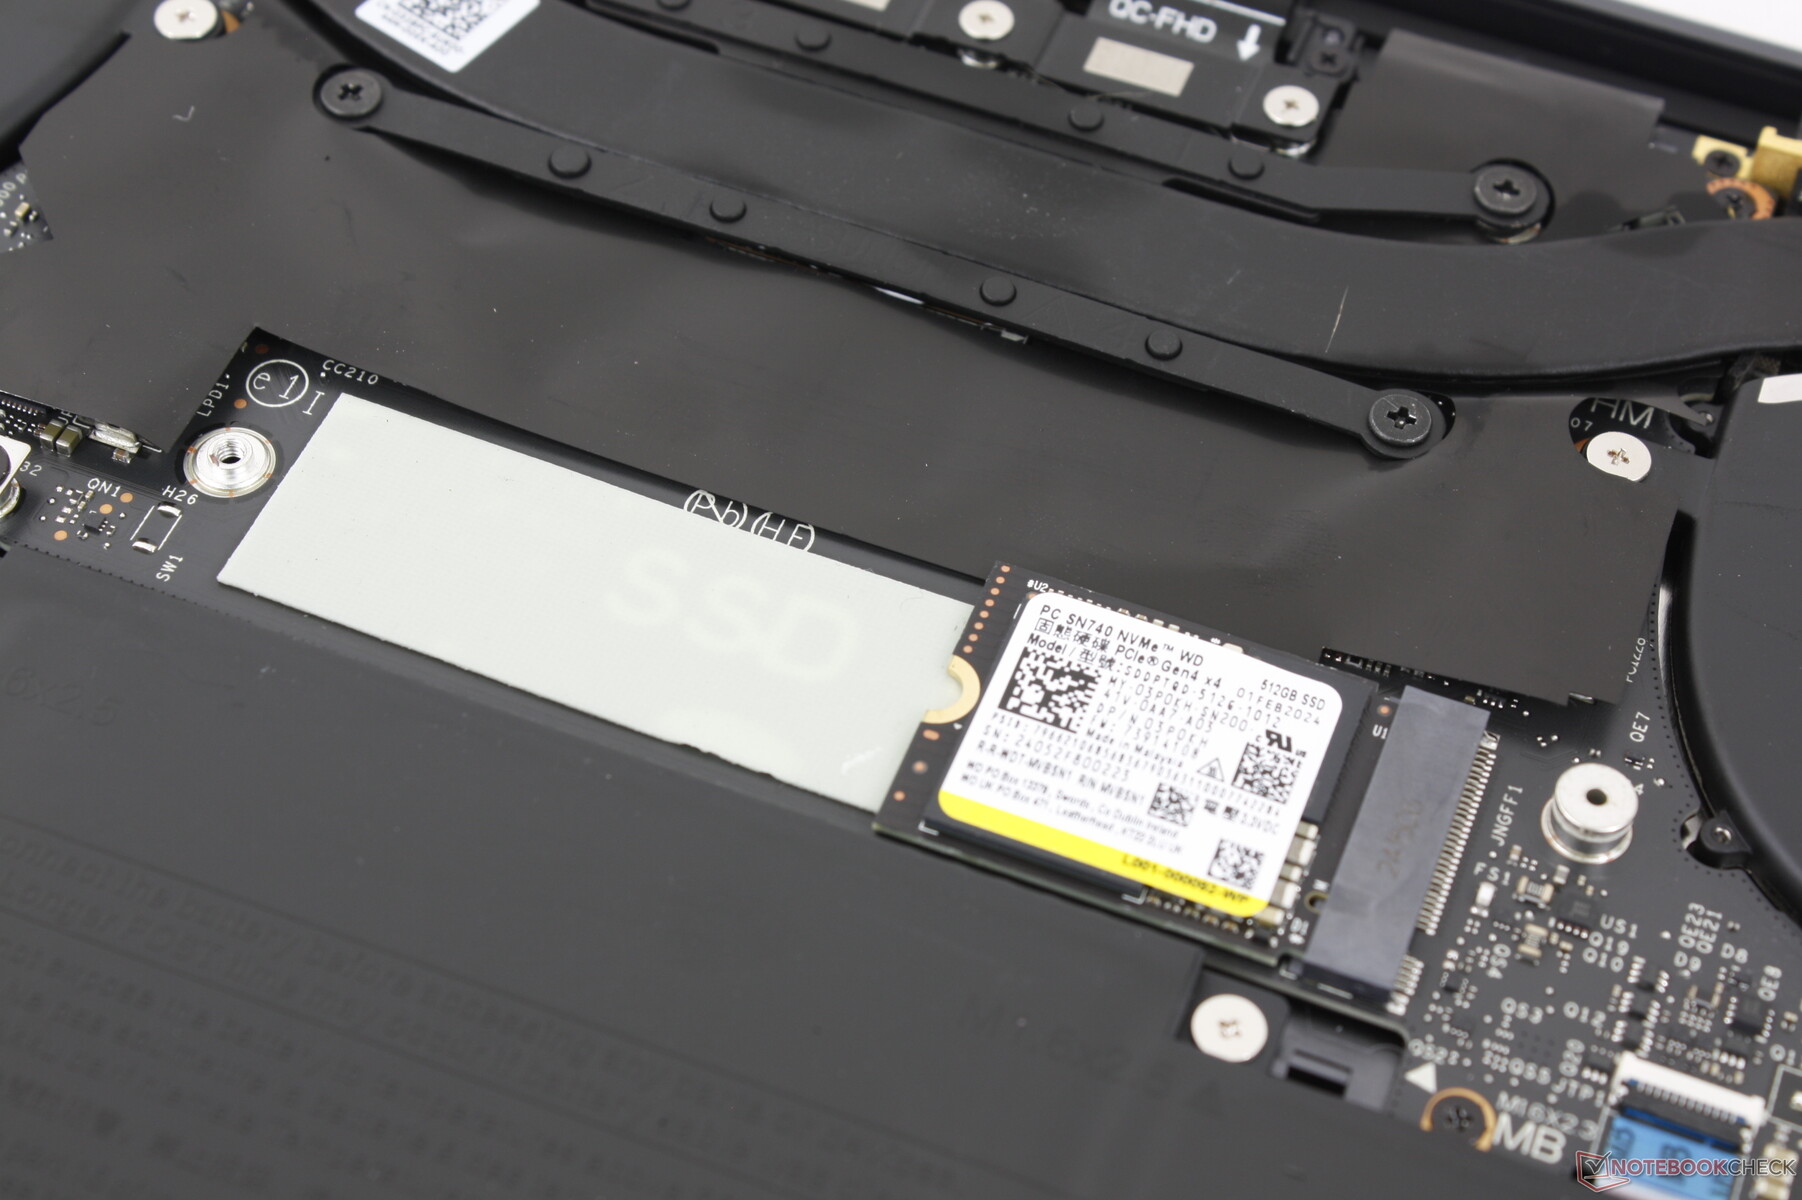
Dell поставляет свои твердотельные накопители от самых разных производителей, поэтому перед покупкой трудно понять, какой именно диск Вы получите. Например, в 10 с лишним различных моделях XPS 13 мы использовали накопители от Micron, Samsung, WD, Toshiba и SK Hynix. Наш конкретный аппарат Qualcomm поставляется с WD SN740 среднего класса, обеспечивающим стабильную скорость передачи данных до 5000 МБ/с. Мы не наблюдаем никакого дросселирования, несмотря на небольшую длину 42 мм, что, вероятно, отчасти объясняется входящим в комплект теплораспределителем SSD.

* ... меньше = лучше
Чтение в DiskSpd, Глубина запроса 8
Видеокарта
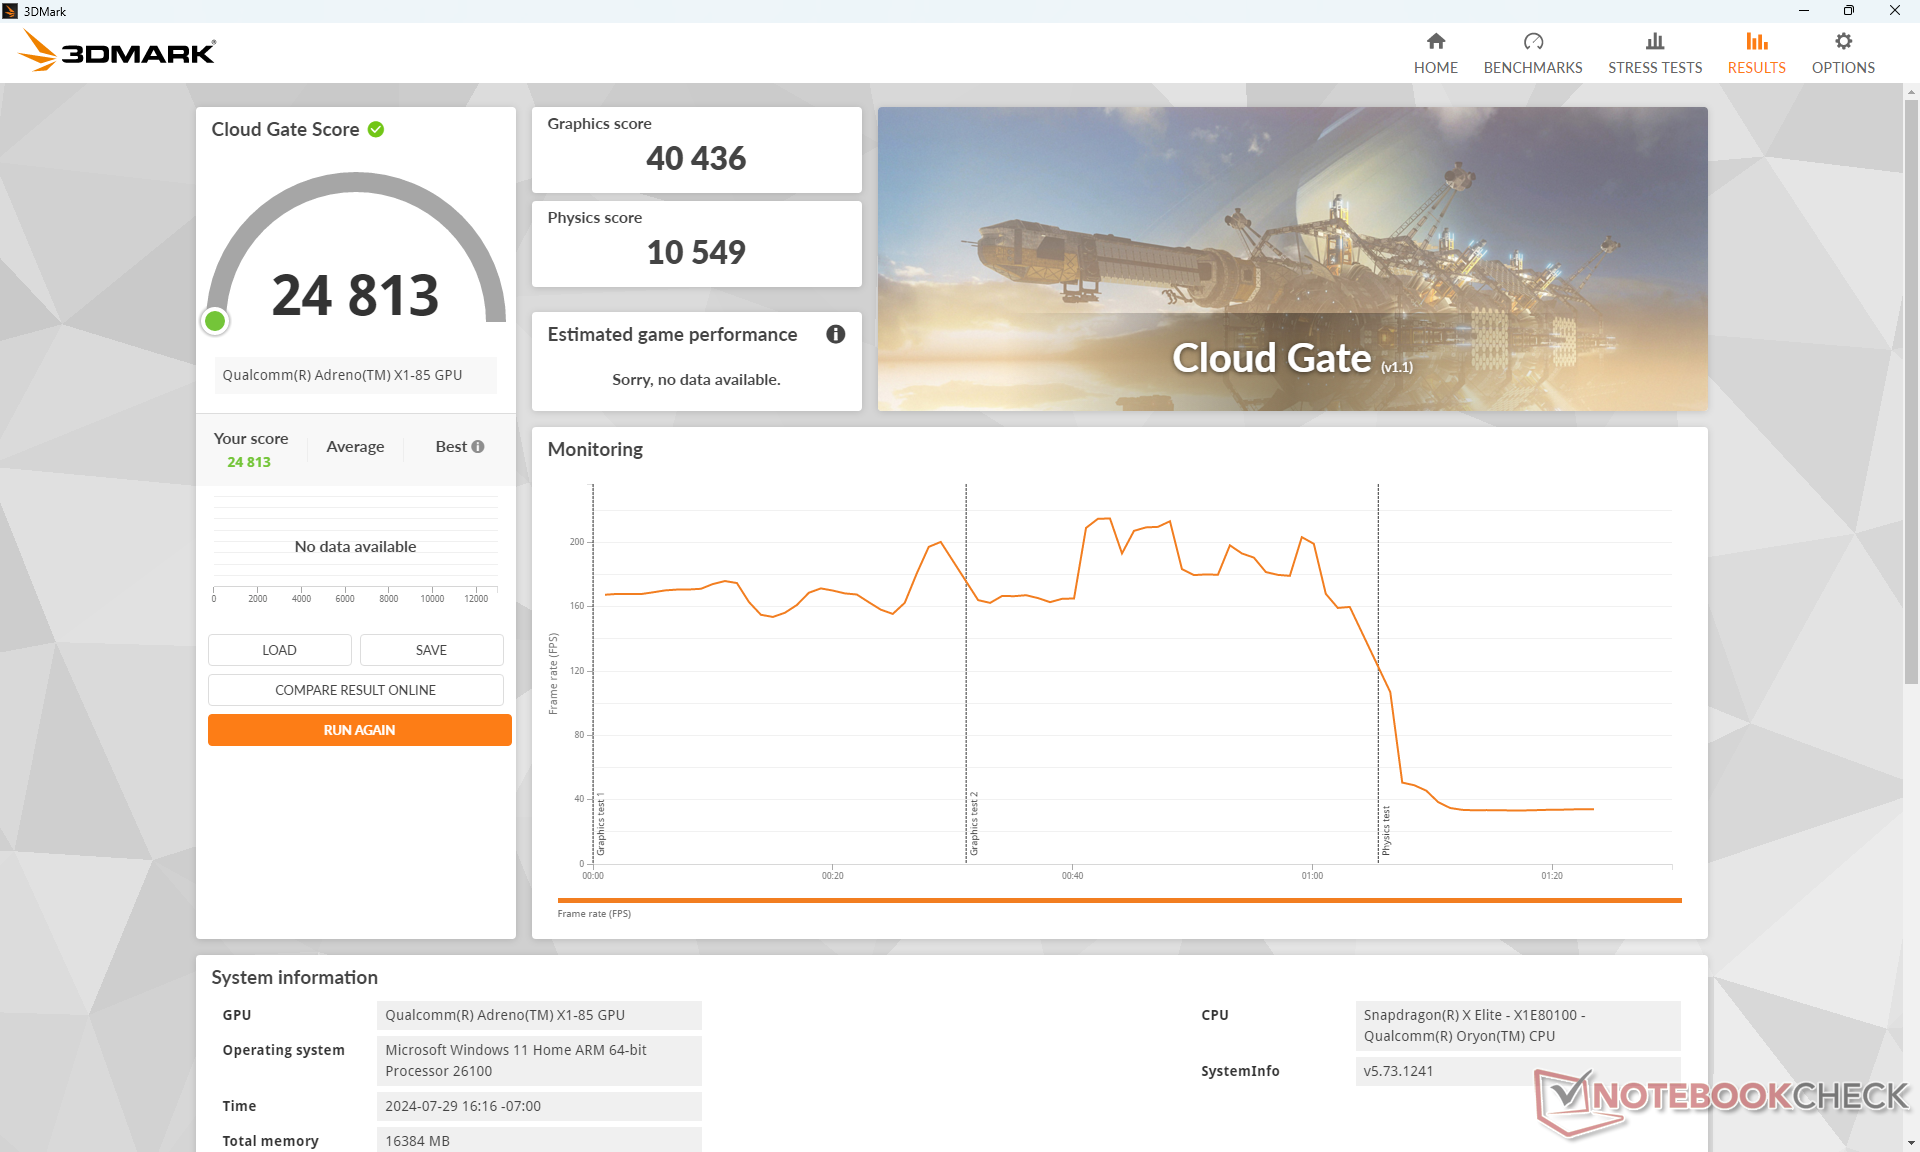
Графическая производительность, согласно эмулированному 3DMark, находится на одном уровне с Iris Xe 96 EUs но значительно уступает Arc 8 или Radeon 680M/780M на 20-40%. Тем не менее, результаты стабильно лучше, чем у HP EliteBook Ultra G1q 14 даже если разница в среднем незначительна.
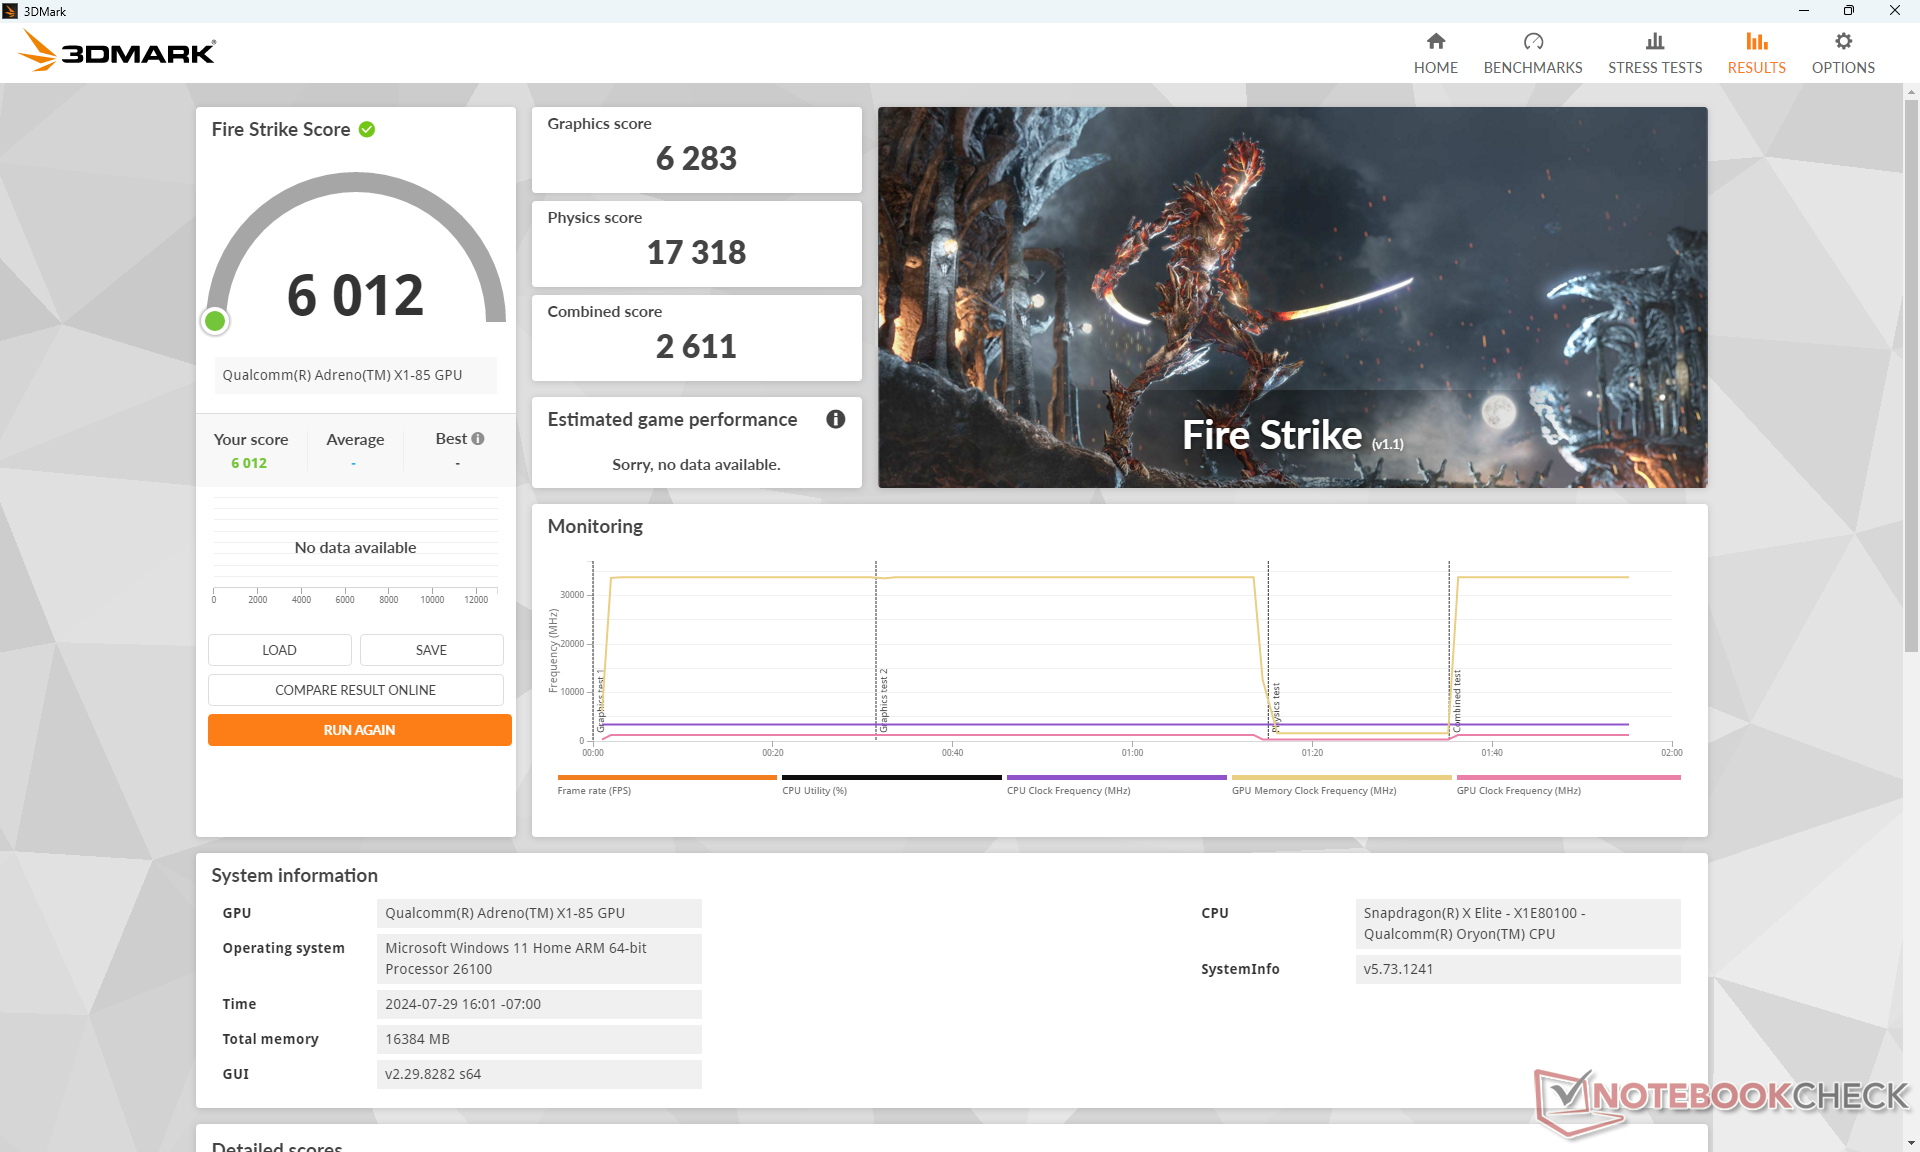
| Профиль мощности | Оценка графики | Оценка физики | Комбинированный балл |
| Режим производительности | 6283 | 17318 | 2611 |
| Сбалансированный режим | 6209 | 18348 | 2643 |
| Питание от аккумулятора | 6287 | 18156 | 2687 |
При переключении между режимами "Производительность", "Сбалансированный" или "Питание от батареи" значительного снижения производительности не наблюдается, как показано в таблице результатов Fire Strike выше.
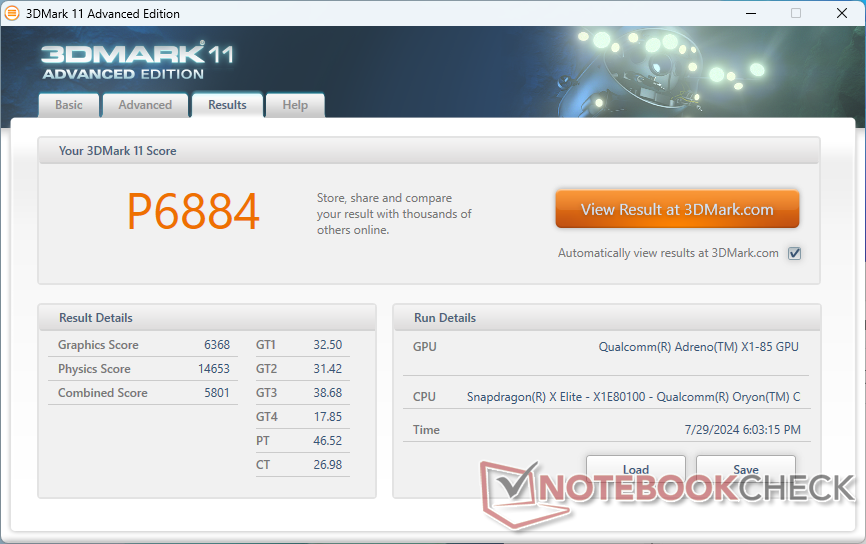
| 3DMark 11 Performance | 6884 баллов | |
| 3DMark Cloud Gate Standard Score | 24813 баллов | |
| 3DMark Fire Strike Score | 6012 баллов | |
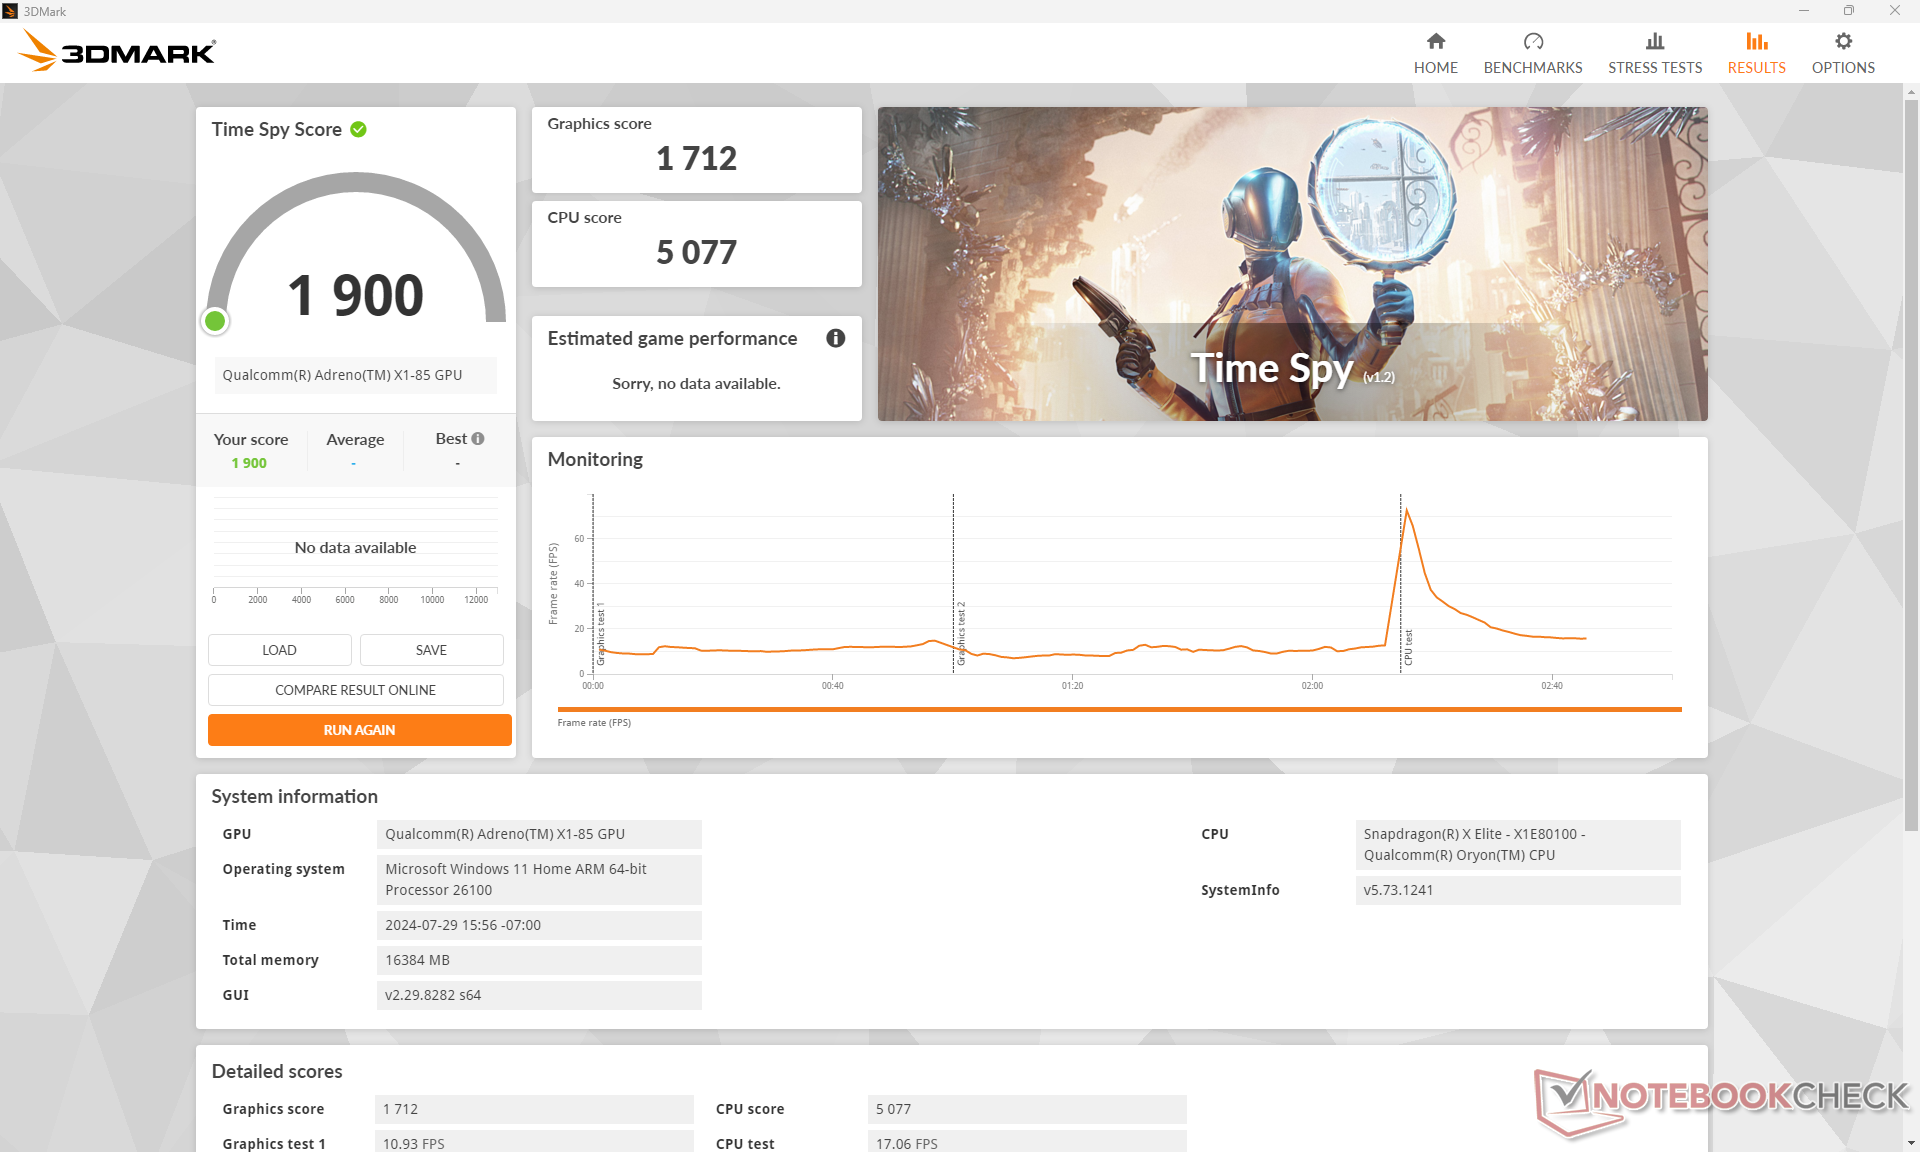
| 3DMark Time Spy Score | 1900 баллов | |
? | ||
* ... меньше = лучше
Игры
Наши немного более высокие результаты в 3DMark по сравнению с EliteBook Ultra G1q 14 означают немного более высокую производительность в протестированных ниже играх. Интересно, что некоторые игры запускались на нашем устройстве Dell, но не запускались на нашем устройстве HP, и наоборот. Например, Far Cry 5 запускается на Dell, но не на HP, а Baldur's Gate 3 запускается на HP, но не на Dell, независимо от режима DirectX. Такое расхождение может быть связано с различиями в драйверах двух моделей, но это также показывает, что над графическим драйвером нужно еще поработать.
| Performance Rating - Percent | |
| Lenovo ThinkBook 13x G4 21KR0008GE -2! | |
| Dell XPS 13 9340 Core Ultra 7 -2! | |
| Dell XPS 13 9345 | |
| Microsoft Surface Laptop 7 13.8 Copilot+ -2! | |
| HP EliteBook Ultra G1q 14 -1! | |
| Asus ZenBook S13 OLED UX5304 -1! | |
| The Witcher 3 - 1920x1080 Ultra Graphics & Postprocessing (HBAO+) | |
| Lenovo ThinkBook 13x G4 21KR0008GE | |
| Dell XPS 13 9340 Core Ultra 7 | |
| Dell XPS 13 9345 | |
| HP EliteBook Ultra G1q 14 | |
| Asus ZenBook S13 OLED UX5304 | |
| GTA V - 1920x1080 Highest Settings possible AA:4xMSAA + FX AF:16x | |
| Microsoft Surface Laptop 7 13.8 Copilot+ | |
| Dell XPS 13 9345 | |
| Lenovo ThinkBook 13x G4 21KR0008GE | |
| Dell XPS 13 9340 Core Ultra 7 | |
| Asus ZenBook S13 OLED UX5304 | |
| Final Fantasy XV Benchmark - 1920x1080 High Quality | |
| Dell XPS 13 9340 Core Ultra 7 | |
| Lenovo ThinkBook 13x G4 21KR0008GE | |
| Microsoft Surface Laptop 7 13.8 Copilot+ | |
| Dell XPS 13 9345 | |
| Asus ZenBook S13 OLED UX5304 | |
| HP EliteBook Ultra G1q 14 | |
| Strange Brigade - 1920x1080 ultra AA:ultra AF:16 | |
| Lenovo ThinkBook 13x G4 21KR0008GE | |
| Dell XPS 13 9340 Core Ultra 7 | |
| Microsoft Surface Laptop 7 13.8 Copilot+ | |
| Dell XPS 13 9345 | |
| HP EliteBook Ultra G1q 14 | |
| Asus ZenBook S13 OLED UX5304 | |
| Dota 2 Reborn - 1920x1080 ultra (3/3) best looking | |
| Dell XPS 13 9340 Core Ultra 7 | |
| Lenovo ThinkBook 13x G4 21KR0008GE | |
| Microsoft Surface Laptop 7 13.8 Copilot+ | |
| Asus ZenBook S13 OLED UX5304 | |
| Dell XPS 13 9345 | |
| HP EliteBook Ultra G1q 14 | |
| Tiny Tina's Wonderlands - 1920x1080 Badass Preset (DX12) | |
| Dell XPS 13 9345 | |
| HP EliteBook Ultra G1q 14 | |
| F1 22 - 1920x1080 High Preset AA:T AF:16x | |
| Dell XPS 13 9345 | |
| Microsoft Surface Laptop 7 13.8 Copilot+ | |
| HP EliteBook Ultra G1q 14 | |
| Asus ZenBook S13 OLED UX5304 | |
| Tiny Tina's Wonderlands | |
| 1280x720 Lowest Preset (DX12) | |
| Dell XPS 13 9345 | |
| Усредн. модель с Qualcomm SD X Adreno X1-85 3.8 TFLOPS (67.6 - 73.9, n=3) | |
| HP EliteBook Ultra G1q 14 | |
| Dell XPS 13 Plus 9320 Core i7-1360P | |
| 1920x1080 Low Preset (DX12) | |
| Dell XPS 13 9345 | |
| Усредн. модель с Qualcomm SD X Adreno X1-85 3.8 TFLOPS (41.5 - 44.7, n=3) | |
| HP EliteBook Ultra G1q 14 | |
| Dell XPS 13 Plus 9320 Core i7-1360P | |
| 1920x1080 Medium Preset (DX12) | |
| Dell XPS 13 9345 | |
| Усредн. модель с Qualcomm SD X Adreno X1-85 3.8 TFLOPS (30.8 - 33.7, n=3) | |
| HP EliteBook Ultra G1q 14 | |
| Dell XPS 13 Plus 9320 Core i7-1360P | |
| 1920x1080 High Preset (DX12) | |
| Dell XPS 13 9345 | |
| Усредн. модель с Qualcomm SD X Adreno X1-85 3.8 TFLOPS (20.6 - 22.4, n=3) | |
| HP EliteBook Ultra G1q 14 | |
| Dell XPS 13 Plus 9320 Core i7-1360P | |
| 1920x1080 Badass Preset (DX12) | |
| Dell XPS 13 9345 | |
| Усредн. модель с Qualcomm SD X Adreno X1-85 3.8 TFLOPS (16.8 - 18, n=3) | |
| HP EliteBook Ultra G1q 14 | |
| Dell XPS 13 Plus 9320 Core i7-1360P | |
Частота кадров, Cyberpunk 2077
| мин. | сред. | выс. | макс. | |
|---|---|---|---|---|
| GTA V (2015) | 96.3 | 94.2 | 49.5 | 21.2 |
| The Witcher 3 (2015) | 104 | 74.5 | 43.7 | 19.2 |
| Dota 2 Reborn (2015) | 80 | 60.7 | 57.4 | 50.7 |
| Final Fantasy XV Benchmark (2018) | 56.1 | 25 | 15.8 | |
| X-Plane 11.11 (2018) | 38 | |||
| Far Cry 5 (2018) | 42 | 33 | 31 | 28 |
| Strange Brigade (2018) | 123.9 | 50.8 | 41.8 | 33.9 |
| Tiny Tina's Wonderlands (2022) | 44.5 | 33.6 | 22.4 | 18 |
| F1 22 (2022) | 62.9 | 55.4 | 38.5 | |
| Cyberpunk 2077 2.2 Phantom Liberty (2023) | 24.1 | 19.5 | 16.9 | 14.7 |
Температурные и акустические показатели
Система охлаждения - Вентилятор работает спокойнее
Шум вентилятора немного тише, чем у Модель Intel Core Ultra 7 в том смысле, что внутренние вентиляторы медленнее набирают обороты в ответ на увеличение нагрузки. В противном случае, при длительной работе с высокими нагрузками вентиляторы обеих моделей устанавливаются на одинаковых максимальных оборотах. Например, шум вентиляторов достигает 32,8 дБ(A) к концу первой 90-секундной сцены бенчмарка 3DMark 06 по сравнению с 37,4 дБ(A) на модели Intel при аналогичных условиях. Однако при запуске таких игр, как Cyberpunk 2077, обе модели останавливались на отметке 40 дБ(А). Система на базе Qualcomm не обязательно работает тише при высоких нагрузках, но Вы также с меньшей вероятностью заметите активность вентилятора при просмотре веб-страниц или потокового видео.
Уровень шума
| Ожидание |
| 22.9 / 22.9 / 22.9 дБ |
| Нагрузка |
| 32.8 / 40.6 дБ |
 | ||
30 dB бесшумно 40 dB(A) различимо 50 dB(A) громко |
||
min: | ||
| Dell XPS 13 9345 Adreno X1-85 3.8 TFLOPS, SD X Elite X1E-80-100 | Dell XPS 13 9340 Core Ultra 7 Arc 8-Core, Ultra 7 155H, Micron 2550 512GB | Microsoft Surface Laptop 7 13.8 Copilot+ Adreno X1-85 3.8 TFLOPS, SD X Elite X1E-80-100, Samsung MZ9L4512HBLU-00BMV | Lenovo ThinkBook 13x G4 21KR0008GE Arc 7-Core, Ultra 5 125H, Samsung PM9C1a MZAL8512HDLU | HP EliteBook Ultra G1q 14 Adreno X1-85 3.8 TFLOPS, SD X Elite X1E-78-100, SK hynix PC801 HFS512GEJ9X101N BF | Asus ZenBook S13 OLED UX5304 Iris Xe G7 96EUs, i7-1355U, Samsung PM9A1 MZVL21T0HCLR | |
|---|---|---|---|---|---|---|
| Уровень шума | -10% | 4% | -7% | 4% | -4% | |
| в выкл. виде (фон) * | 22.9 | 25.1 -10% | 23.8 -4% | 24.5 -7% | 23.4 -2% | 23.3 -2% |
| Мин. в простое * | 22.9 | 25.1 -10% | 23.8 -4% | 24.5 -7% | 23.4 -2% | 23.3 -2% |
| В простое, сред. * | 22.9 | 25.1 -10% | 23.8 -4% | 24.5 -7% | 23.4 -2% | 23.3 -2% |
| В простое, макс. * | 22.9 | 25.1 -10% | 23.8 -4% | 27.1 -18% | 24.3 -6% | 23.3 -2% |
| Нагрузка, сред. * | 32.8 | 37.4 -14% | 26 21% | 33.3 -2% | 25 24% | 37.7 -15% |
| Cyberpunk 2077 ultra * | 40.6 | 31.5 22% | ||||
| Нагрузка, макс. * | 40.6 | 42.5 -5% | 40.3 1% | 40.7 -0% | 34.8 14% | 40.1 1% |
| Witcher 3 ultra * | 42.5 | 36.8 | 30.6 | 40.1 |
* ... меньше = лучше
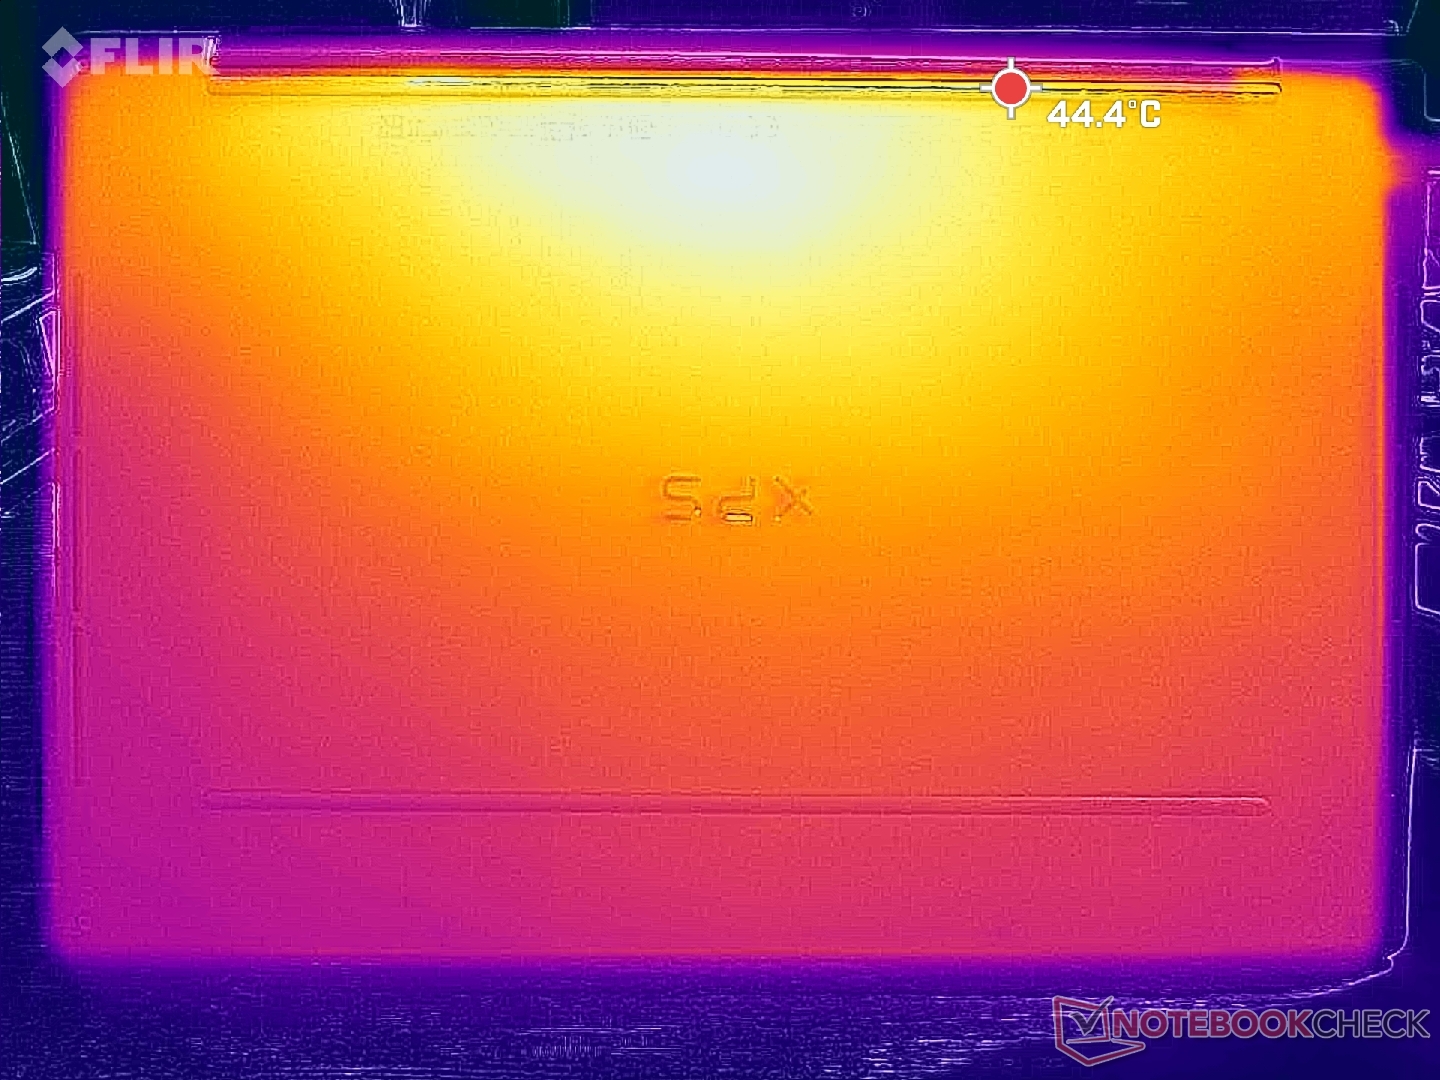
Температура
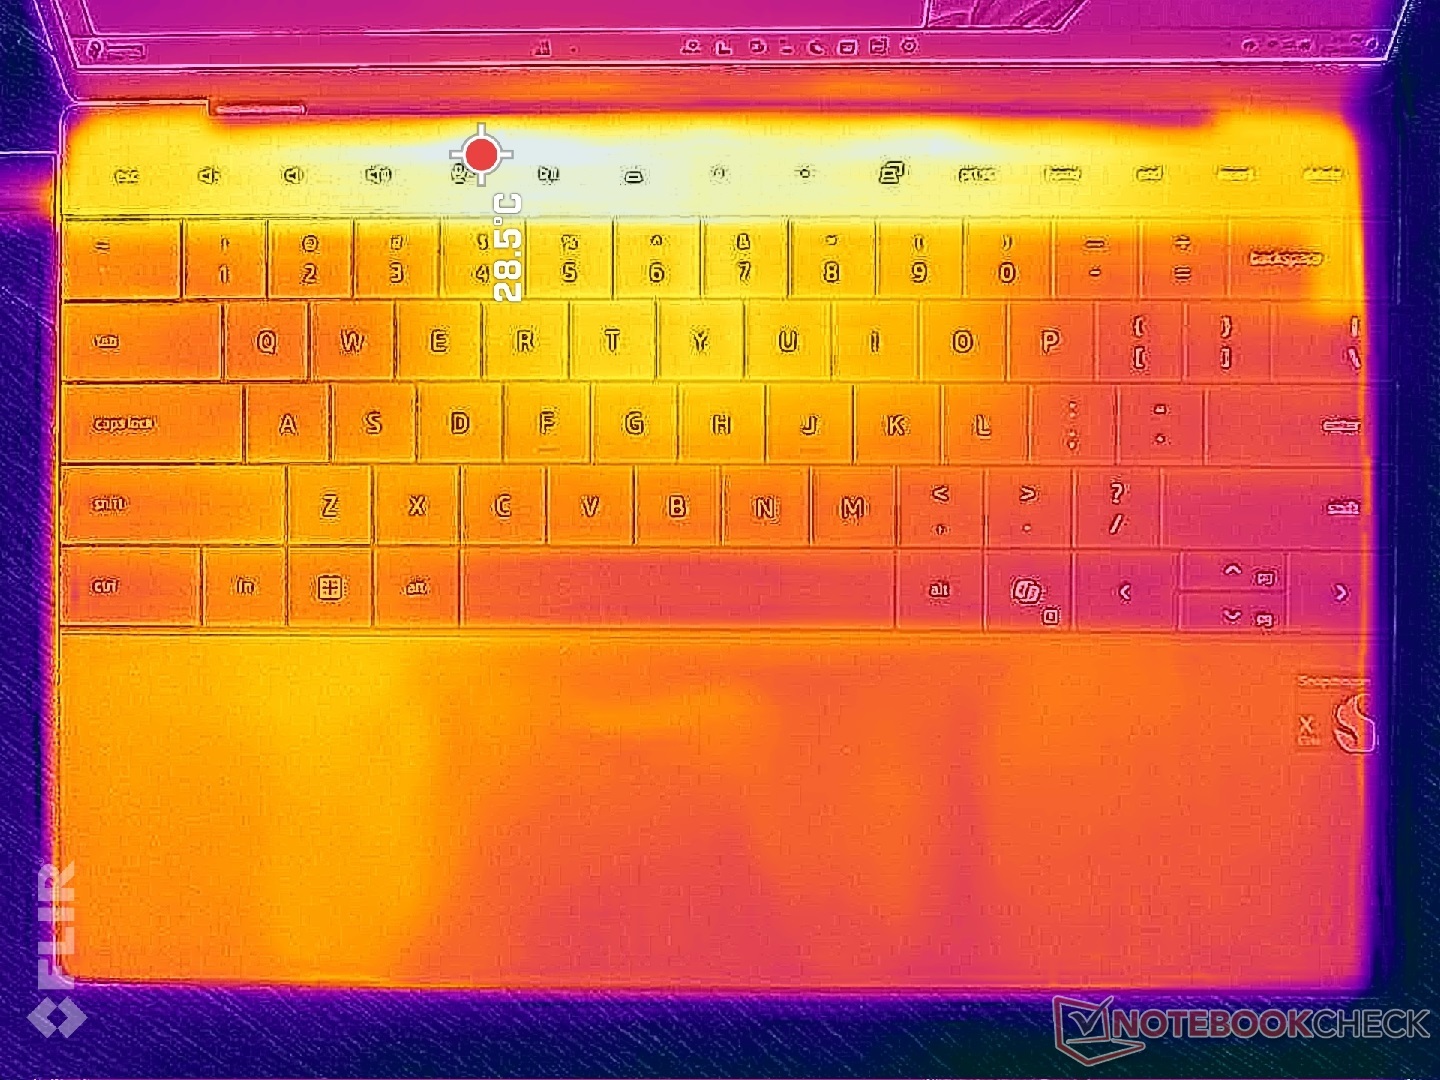
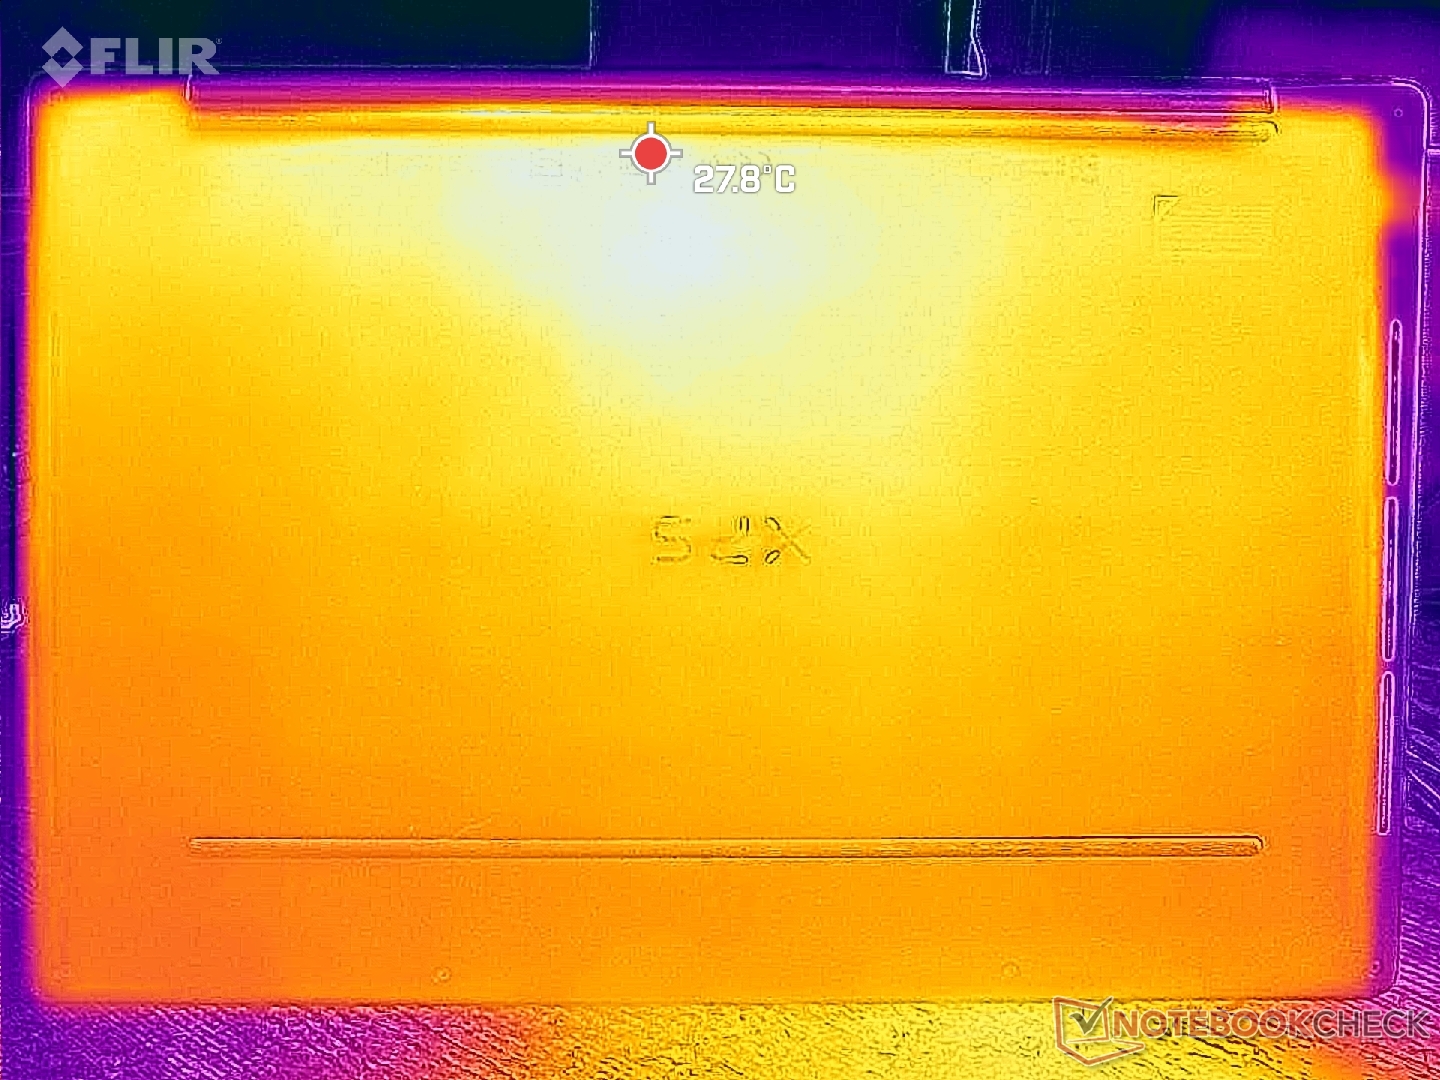
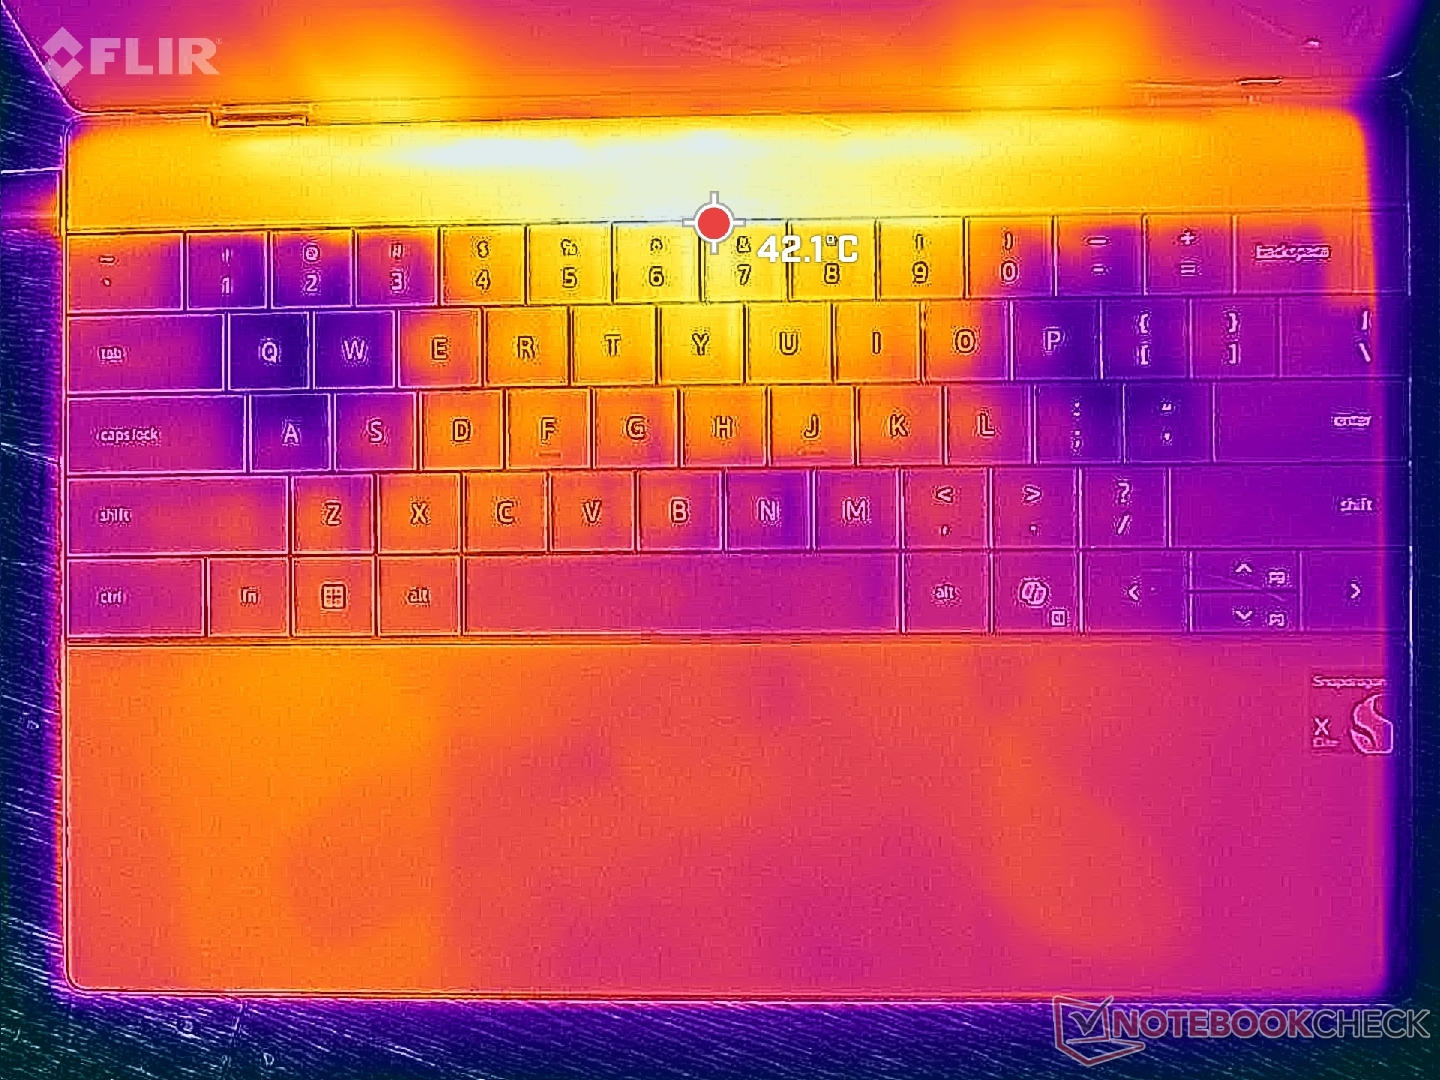
Температура поверхности очень близка к той, которую мы зафиксировали на XPS 13 9340 с процессором Intel, что свидетельствует о том, что модель Qualcomm не работает заметно теплее или холоднее, несмотря на замену процессора. Температура горячих точек в центре системы может достигать 45 C, что аналогично модели Intel, когда обе модели работают под нагрузкой в течение длительного времени. Средние температуры холоднее, чем те, которые мы зафиксировали на Microsoft Surface Laptop 7 13.8 но теплее, чем на HP EliteBook Ultra G1q 14 каждый из которых оснащен аналогичными процессорами Snapdragon Elite.
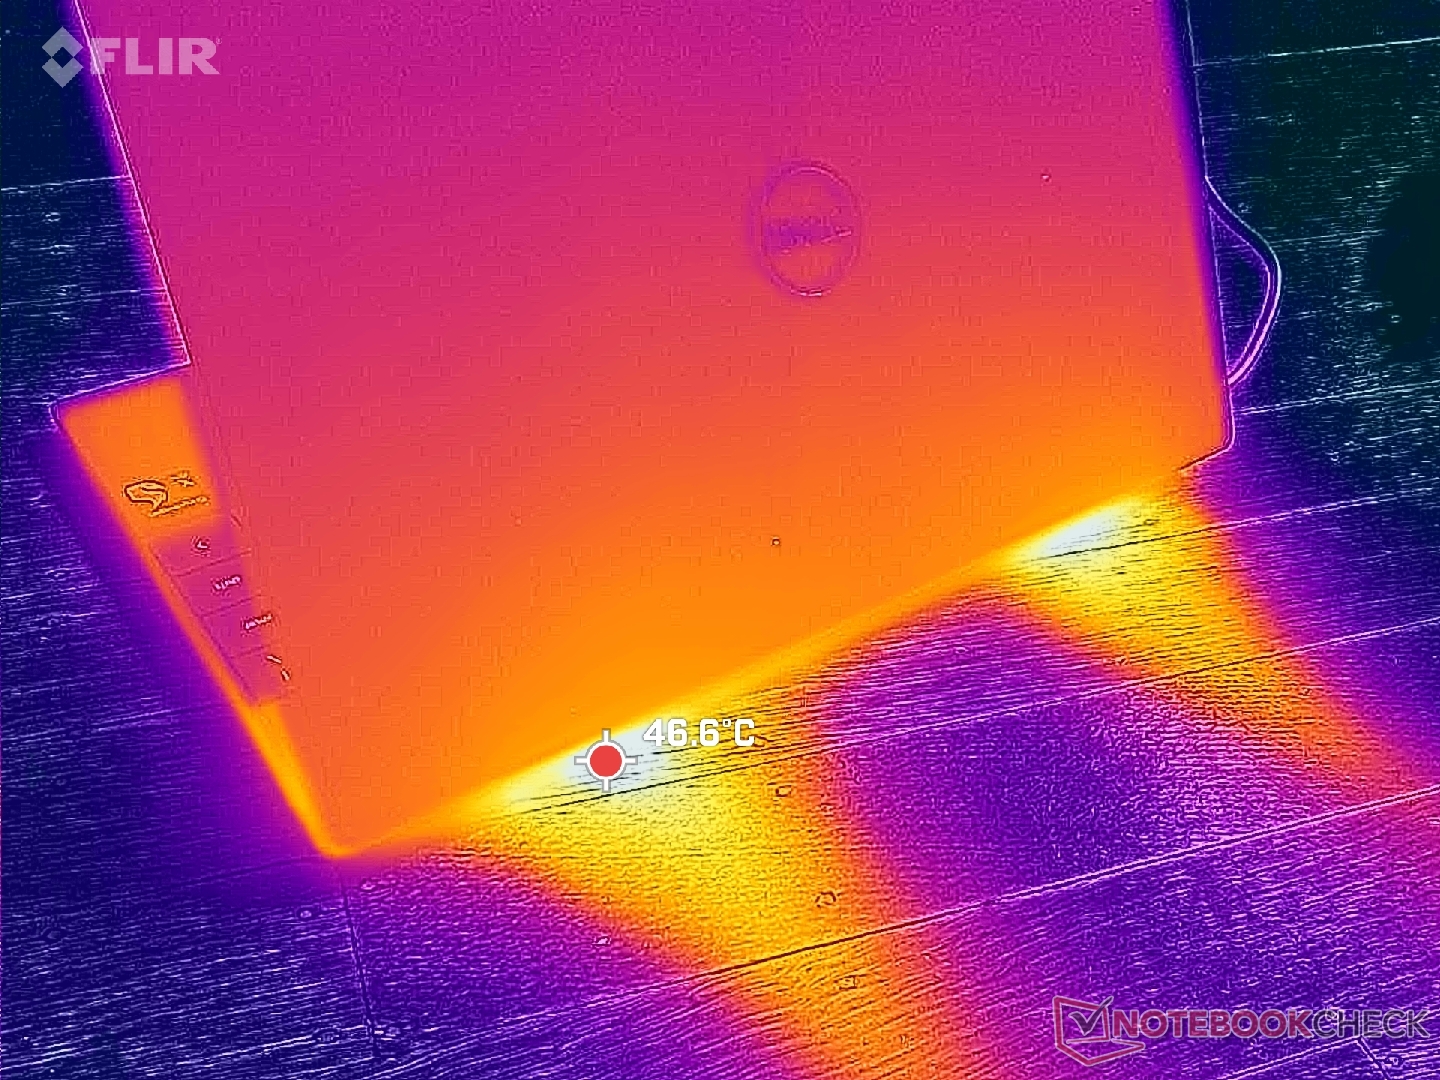
(-) Макс. температура верха корпуса составила 45.2 град. Цельсия. Типичное значение для устройств этого же класса (Subnotebook) = 35.9 градуса (-ов) при минимуме в 21.4 град. и максимуме в 59 град.
(±) Макс. температура дна составила 44.2 град. Цельсия. Типичное значение для устройств этого же класса = 39.3 градуса (-ов).
(+) При отсутствии вычислительной нагрузки верх корпуса нагревается в среднем до 29.1 град. Типичное значение для устройств этого же класса = 30.8 градуса (-ов).
(+) Палуба на ощупь: Умеренно тепло (34.4 град. Цельсия).
(-) Средняя температура палубы у похожих моделей составила 28.2 град. Цельсия, это -6.2 градуса (-ов) разницы.
| Dell XPS 13 9345 Qualcomm Snapdragon X Elite X1E-80-100, Qualcomm SD X Adreno X1-85 3.8 TFLOPS | Dell XPS 13 9340 Core Ultra 7 Intel Core Ultra 7 155H, Intel Arc 8-Core iGPU | Microsoft Surface Laptop 7 13.8 Copilot+ Qualcomm Snapdragon X Elite X1E-80-100, Qualcomm SD X Adreno X1-85 3.8 TFLOPS | Lenovo ThinkBook 13x G4 21KR0008GE Intel Core Ultra 5 125H, Intel Arc 7-Core iGPU | HP EliteBook Ultra G1q 14 Qualcomm Snapdragon X Elite X1E-78-100, Qualcomm SD X Adreno X1-85 3.8 TFLOPS | Asus ZenBook S13 OLED UX5304 Intel Core i7-1355U, Intel Iris Xe Graphics G7 96EUs | |
|---|---|---|---|---|---|---|
| Нагрев | 12% | 9% | 9% | 4% | 6% | |
| Нагрузка, макс. сверху * | 45.2 | 41 9% | 47.1 -4% | 43.1 5% | 40.8 10% | 43.1 5% |
| Нагрузка, макс. на дне * | 44.2 | 43.5 2% | 44.6 -1% | 39.2 11% | 40.4 9% | 45 -2% |
| В простое сверху * | 30.4 | 25.3 17% | 24.7 19% | 28.3 7% | 32.2 -6% | 27.3 10% |
| В простое на дне * | 31.6 | 25.5 19% | 24.5 22% | 28 11% | 31.2 1% | 27.8 12% |
* ... меньше = лучше
Акустическая система
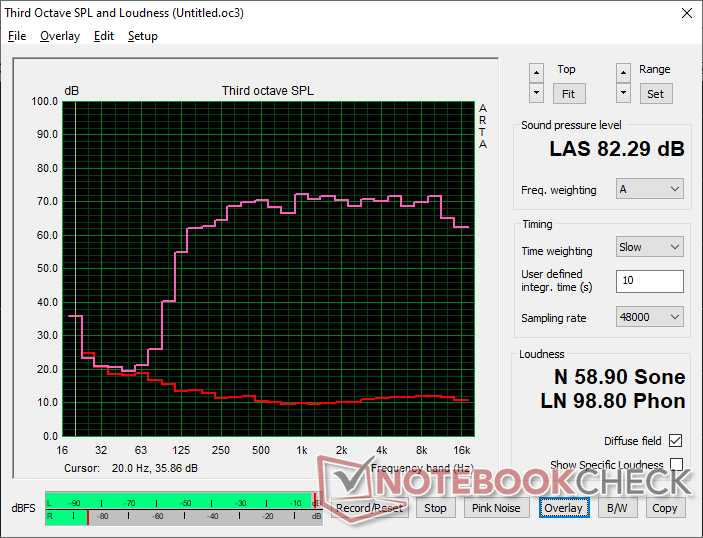
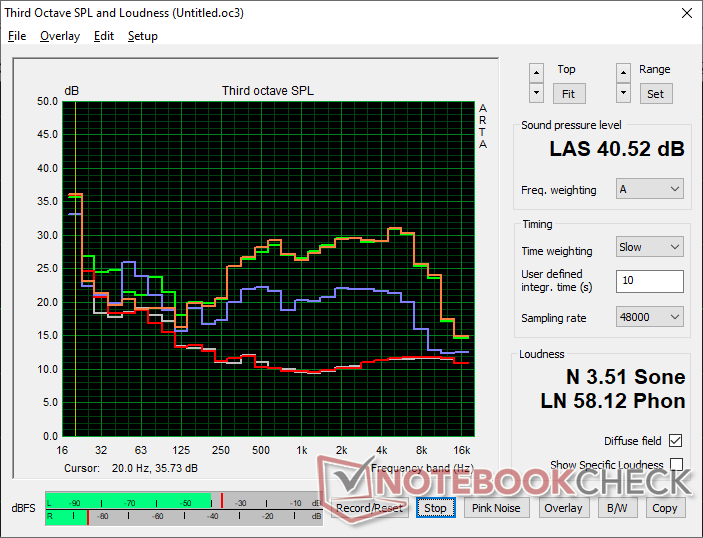
Анализ АЧХ аудиосистемы Dell XPS 13 9345
(+) | отличный уровень макс. громкости (82.3 дБА)
Низкие частоты (100 Гц - 315 Гц)
(±) | баса мало (на 9.9% меньше медианы)
(±) | он умеренно сбалансирован
Средние частоты (400 Гц - 2000 Гц)
(+) | диапазон не провален и не выпячен (отклонение лишь 1.9% от медианы)
(+) | он ровный, без "горбов" или провалов
Высокие частоты (2 кГц - 16 кГц)
(+) | диапазон отлично сбалансирован (отклонение лишь 1.5% от медианы)
(+) | он ровный, без "горбов" или провалов
Весь диапазон (100 - 16000 Гц)
(+) | звук в целом сбалансирован (8.2% отличия от медианы)
в сравнении с устройствами того же класса
» 2% прямо сравнимых устройств показал(и) себя лучше, 1% примерно так же, 97% значительно хуже
» Δ наилучшего устройства из прямо сравнимых: 5%, средняя Δ: 19%, худший результат: 53%
в сравнении со всеми тестированными устройствами
» 1% известных нам устройств показал(и) себя лучше, 1% примерно так же, 98% значительно хуже
» Δ наилучшего устройства среди известных нам: 4%, средняя Δ: 24%, худший результат: 134%
Анализ АЧХ аудиосистемы Apple MacBook Pro 16 2021 M1 Pro
(+) | отличный уровень макс. громкости (84.7 дБА)
Низкие частоты (100 Гц - 315 Гц)
(+) | бас отлично сбалансирован (отклонение лишь 3.8% от медианы)
(+) | он ровный, без "горбов" или провалов
Средние частоты (400 Гц - 2000 Гц)
(+) | диапазон не провален и не выпячен (отклонение лишь 1.3% от медианы)
(+) | он ровный, без "горбов" или провалов
Высокие частоты (2 кГц - 16 кГц)
(+) | диапазон отлично сбалансирован (отклонение лишь 1.9% от медианы)
(+) | он ровный, без "горбов" или провалов
Весь диапазон (100 - 16000 Гц)
(+) | звук в целом сбалансирован (4.6% отличия от медианы)
в сравнении с устройствами того же класса
» 0% прямо сравнимых устройств показал(и) себя лучше, 0% примерно так же, 100% значительно хуже
» Δ наилучшего устройства из прямо сравнимых: 5%, средняя Δ: 18%, худший результат: 45%
в сравнении со всеми тестированными устройствами
» 0% известных нам устройств показал(и) себя лучше, 0% примерно так же, 100% значительно хуже
» Δ наилучшего устройства среди известных нам: 4%, средняя Δ: 24%, худший результат: 134%
Энергопотребление и автономная работа
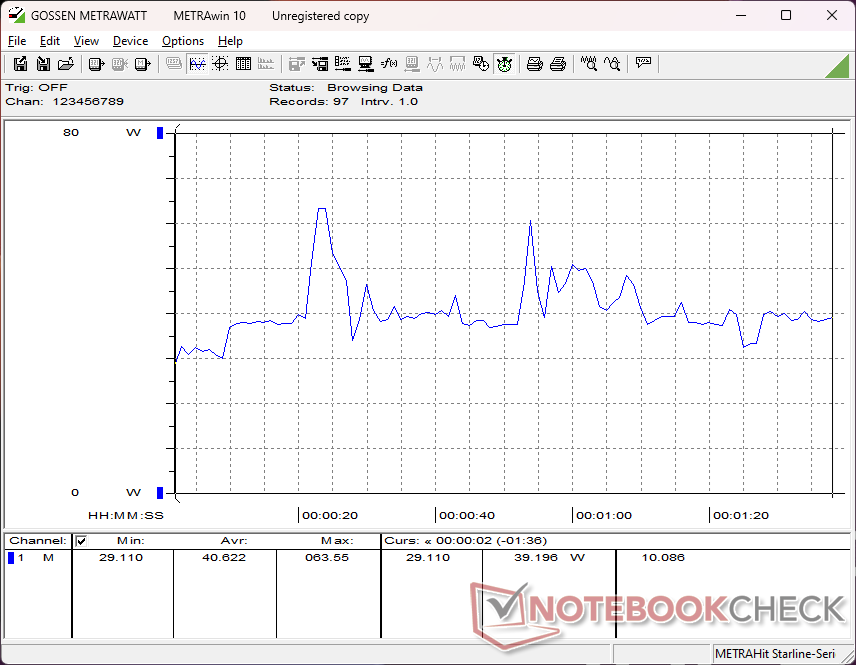
Энергопотребление
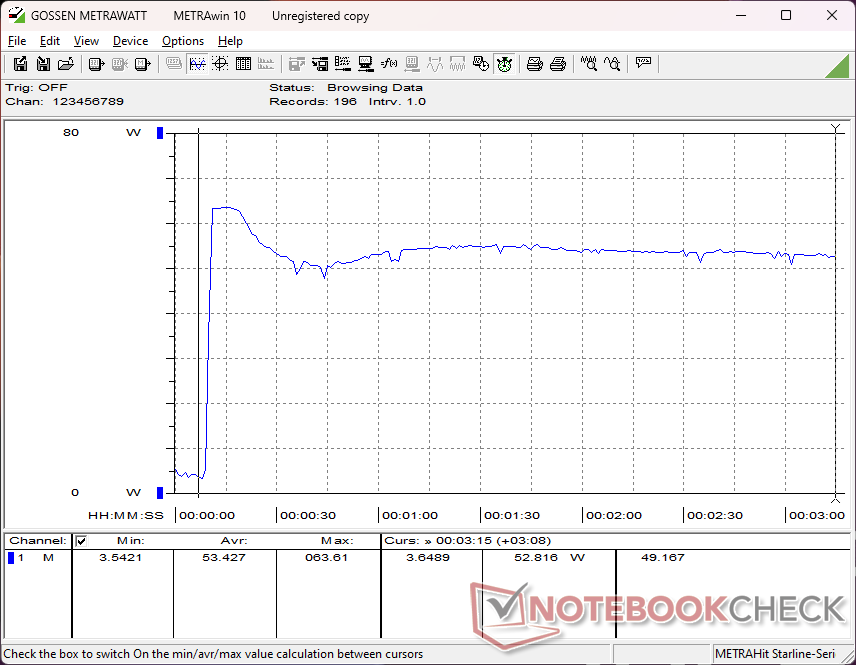
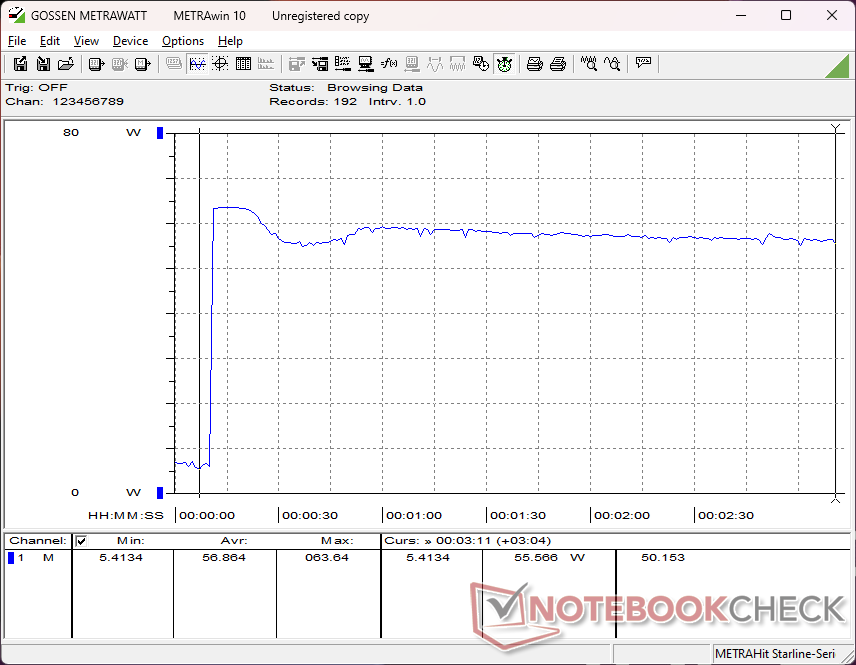
Измерения энергопотребления показывают интересные результаты по сравнению с Core Ultra 7 XPS 13. При средних и низких нагрузках наш Snapdragon XPS 13 потребляет значительно меньше энергии, чем версия Intel, что позволяет увеличить время автономной работы, как показано в следующем разделе ниже. Однако при выполнении более требовательных нагрузок, таких как игры, среднее потребление будет примерно одинаковым - около 40 Вт, даже несмотря на то, что Core Ultra 7 в целом обеспечивает более высокую производительность графики.
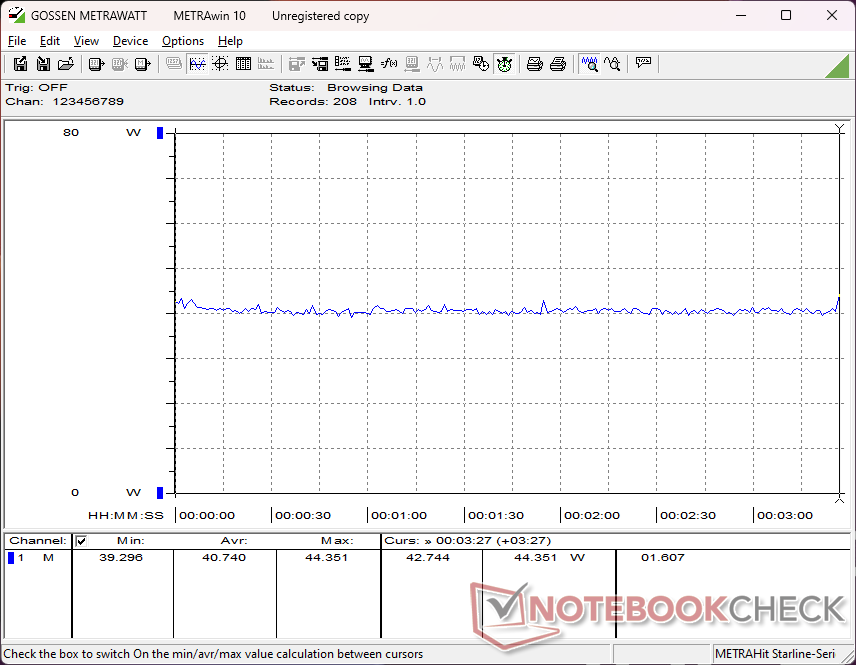
Потребление при запуске Prime95 для нагрузки на процессор показывает, что модель Snapdragon в среднем требует больше энергии, чем модель Intel, поскольку последняя с течением времени дросселируется более резко. С другой стороны, потребление при выполнении FurMark для нагрузки на GPU составляет в среднем всего 18 Вт по сравнению с 34 Вт и выше у модели Intel. Это говорит о том, что Qualcomm, возможно, выделяет меньше площади поверхности или кремниевого бюджета для своего интегрированного GPU, чем конкурирующая серия Arc 8, которая в среднем и мощнее, и требовательнее.
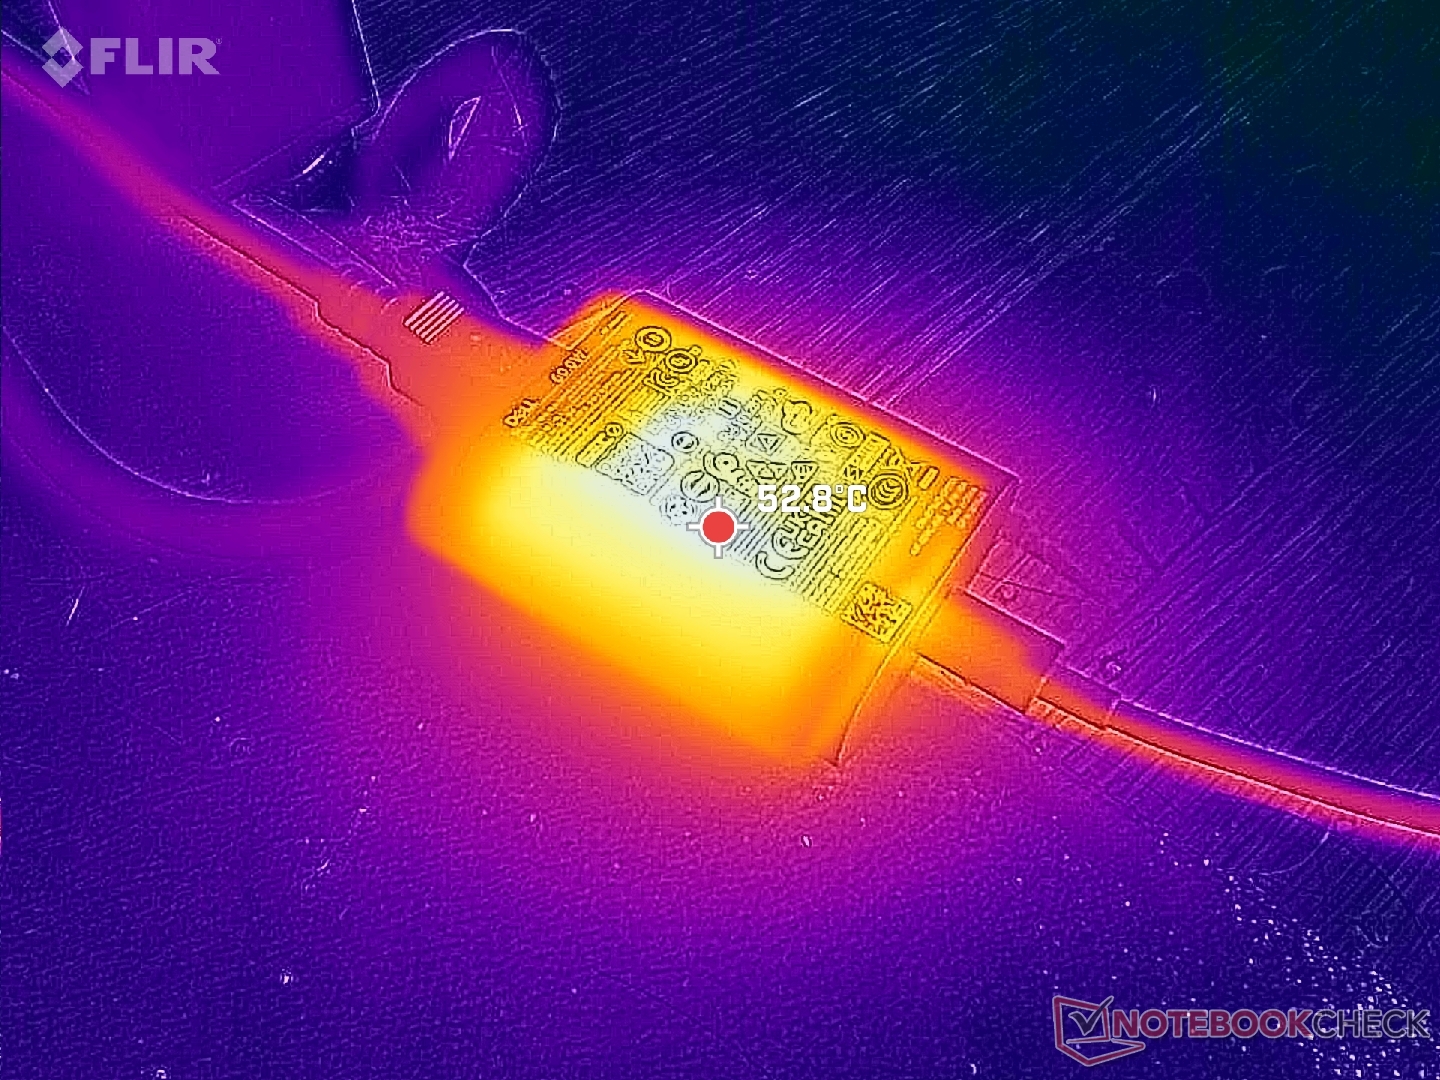
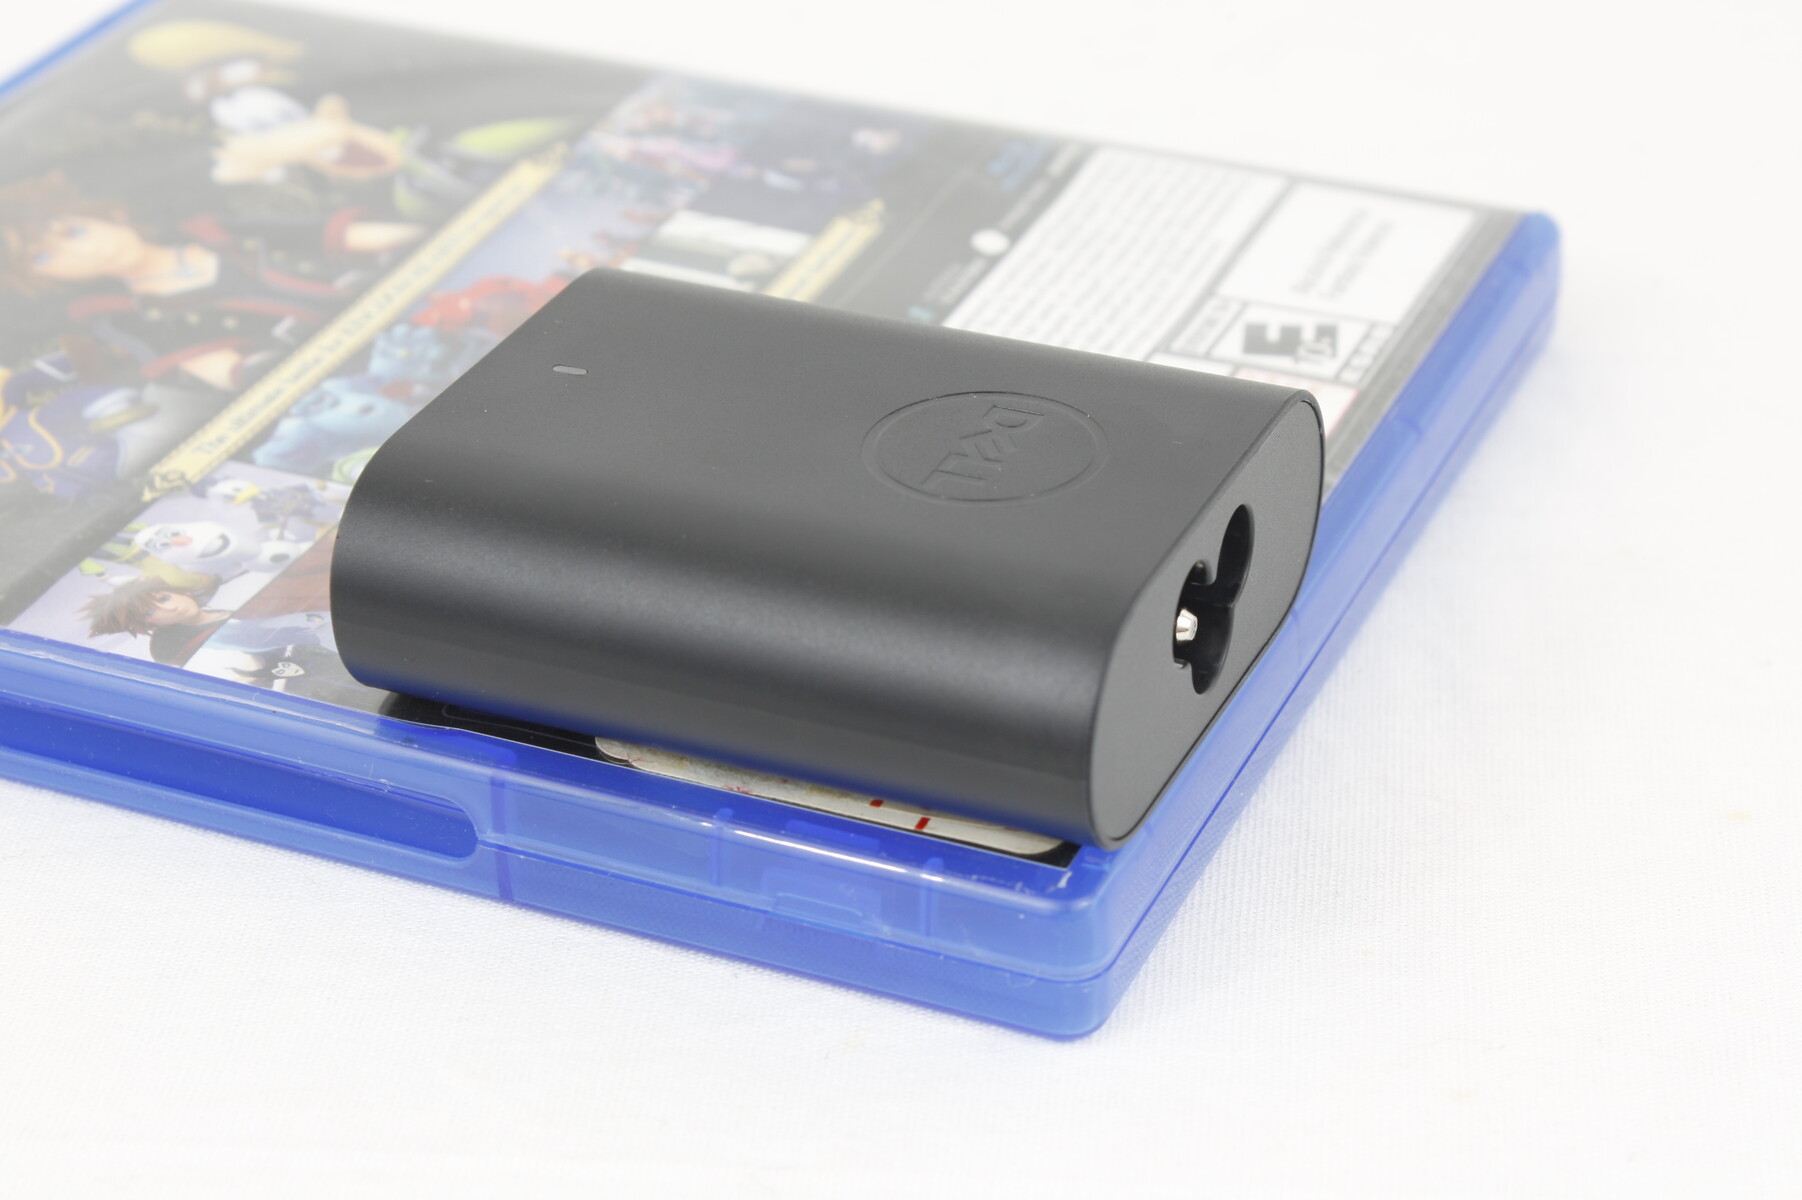
Максимальное потребление может достигать 64 Вт от сверхмалого (~6,5 x 5,5 x 2,3 см) адаптера переменного тока USB-C мощностью 65 Вт, как и у модели Intel.
| Выкл. | |
| Ожидание | |
| Нагрузка |
|
Легенда:
min: | |
| Dell XPS 13 9345 SD X Elite X1E-80-100, Adreno X1-85 3.8 TFLOPS, , IPS, 1920x1200, 13.4" | Dell XPS 13 9340 Core Ultra 7 Ultra 7 155H, Arc 8-Core, Micron 2550 512GB, IPS, 1920x1200, 13.4" | Microsoft Surface Laptop 7 13.8 Copilot+ SD X Elite X1E-80-100, Adreno X1-85 3.8 TFLOPS, Samsung MZ9L4512HBLU-00BMV, IPS, 2304x1536, 13.8" | Lenovo ThinkBook 13x G4 21KR0008GE Ultra 5 125H, Arc 7-Core, Samsung PM9C1a MZAL8512HDLU, IPS, 2880x1920, 13.5" | HP EliteBook Ultra G1q 14 SD X Elite X1E-78-100, Adreno X1-85 3.8 TFLOPS, SK hynix PC801 HFS512GEJ9X101N BF, IPS, 2240x1400, 14" | Asus ZenBook S13 OLED UX5304 i7-1355U, Iris Xe G7 96EUs, Samsung PM9A1 MZVL21T0HCLR, OLED, 2880x1800, 13.3" | |
|---|---|---|---|---|---|---|
| Энергопотребление | -27% | 11% | -48% | 11% | -43% | |
| В простое, мин. * | 2.8 | 3.8 -36% | 1.4 50% | 5.4 -93% | 2.5 11% | 5.8 -107% |
| В простое, сред. * | 4.9 | 7 -43% | 6.3 -29% | 7.8 -59% | 5.7 -16% | 8.5 -73% |
| В простое, макс. * | 5.7 | 7.3 -28% | 7.6 -33% | 8.9 -56% | 5.8 -2% | 8.8 -54% |
| Нагрузка, сред. * | 40.6 | 52.6 -30% | 26.9 34% | 49.4 -22% | 24.2 40% | 35.1 14% |
| Cyberpunk 2077 ultra external monitor * | 39.4 | 26.8 32% | ||||
| Cyberpunk 2077 ultra * | 40.7 | 38.5 5% | 33.5 18% | |||
| Нагрузка, макс. * | 64 | 62.7 2% | 40.7 36% | 68.8 -8% | 66.4 -4% | 59.5 7% |
| Witcher 3 ultra * | 38.3 | 44.4 | 23.1 | 27.6 |
* ... меньше = лучше
Энергопотребление: Cyberpunk 2077, Стресс-тест
Энергопотребление с внешним монитором
Автономность
Если и есть что-то, в чем система однозначно преуспевает, так это время автономной работы. Нам удалось зафиксировать время работы в реальном мире в режиме просмотра WLAN почти 26,5 часов, что более чем в 2 раза превышает время работы XPS 13 9340, оснащенного Core Ultra 7 155H и идентичным IPS-дисплеем с разрешением 1200p. Время работы гарантированно будет короче, если вместо него использовать OLED-панель, но, тем не менее, оно будет невероятно долгим и одним из самых долгих среди всех 13-дюймовых субноутбуков, включая даже модели серии Серию MacBook Air.
Наш тест был проведен после применения последнего обновления BIOS от Dell, которое было специально разработано для улучшения времени автономной работы модели с процессором Snapdragon. Мы рекомендуем установить обновление здесь.
Зарядка от пустого до полного аккумулятора занимает чуть более 90 минут, что характерно для большинства ноутбуков.
| Dell XPS 13 9345 SD X Elite X1E-80-100, Adreno X1-85 3.8 TFLOPS, 55 Вт⋅ч | Dell XPS 13 9340 Core Ultra 7 Ultra 7 155H, Arc 8-Core, 55 Вт⋅ч | Microsoft Surface Laptop 7 13.8 Copilot+ SD X Elite X1E-80-100, Adreno X1-85 3.8 TFLOPS, 54 Вт⋅ч | Lenovo ThinkBook 13x G4 21KR0008GE Ultra 5 125H, Arc 7-Core, 74 Вт⋅ч | HP EliteBook Ultra G1q 14 SD X Elite X1E-78-100, Adreno X1-85 3.8 TFLOPS, 59 Вт⋅ч | Asus ZenBook S13 OLED UX5304 i7-1355U, Iris Xe G7 96EUs, 63 Вт⋅ч | |
|---|---|---|---|---|---|---|
| Время работы | 40% | -3% | 24% | 4% | 50% | |
| В простое | 2785 | 1222 -56% | ||||
| Чтение сайтов по Wi-Fi v.2 | 1585 | 769 -51% | 852 -46% | 684 -57% | 792 -50% | 678 -57% |
| Нагрузка и 100% яркости | 57 | 131 130% | 80 40% | 116 104% | 124 118% | 146 156% |
| Воспр. видео H.264 | 1053 | 1181 | 1229 | 829 |
За
Против
Вердикт - Достойная альтернатива Intel XPS 13
Snapdragon XPS 13 за $1300 стоит немного дешевле, чем Snapdragon XPS 13 за $1400 Core Ultra 7 XPS 13 при этом предлагая значительно большее время автономной работы, интеграцию Co-Pilot+ и идентичные аппаратные возможности. Однако реальные впечатления пользователя будут в значительной степени зависеть от рабочей нагрузки и приложений. Если ноутбук используется в основном для просмотра веб-страниц, обработки текстов, видео и потоковой передачи, то Snapdragon XPS 13 будет более эффективным, особенно если программы могут работать на ARM. С другой стороны, более требовательные задачи, такие как редактирование графики, кодирование видео, стыковка с Thunderbolt или специфические приложения, которые должны быть эмулированы на ARM, лучше всего подойдут для традиционного Intel XPS 13. Таким образом, модель Intel обеспечивает более предсказуемый уровень производительности во всех сценариях использования, что, возможно, перевешивает те немногие граничные случаи, в которых модель Snapdragon может оказаться впереди.
Snapdragon XPS 13 - отличная альтернатива Intel XPS 13 по соотношению цена/качество. Однако пользовательский опыт будет сильно различаться в зависимости от того, для каких приложений и задач Вы собираетесь использовать систему.
Преимущество во времени автономной работы и совместимость с Co-Pilot+ могут оказаться недостаточными, чтобы убедить покупателей, когда время автономной работы Intel XPS 13 уже довольно хорошее, а Co-Pilot+, как ожидается, появится в будущих процессорах Intel и AMD. Тем не менее, пользователи, которые хотят максимально увеличить время работы и использовать новейшие функции Microsoft AI уже сегодня, могут счесть Snapdragon XPS 13 более продуктивным вариантом.
Примечание: Недавно мы обновили нашу систему рейтингов, и результаты 8-й версии не сравнимы с результатами 7-й версии. Дополнительная информация доступна здесь .
Dell XPS 13 9345
- 04 August 2024 v8
Allen Ngo
 Total Sustainability Score:
 Декларация о непредвзятости
Отбор устройств для обзора осуществляется нашей редакцией. Тестовый образец был предоставлен автору производителем или продавцом для целей настоящего обзора. Кредитор не имел никакого влияния на этот обзор, и производитель не получил копию этого обзора до публикации. Обязанности публиковать этот обзор не было. Мы никогда не принимаем компенсацию или оплату в обмен на наши отзывы. Являясь независимой медиа-компанией, Notebookcheck не подчиняется власти производителей, розничных продавцов или издателей.
Вот как проводит тестирование Notebookcheck
Каждый год Notebookcheck независимо проверяет сотни ноутбуков и смартфонов, используя стандартизированные процедуры, чтобы гарантировать сопоставимость всех результатов. В течение примерно 20 лет мы постоянно совершенствовали наши методы испытаний и при этом установили отраслевые стандарты. В наших испытательных лабораториях опытные специалисты и редакторы используют высококачественное измерительное оборудование. Эти тесты включают в себя многоэтапный процесс проверки. Наша сложная рейтинговая система основана на сотнях обоснованных измерений и критериев, что обеспечивает объективность.
Price comparison

