

Обзор MSI Summit E13 AI Evo: Серьезные проблемы с троттлингом Core Ultra 7
Слишком быстрый, приходится притормаживать.
Новый Summit E13 A1MTG показывает, что происходит, когда Core Ultra-H устанавливают в ноутбук, изначально предназначенный для чипов серии Core-U. По характеристикам модель выглядит довольно мощной, однако на троттлинг и нагрев в данном случае закрыть глаза не выйдет.Allen Ngo, 👁 Allen Ngo (перевод DeepL) Опубликовано 🇺🇸 🇫🇷 ...
Вердикт - Один шаг вперед и два шага назад
Ноутбук Summit E13 AI Evo A1MTG может показаться понижением по сравнению со своим предшественником. На бумаге процессор Core Ultra H звучит хорошо, но на практике он дросселируется гораздо быстрее и резче, чем большинство других ноутбуков с аналогичным процессором, поскольку Summit E13 изначально был разработан для процессоров ULV Core U-серии. Новая модель, безусловно, быстрее оригинальной версии 2021 года, но разница не так велика, как могла бы быть, учитывая наш опыт работы с другими ноутбуками на базе Core Ultra H, такими как Framework Laptop 13.5. Такие аспекты, как время автономной работы и температура ядра, также страдают от смены процессора.
Среди других разочаровывающих изменений - меньшее количество портов USB-C и удаление устройства чтения MicroSD. Даже базовый IPS-дисплей был понижен со 120 Гц до 60 Гц без улучшения медленного времени отклика черно-белого изображения.
Возможно, настало время для редизайна корпуса теперь, когда Summit E13 приближается к четырем годам. Процессор Core Ultra-H помогает выделить эту модель MSI среди других 13-дюймовых кабриолетов, но с его реализацией можно было бы справиться лучше, улучшив в первую очередь систему охлаждения для поддержки более высоких требований к процессору. Более высокие, чем средние, температуры и шум вентилятора свидетельствуют о том, что система охлаждения изо всех сил старается удержать новый процессор на плаву.
За
Против
Соперник
Изображение | Модель / Обзор | Цена | Вес | Height | Экран |
|---|---|---|---|---|---|
1. 78.6% 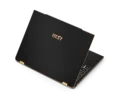 | MSI Summit E13 AI Evo A1MTG Intel Core Ultra 7 155H ⎘ Intel Arc 8-Core iGPU ⎘ 16 Гбайт ОЗУ, 1024 Гбайт SSD | Amazon: $1,099.00 Прейскурантная цена: 1100 USD | 1.3 килог. | 16.2 мм | 13.30" 1920x1200 170 PPI IPS |
2. 86.9% v7 (old)  | MSI Summit E13 Flip Evo A11MT Intel Core i7-1185G7 ⎘ Intel Iris Xe Graphics G7 96EUs ⎘ 32 Гбайт ОЗУ, 1024 Гбайт SSD | Amazon: 1. $978.73 MSI Summit E13 Flip Evo (202... 2. $1,599.00 MSI Summit E13 Flip Evo Busi... 3. $899.00 MSI Summit E13 Flip Evo Prof... Прейскурантная цена: 1900 USD | 1.4 килог. | 14.9 мм | 13.40" 1920x1200 169 PPI IPS |
3. 87% v7 (old)  | Lenovo Yoga Book 9 13IMU9 Intel Core Ultra 7 155U ⎘ Intel Graphics 4-Core iGPU (Arc) ⎘ 16 Гбайт ОЗУ | Amazon: $2,500.00 Прейскурантная цена: 2000 USD | 1.4 килог. | 15.95 мм | 13.30" 2880x1800 255 PPI OLED |
4. 88.1% v7 (old)  | Lenovo ThinkPad L13 Yoga G4 i7-1355U Intel Core i7-1355U ⎘ Intel Iris Xe Graphics G7 96EUs ⎘ 16 Гбайт ОЗУ, 512 Гбайт SSD | Amazon: 1. $1,990.98 Lenovo ThinkPad L13 Yoga Gen... 2. $899.98 Lenovo ThinkPad T14 Gen 5 Bu... 3. $1,369.00 Lenovo ThinkPad T14 G4 Home ... Прейскурантная цена: 1589 USD | 1.4 килог. | 17.1 мм | 13.30" 1920x1200 170 PPI IPS |
5. 90.3% v7 (old)  | HP Elite Dragonfly Folio 13.5 G3 Intel Core i7-1265U ⎘ Intel Iris Xe Graphics G7 96EUs ⎘ 16 Гбайт ОЗУ, 512 Гбайт SSD | Amazon: 1. $39.99 Smatree Hard EVA Protective ... 2. $28.99 Vaxson Privacy Screen Protec... 3. $19.99 New Slim 65W USB C Laptop Ch... Прейскурантная цена: 3900 USD | 1.4 килог. | 17.8 мм | 13.50" 1920x1280 171 PPI IPS |
6. 89% v7 (old)  | Dell Latitude 9330 Intel Core i7-1260U ⎘ Intel Iris Xe Graphics G7 96EUs ⎘ 16 Гбайт ОЗУ | Amazon: 1. $25.99 65W USB C Charger Genuine Re... 2. $42.93 Berfea Protective Cover Case... 3. $49.99 Smatree 13 inch Laptop Sleev... | 1.2 килог. | 14.1 мм | 13.30" 2560x1600 227 PPI IPS |
Оглавление
- Вердикт - Один шаг вперед и два шага назад
- Характеристики
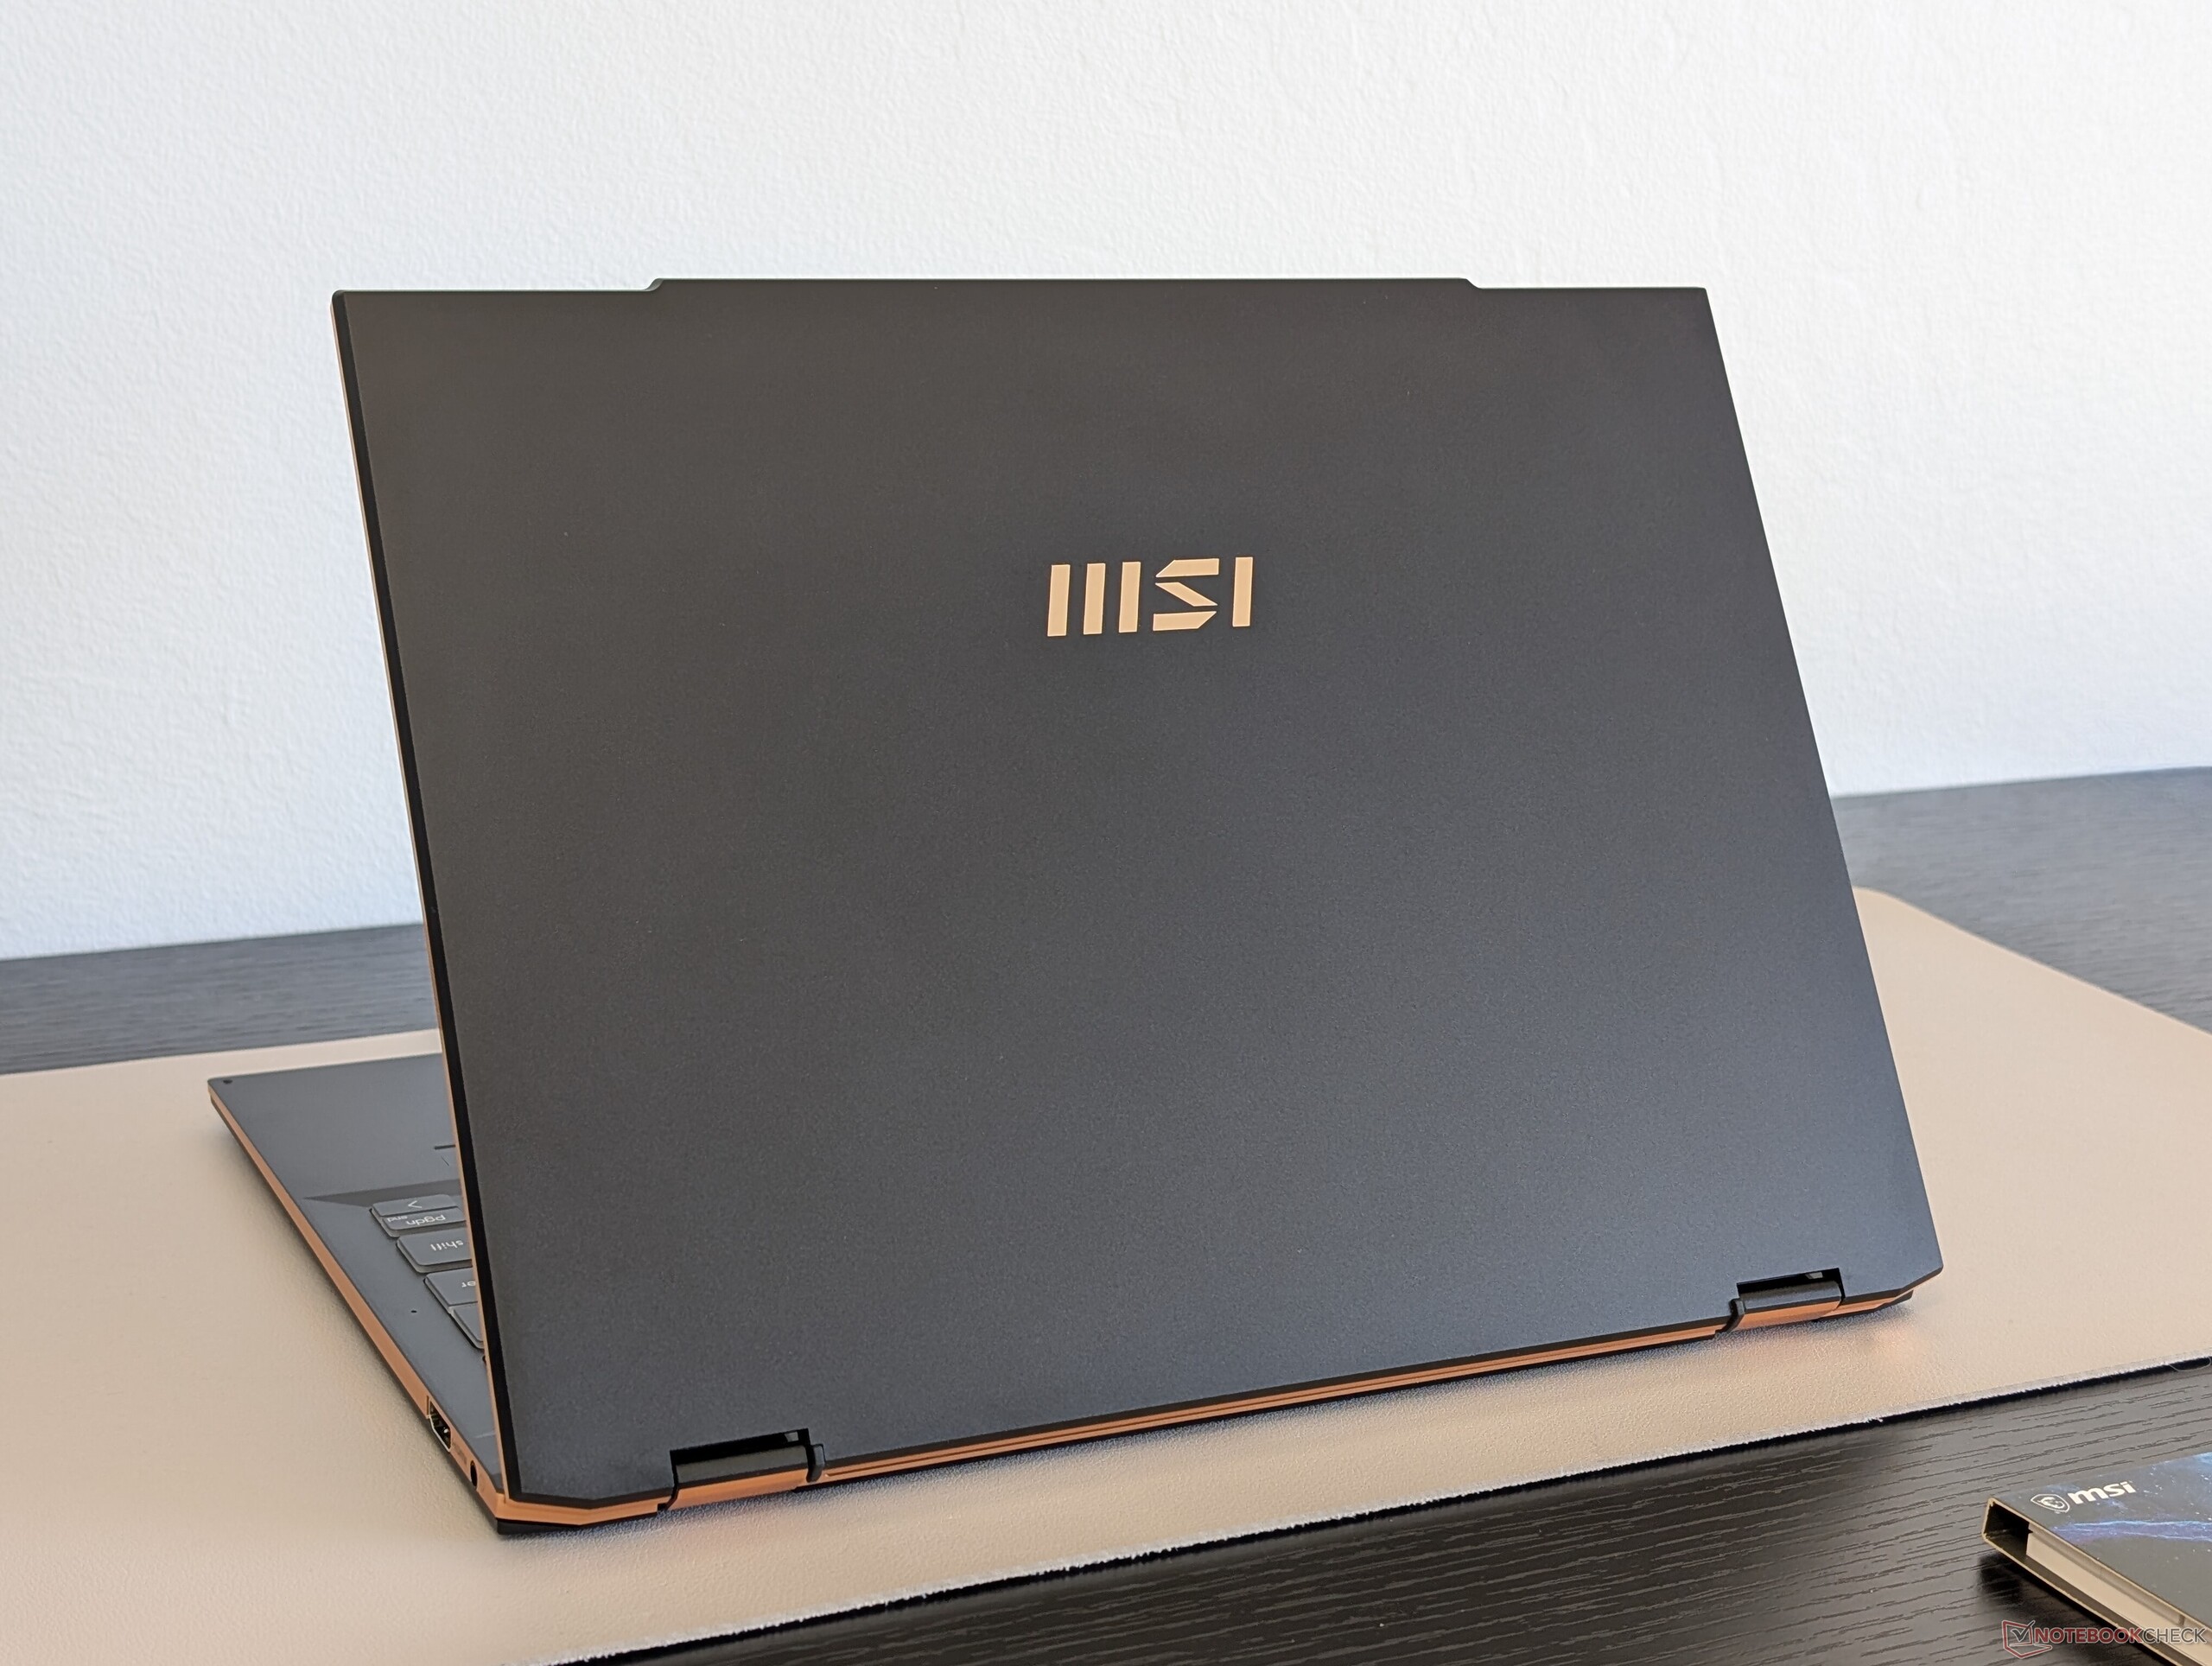
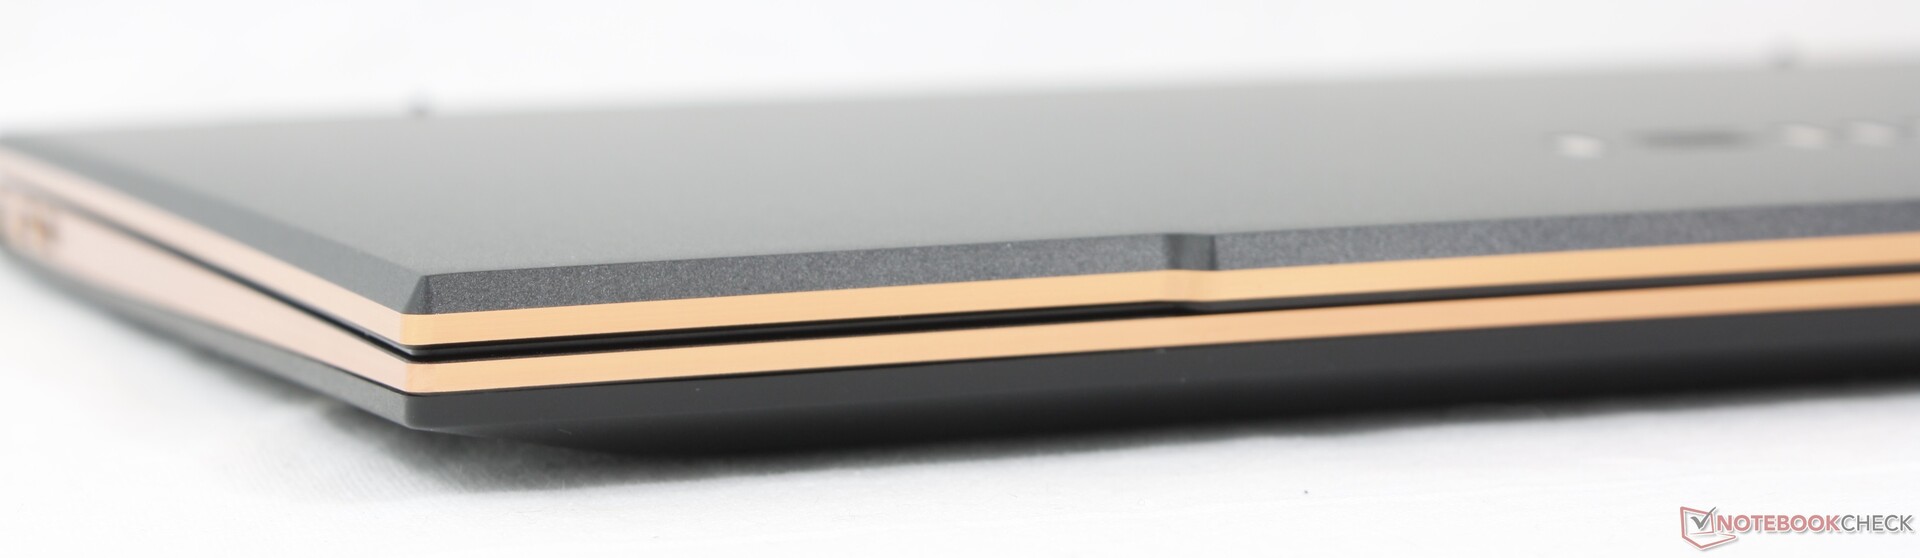
- Корпус - Золотая отделка
- Оснащение - Новые порты в этом году
- Устройства ввода
- Дисплей - Средний по цене
- Производительность - Core Ultra-H слишком мощный, охлаждение не справляется
- Температурные и акустические показатели
- Энергопотребление
- Общая оценка Notebookcheck
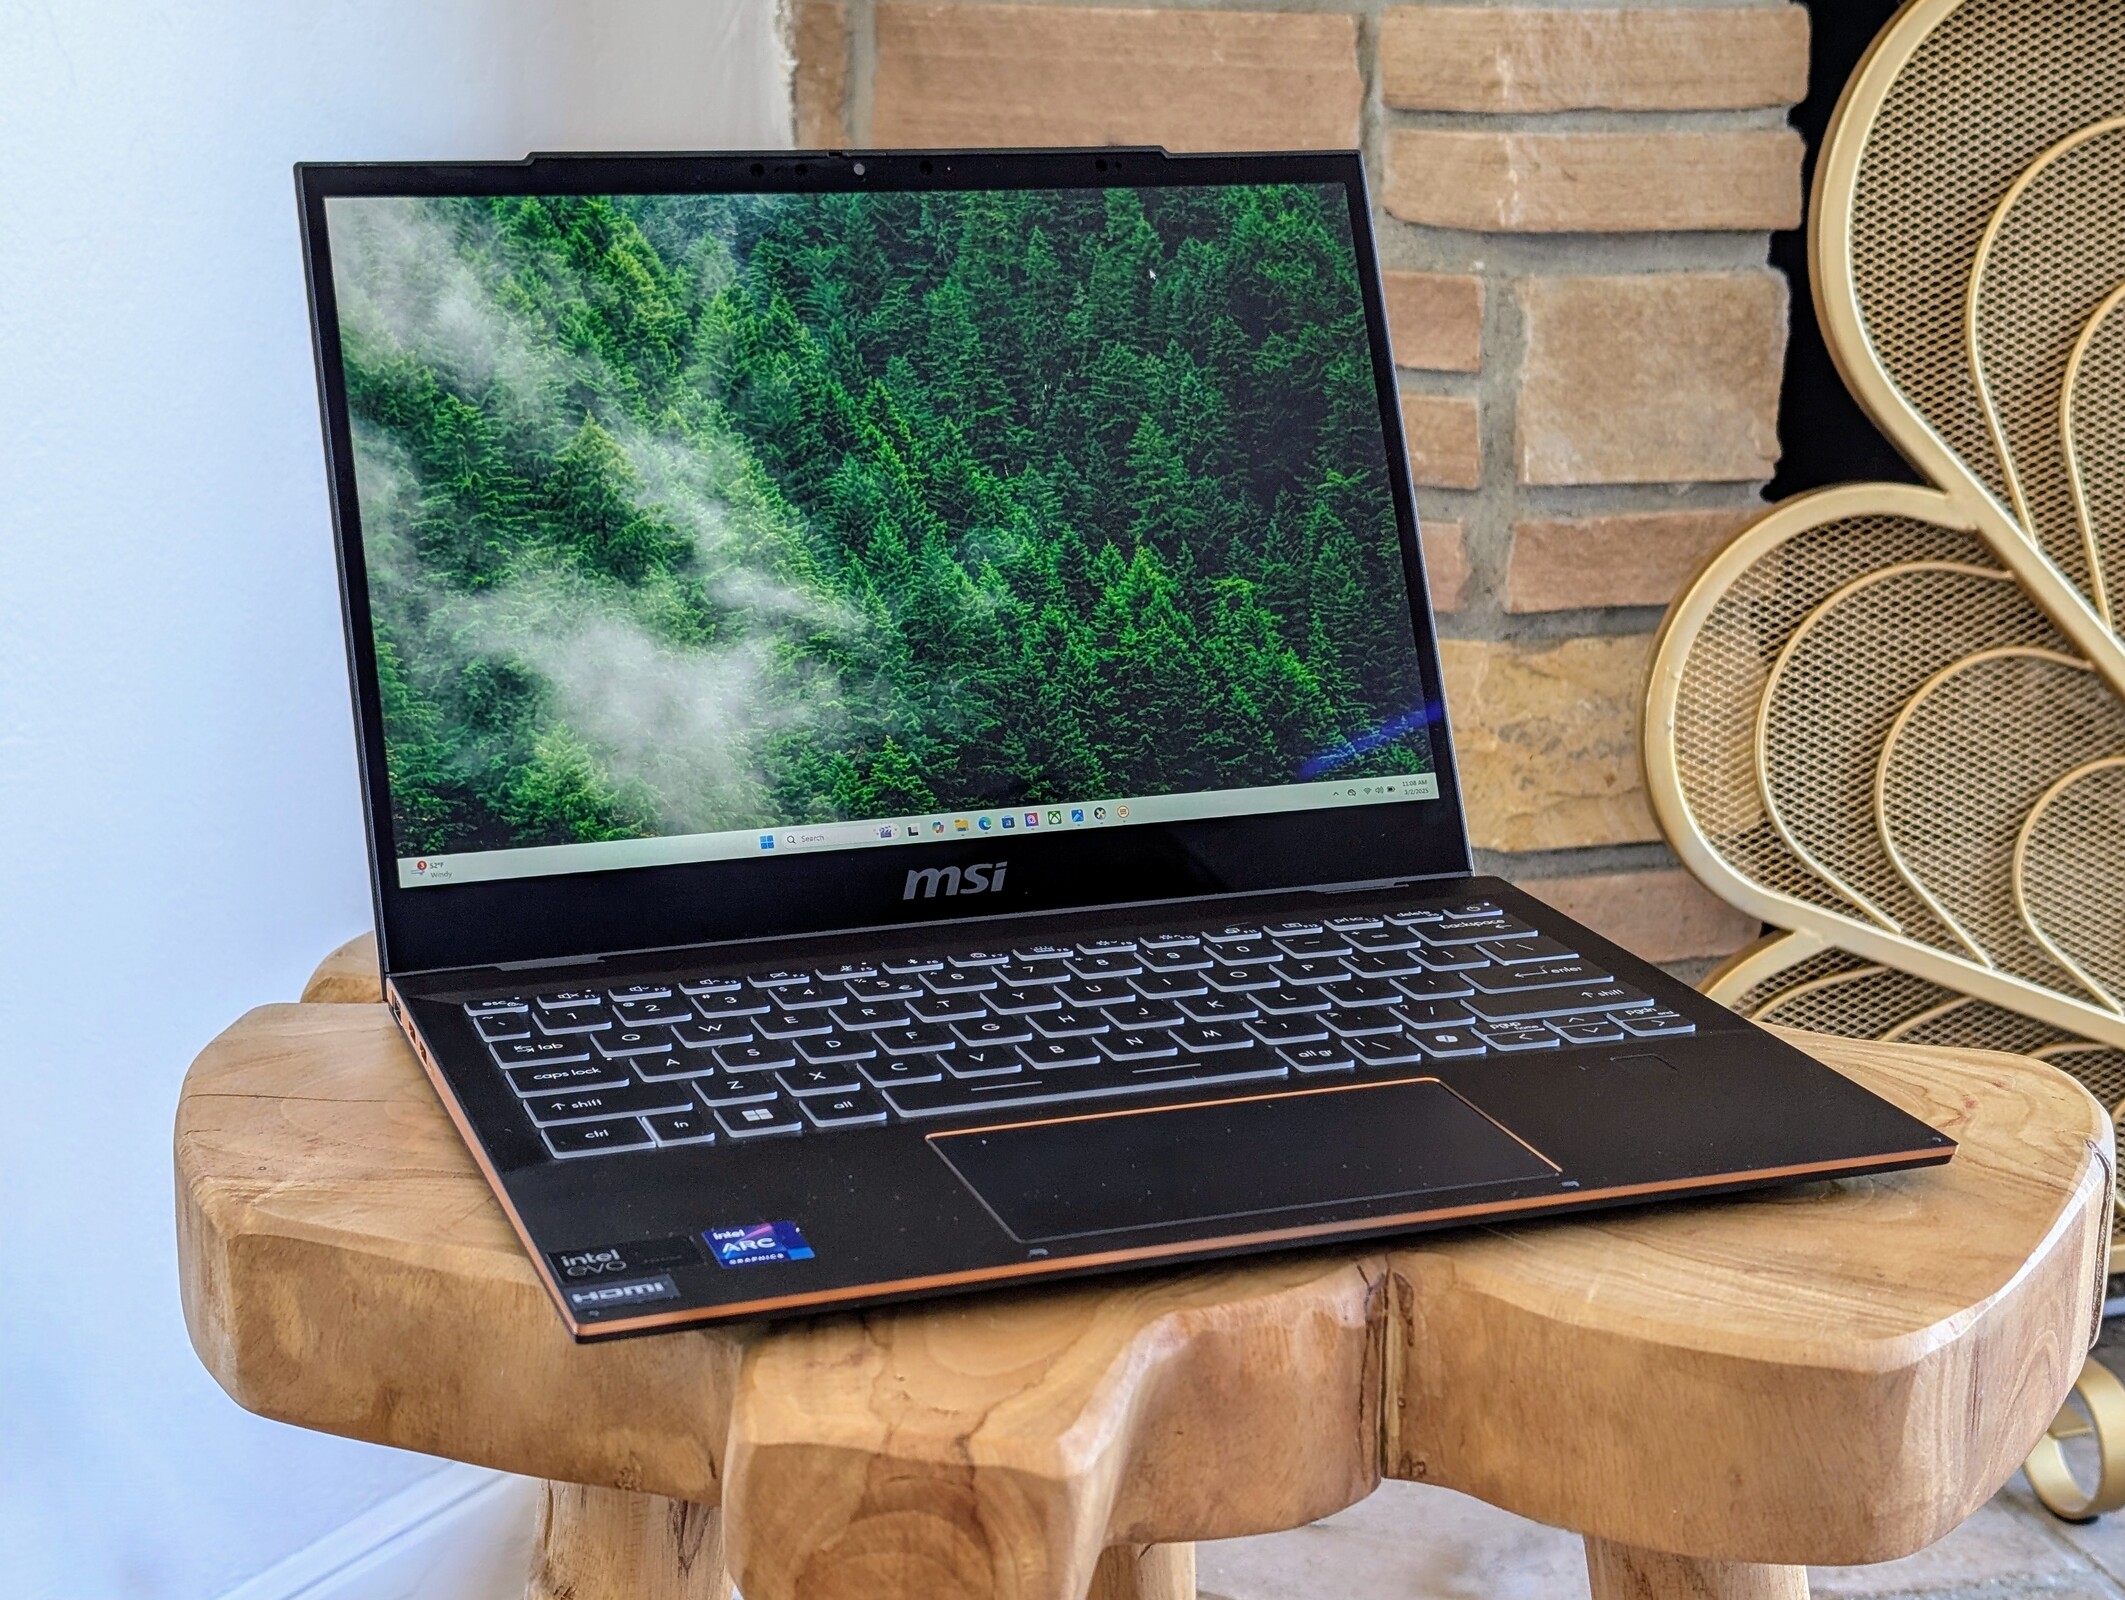
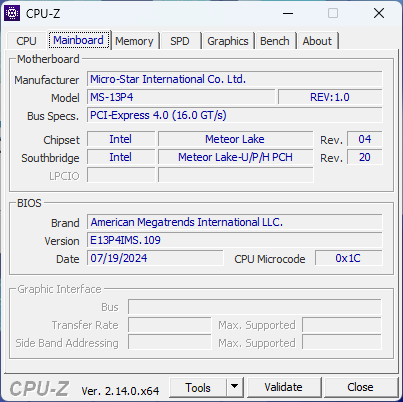
2024 Summit E13 AI Evo A1MTG - это обновленная версия 2021 Summit E13 Flip Evo. Хотя название "Flip" было отменено, модель по-прежнему выполнена в форм-факторе 2-в-1, как и ее предшественник. Она оснащена более новым процессором Intel Core Meteor Lake-H, который заменил более старый вариант Tiger Lake-U в модели 2021 года.
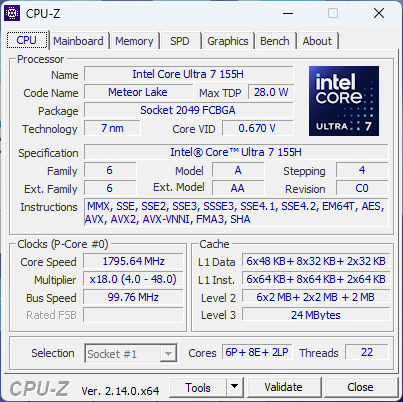
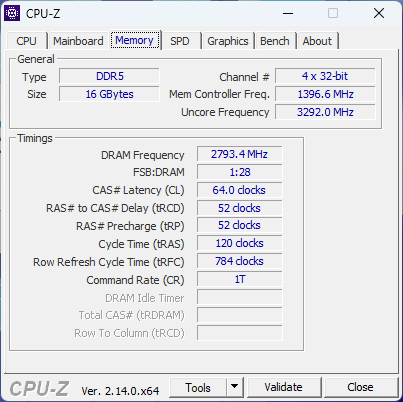
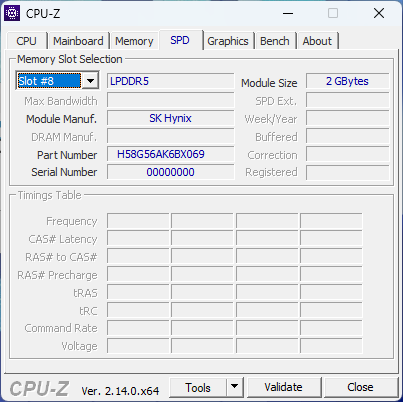
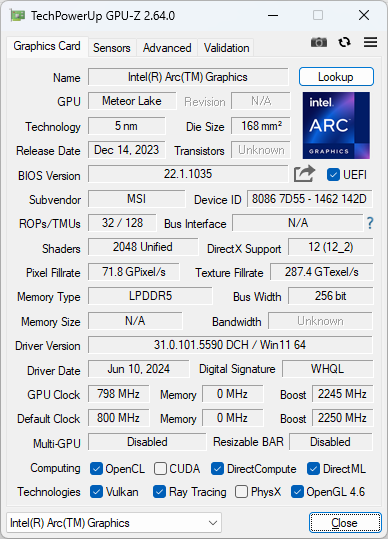
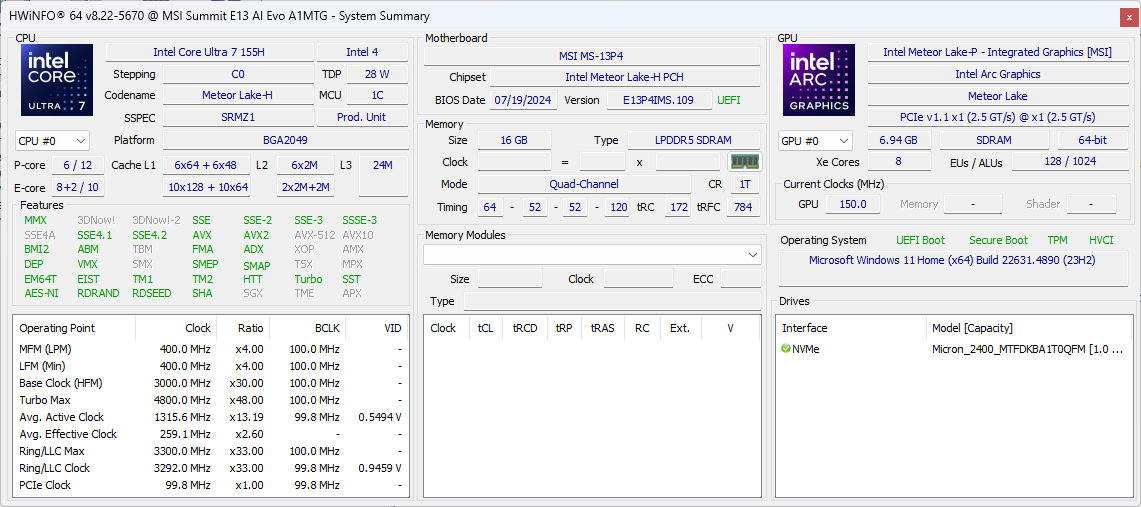
Наше тестовое устройство оснащено процессором Core Ultra 7 155H, 16 ГБ оперативной памяти LPDDR5-5600 и твердотельным накопителем объемом 1 ТБ по цене около $1100. Другие модели могут предлагать 32 ГБ LPDDR5-6400 RAM или более медленный Core Ultra 5 125H, но сенсорный IPS-экран с разрешением 1200p, похоже, будет неизменным во всей линейке.
Конкурентами являются другие 13-дюймовые офисные субноутбуки, такие как Dell Latitude 9330, HP Elite Dragonfly Folio, или Lenovo ThinkPad L13 Yoga G4.
Больше обзоров MSI:
Характеристики
Корпус - Золотая отделка
Модель 2024 Summit E13 имеет другие порты и новый затвор для веб-камеры по сравнению с версией 2021 года. В остальном корпуса идентичны и не имеют существенных изменений как внешне, так и внутренне.
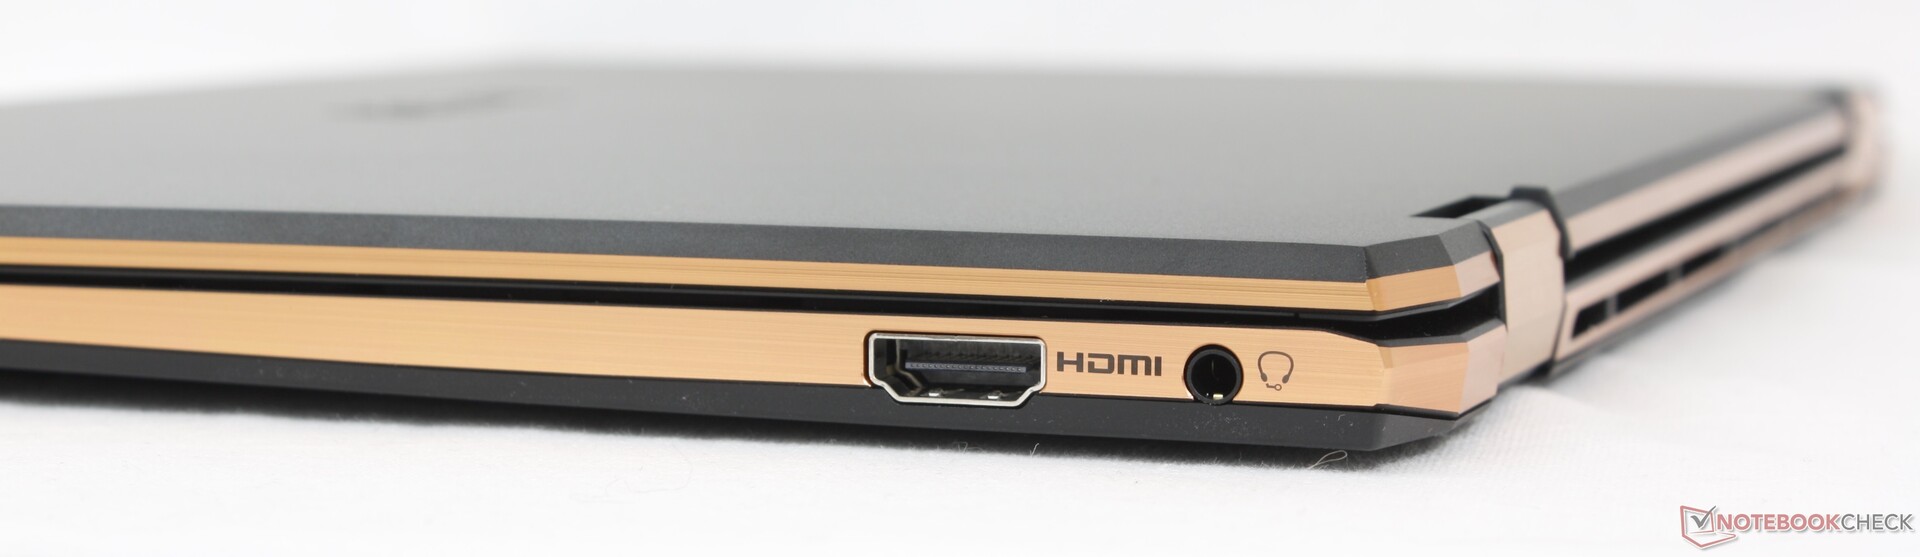
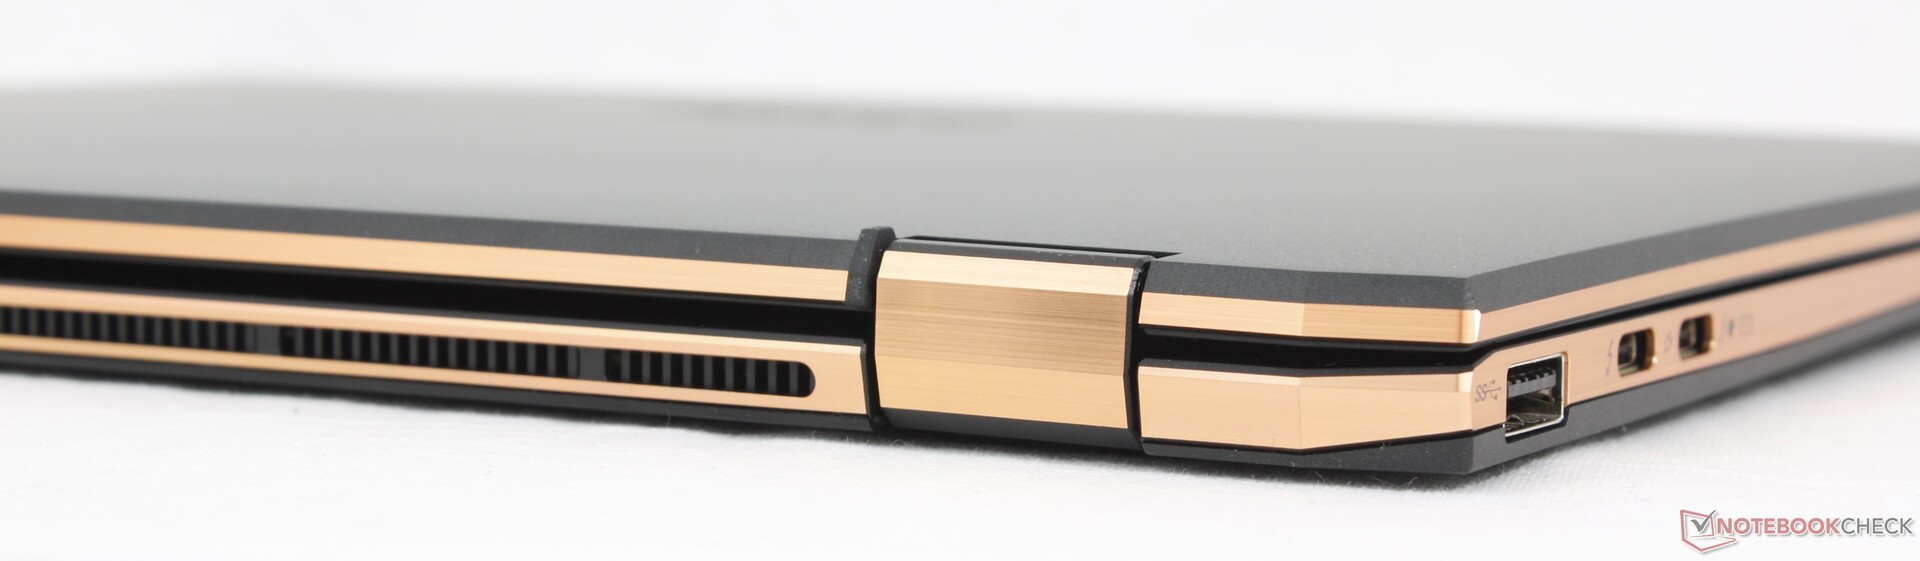
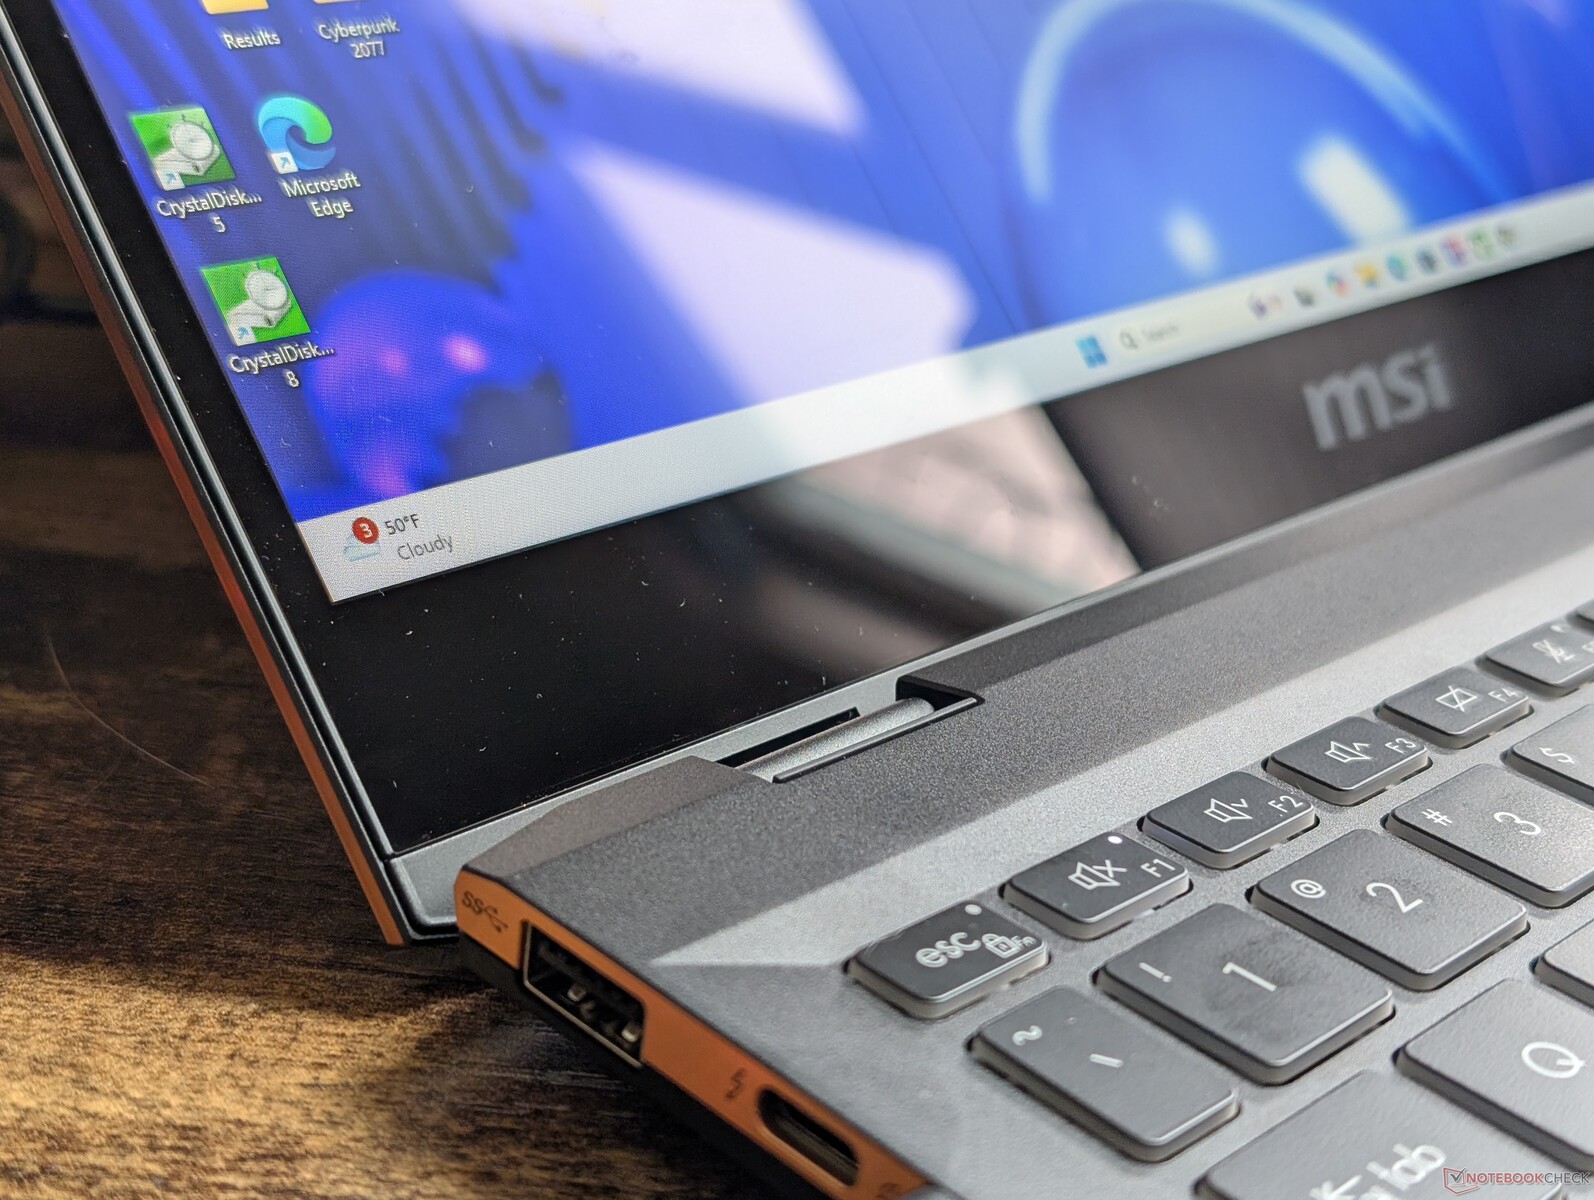
Оснащение - Новые порты в этом году
Опции портов изменились по сравнению с моделью 2021 года, и не обязательно в лучшую сторону. Один из портов USB-C был удален в пользу HDMI, а устройство чтения MicroSD было полностью исключено.

Сеть
| Networking | |
| iperf3 transmit AX12 | |
| MSI Summit E13 Flip Evo A11MT | |
| iperf3 receive AX12 | |
| MSI Summit E13 Flip Evo A11MT | |
| iperf3 transmit AXE11000 | |
| Lenovo ThinkPad L13 Yoga G4 i7-1355U | |
| HP Elite Dragonfly Folio 13.5 G3 | |
| Dell Latitude 9330 | |
| Lenovo Yoga Book 9 13IMU9 | |
| MSI Summit E13 AI Evo A1MTG | |
| iperf3 receive AXE11000 | |
| Lenovo ThinkPad L13 Yoga G4 i7-1355U | |
| Lenovo Yoga Book 9 13IMU9 | |
| HP Elite Dragonfly Folio 13.5 G3 | |
| Dell Latitude 9330 | |
| MSI Summit E13 AI Evo A1MTG | |
| iperf3 transmit AXE11000 6GHz | |
| HP Elite Dragonfly Folio 13.5 G3 | |
| Dell Latitude 9330 | |
| MSI Summit E13 AI Evo A1MTG | |
| Lenovo Yoga Book 9 13IMU9 | |
| iperf3 receive AXE11000 6GHz | |
| HP Elite Dragonfly Folio 13.5 G3 | |
| MSI Summit E13 AI Evo A1MTG | |
| Dell Latitude 9330 | |
| Lenovo Yoga Book 9 13IMU9 | |
Веб-камера
Веб-камера осталась прежней - 1080p или 2 МП, только с поддержкой ИК-подсветки.


Обслуживание
Обслуживание аналогично модели 2021 года, вплоть до расположения материнской платы, согласно видеоролику об обслуживании LaptopMedia. Оперативная память не обновляется, поддерживается только один твердотельный накопитель M.2 2280.
Экологичность
MSI не сообщает о мерах по обеспечению экологической безопасности, принятых при производстве. В остальном коробка для розничной продажи состоит в основном из бумаги и картона с пластиковой упаковкой для адаптера переменного тока.
Аксессуары и гарантия
В розничную коробку входит активный стилус MSI Pen 2, а также сетевой адаптер и документы. При покупке в США действует обычная годовая ограниченная гарантия производителя.
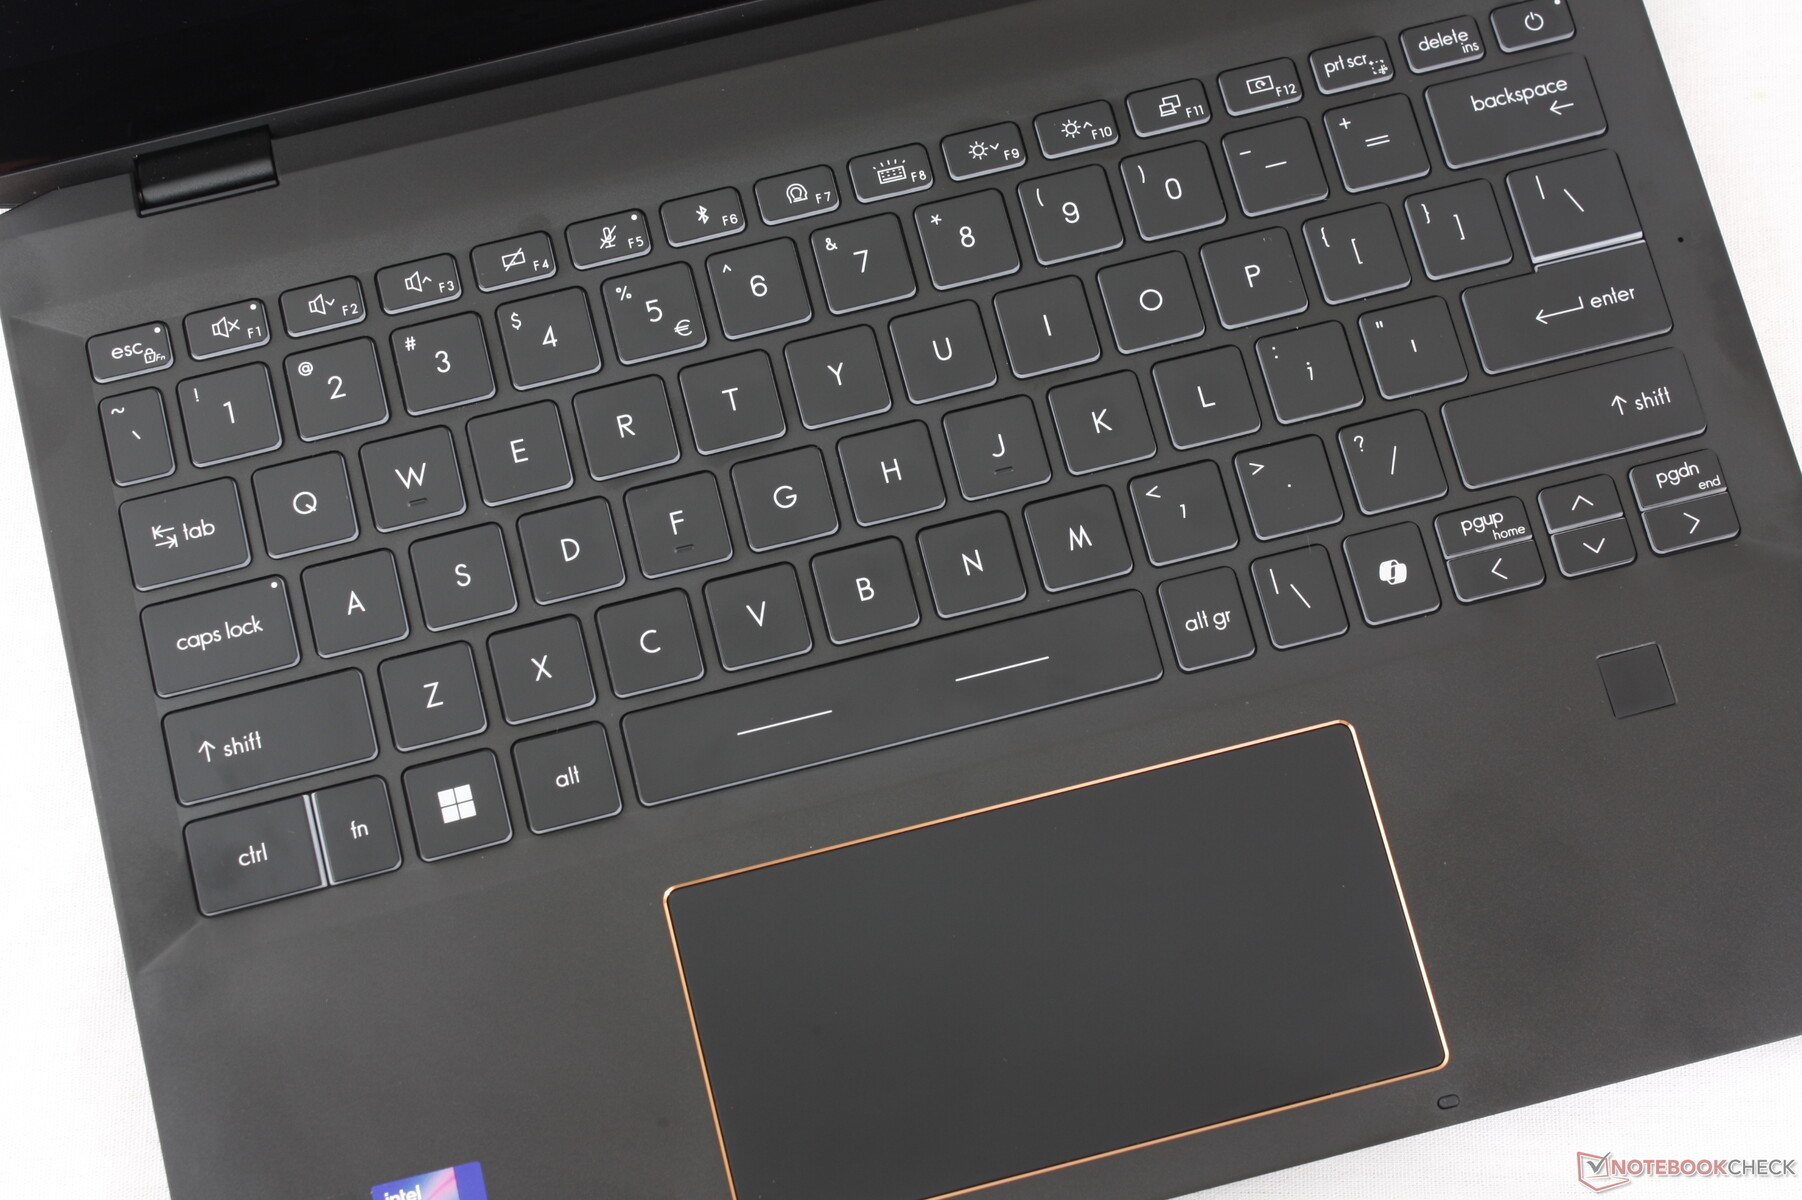
Устройства ввода
Клавиатура и кликпад не изменились ни по размеру, ни по обратной связи, что обеспечивает те же ощущения от набора текста, что и в модели 2021 года. Новинкой этого года стала выделенная клавиша "Второй пилот" и слегка измененные клавиши Fn и Ctrl. К сожалению, маленькие клавиши PgUp, PgDn и стрелки по-прежнему очень тесные, пористые и в целом ненадежные.
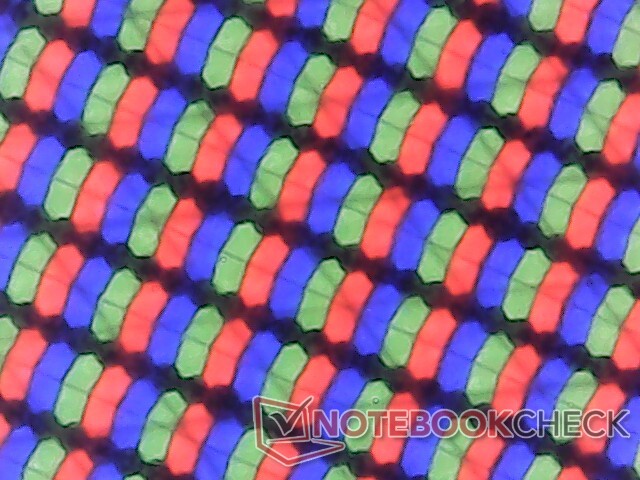
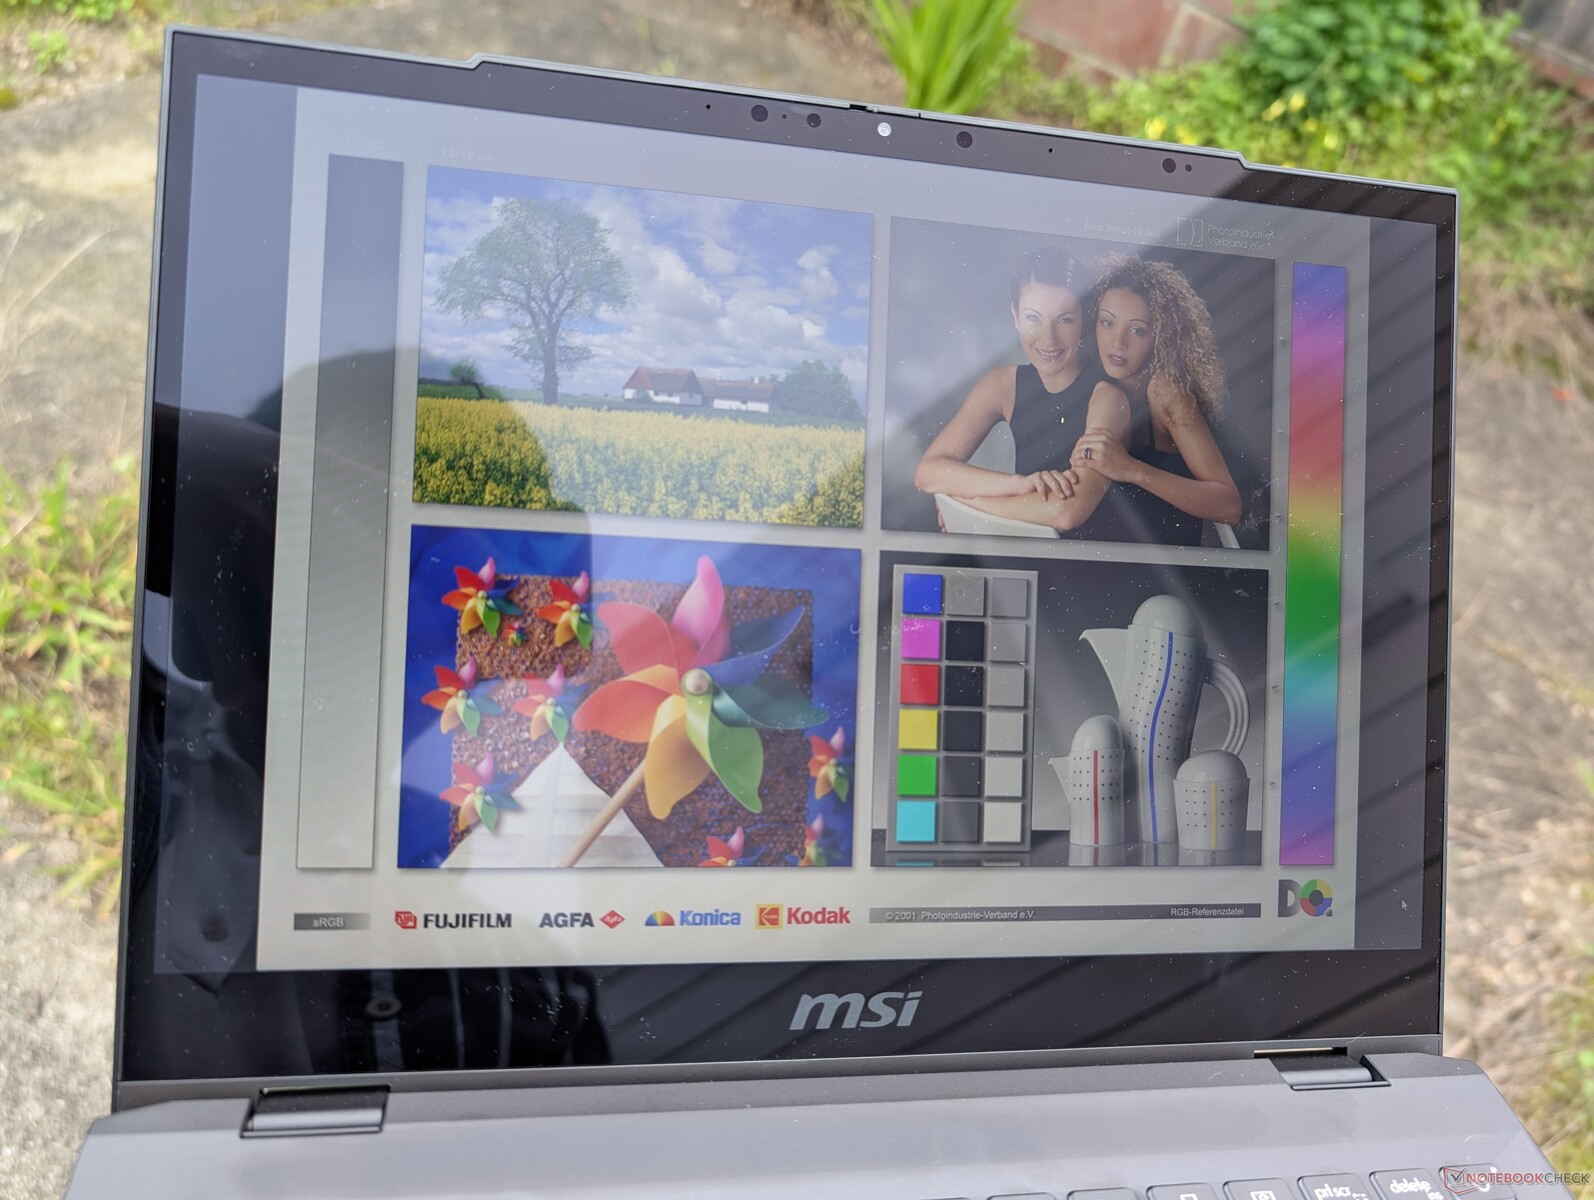
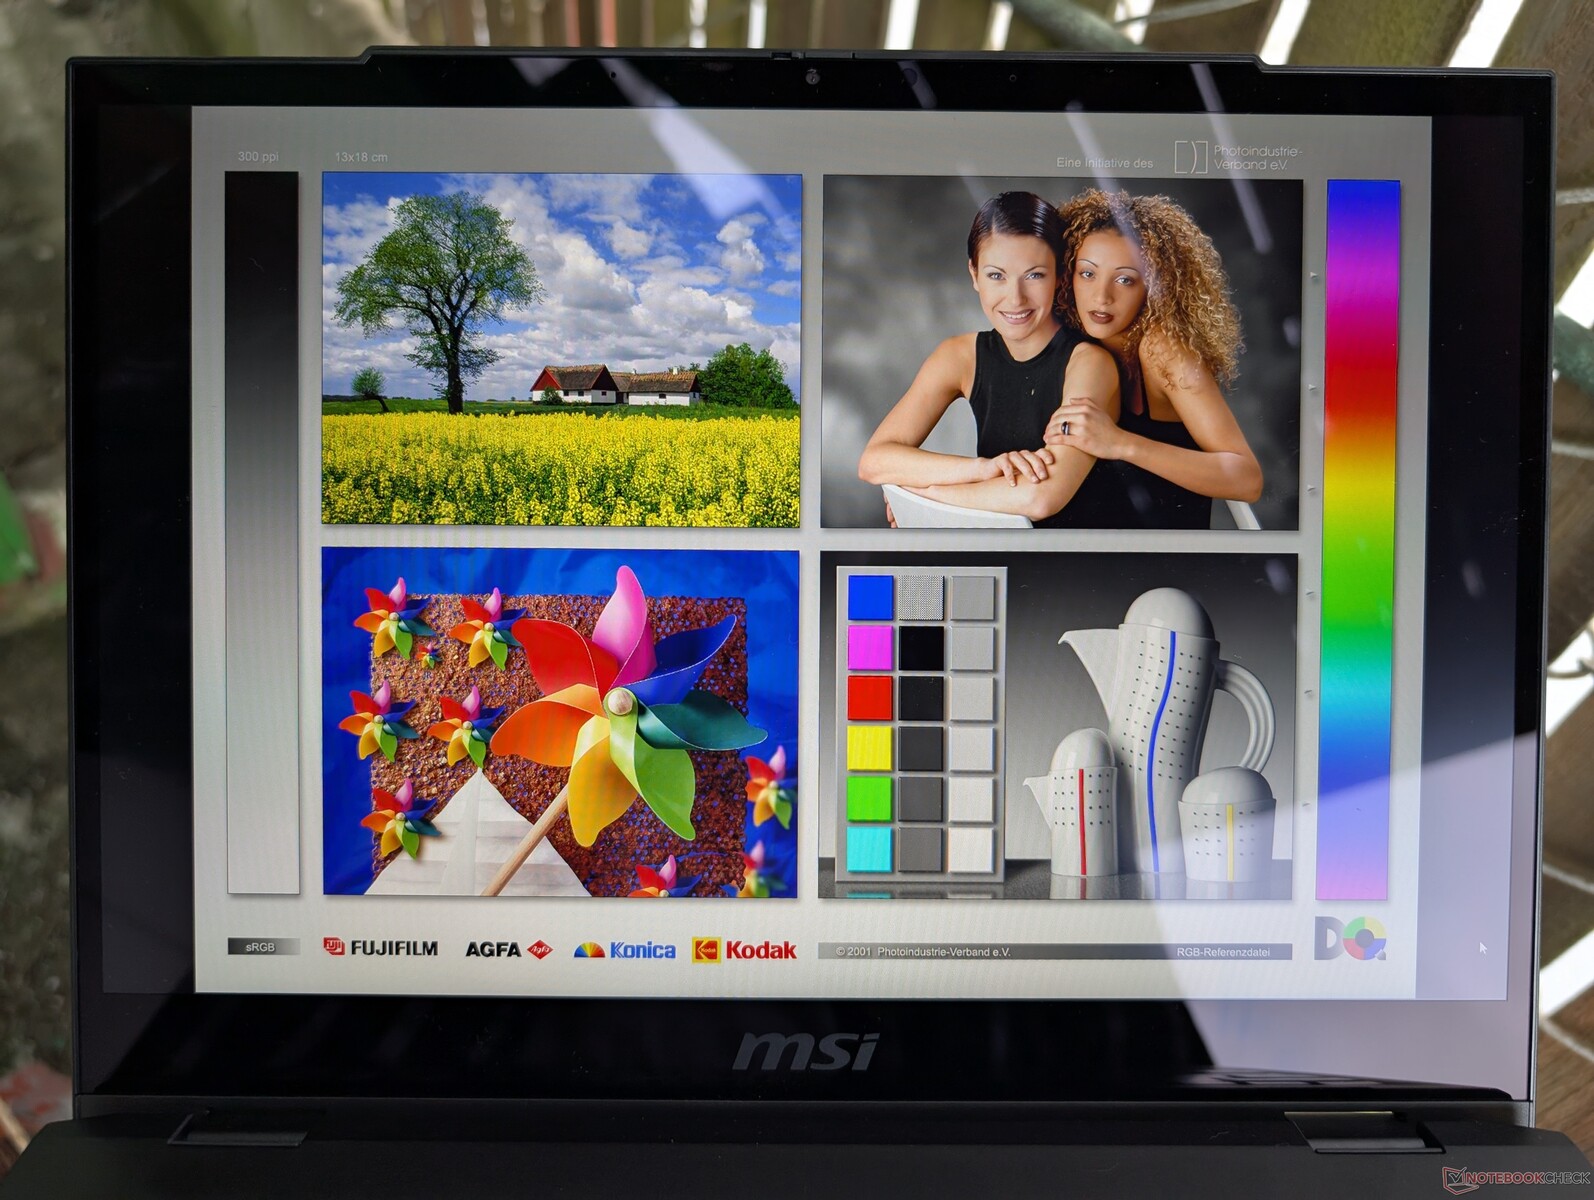
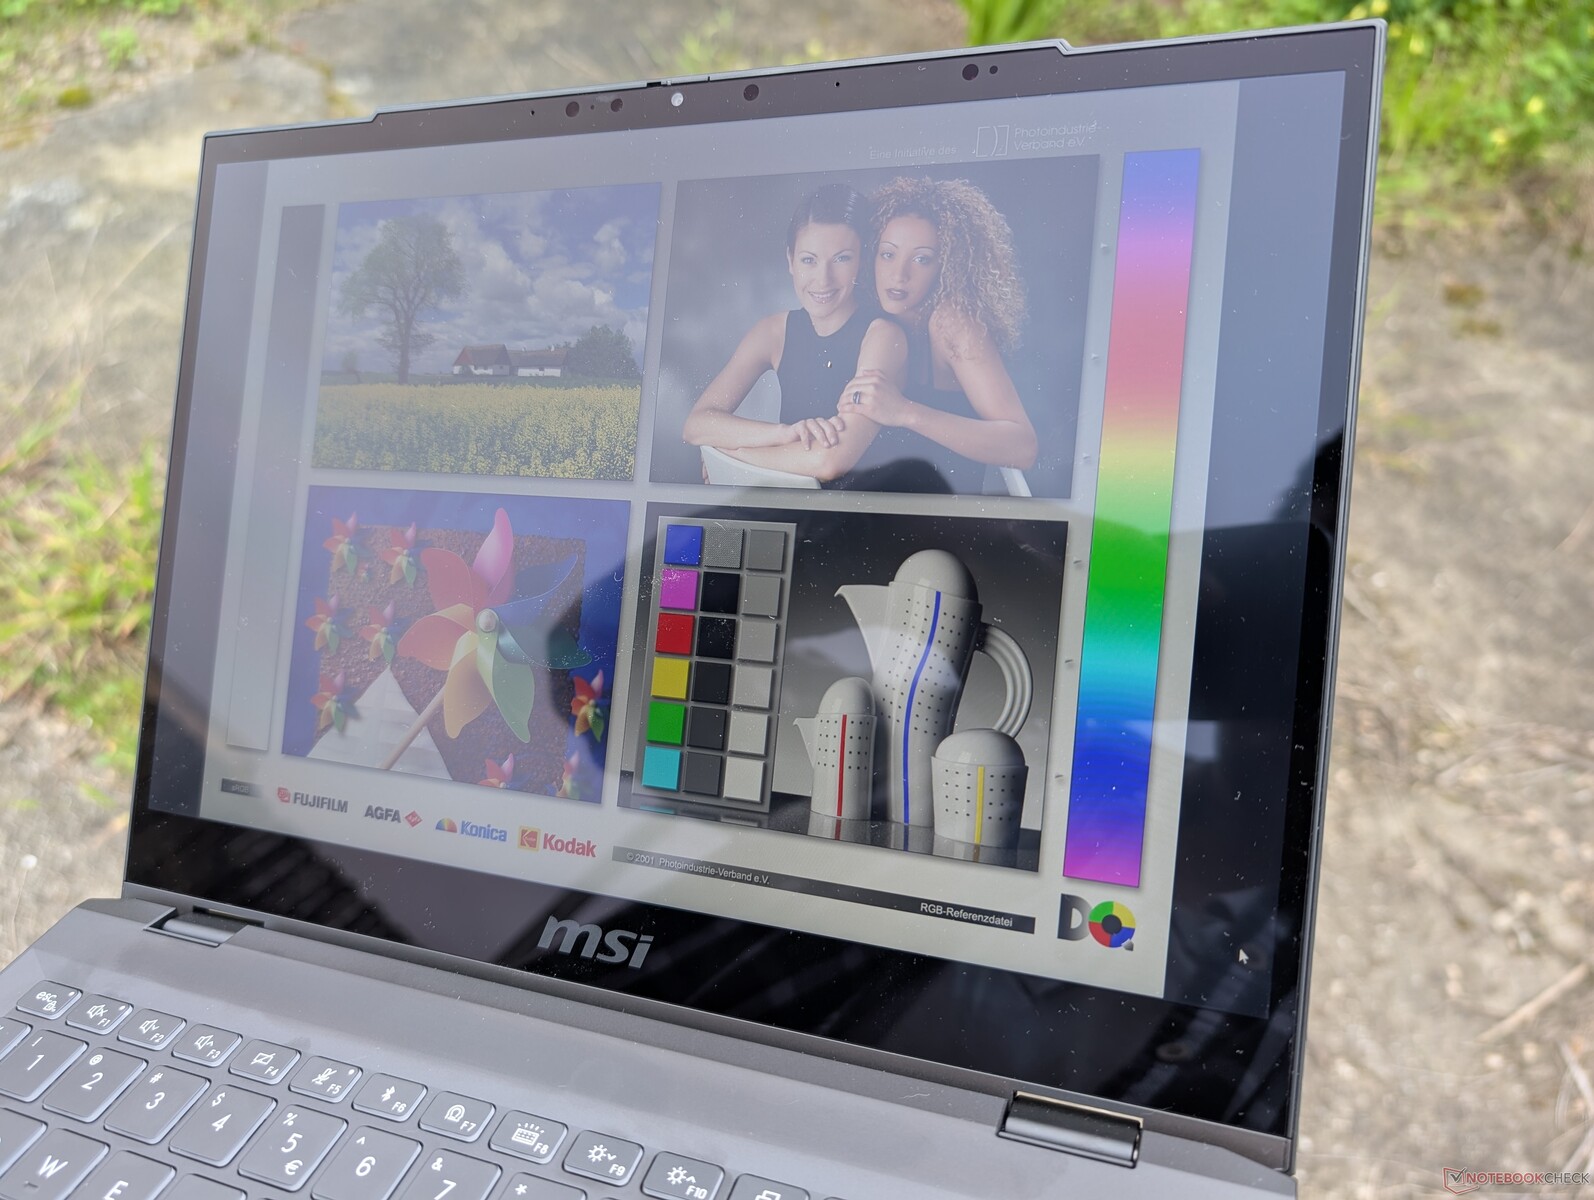
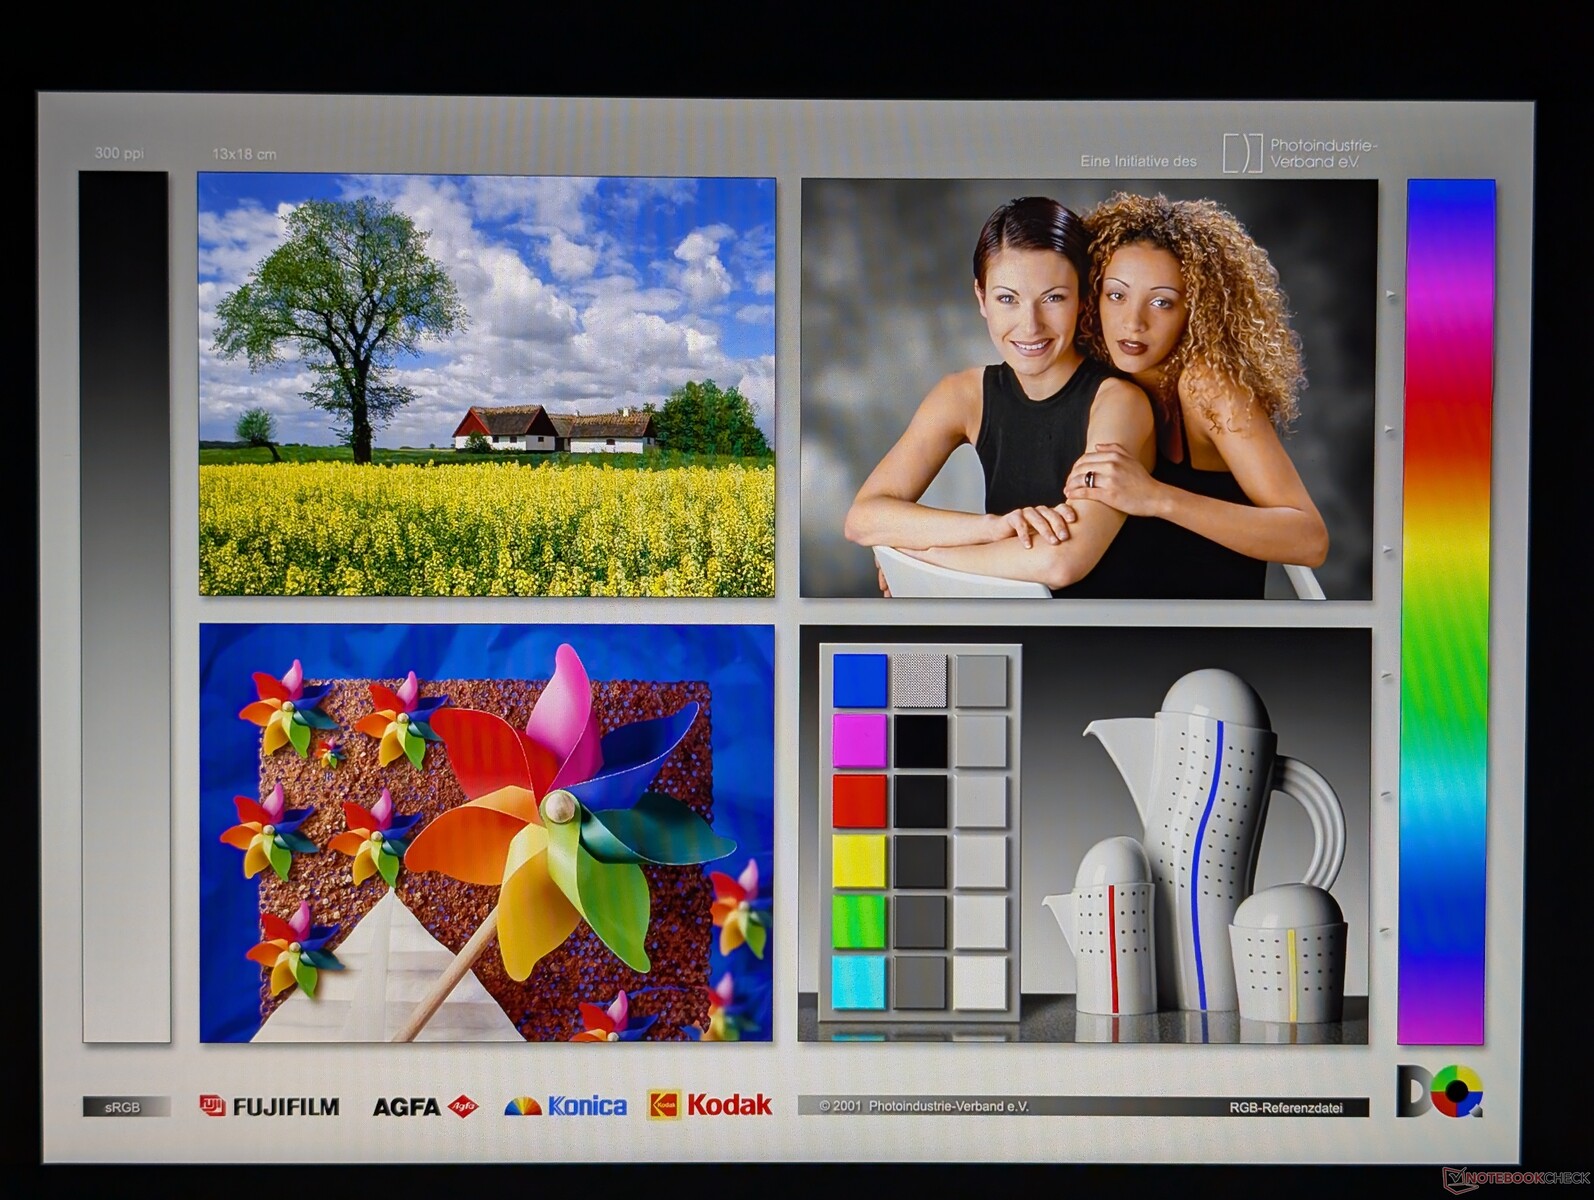
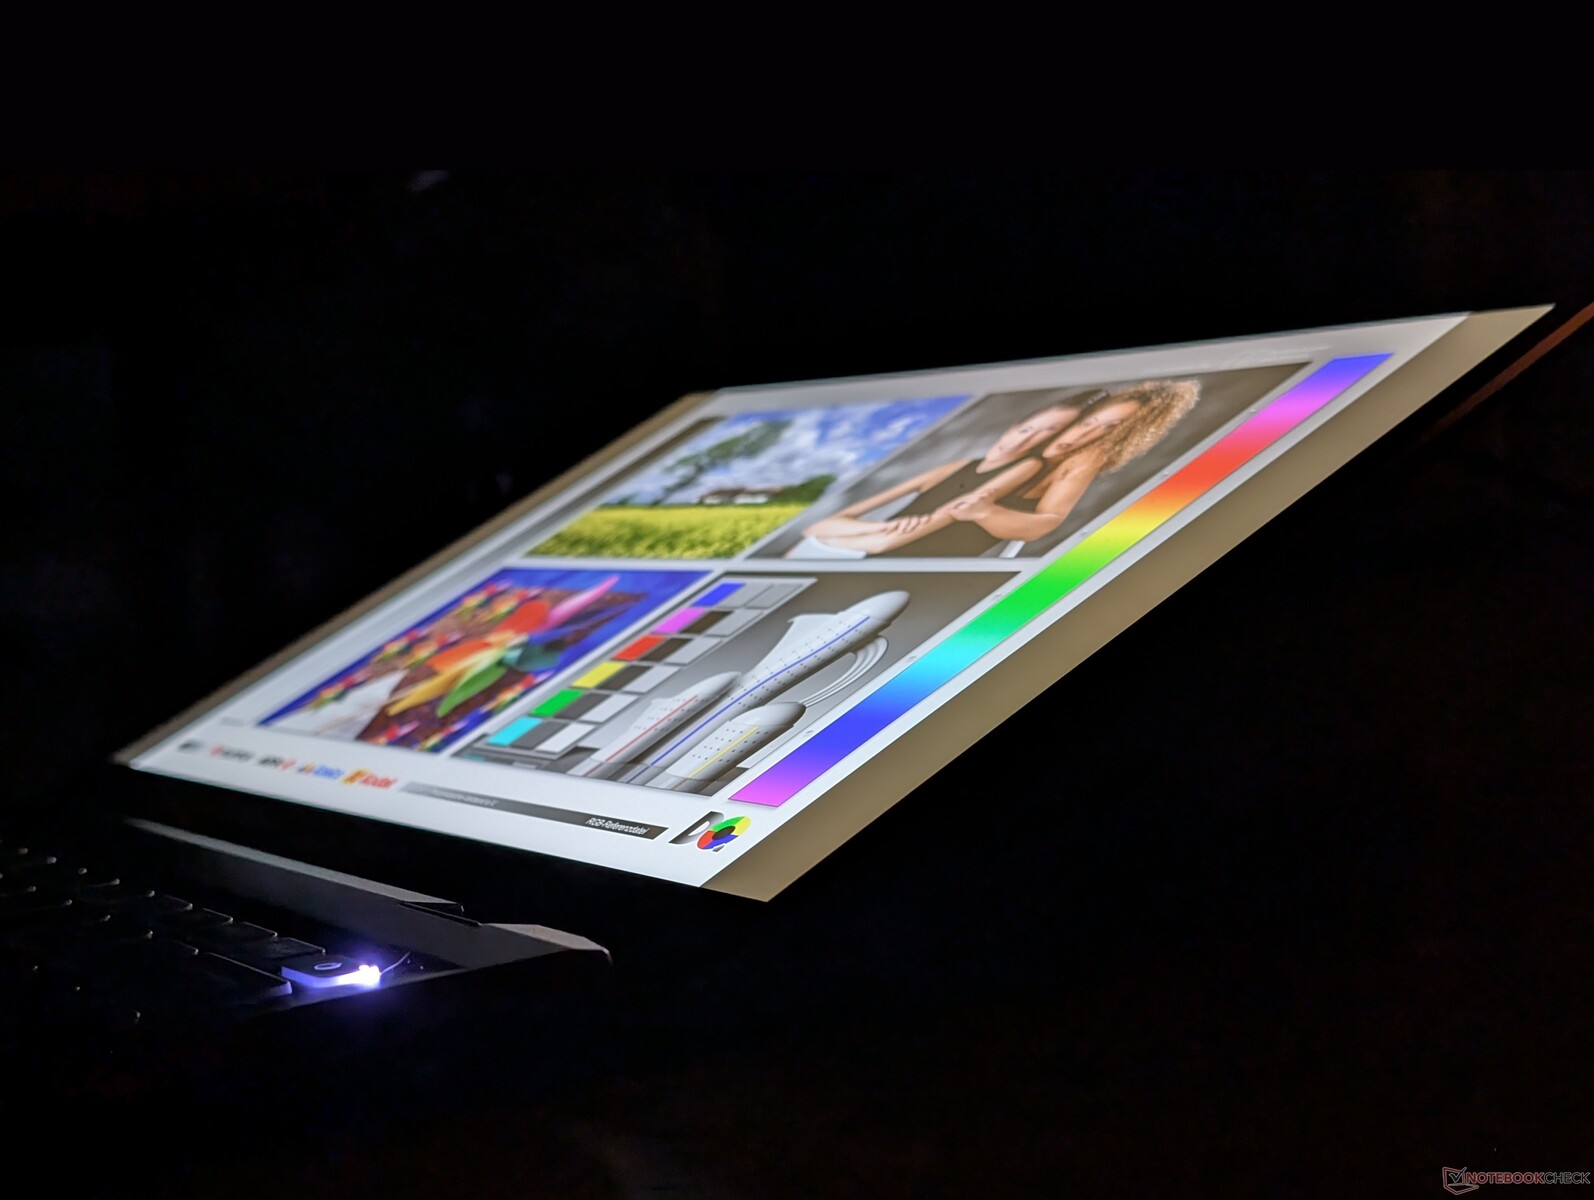
Дисплей - Средний по цене
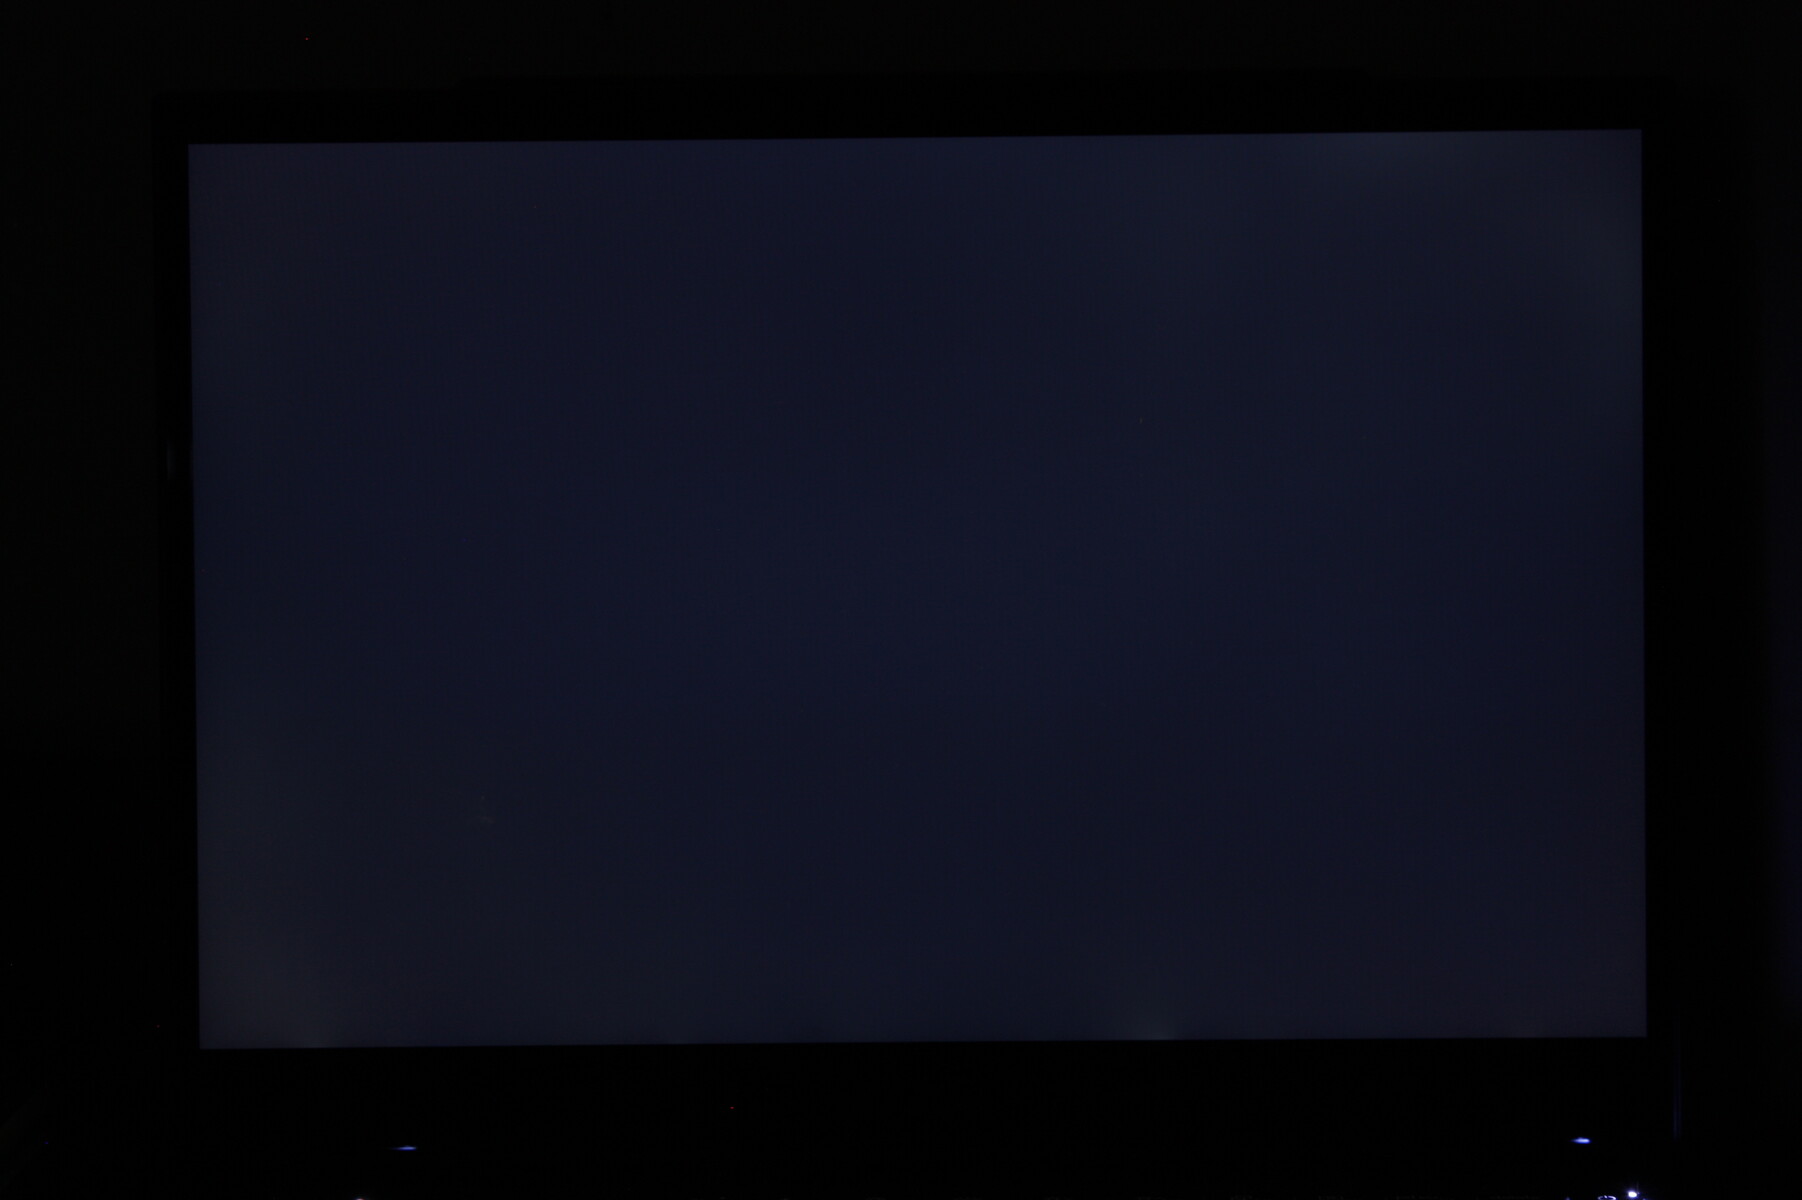
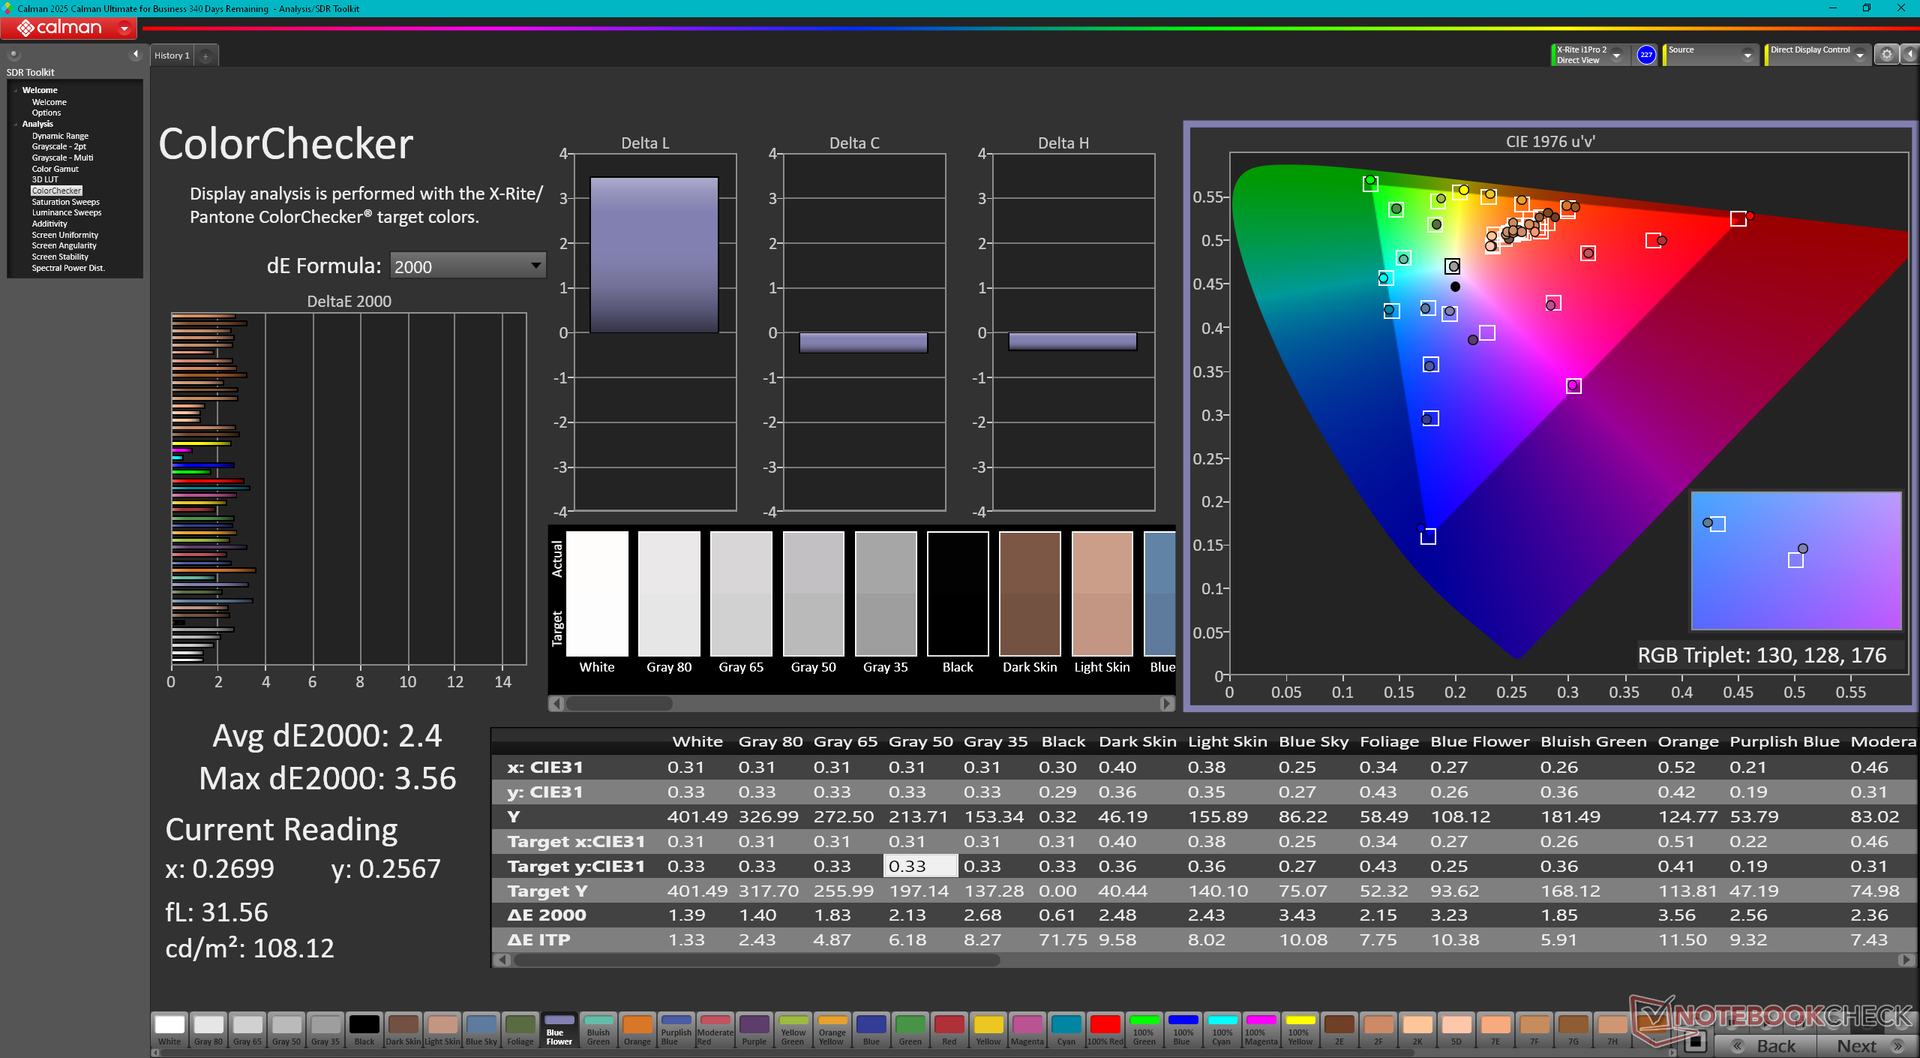
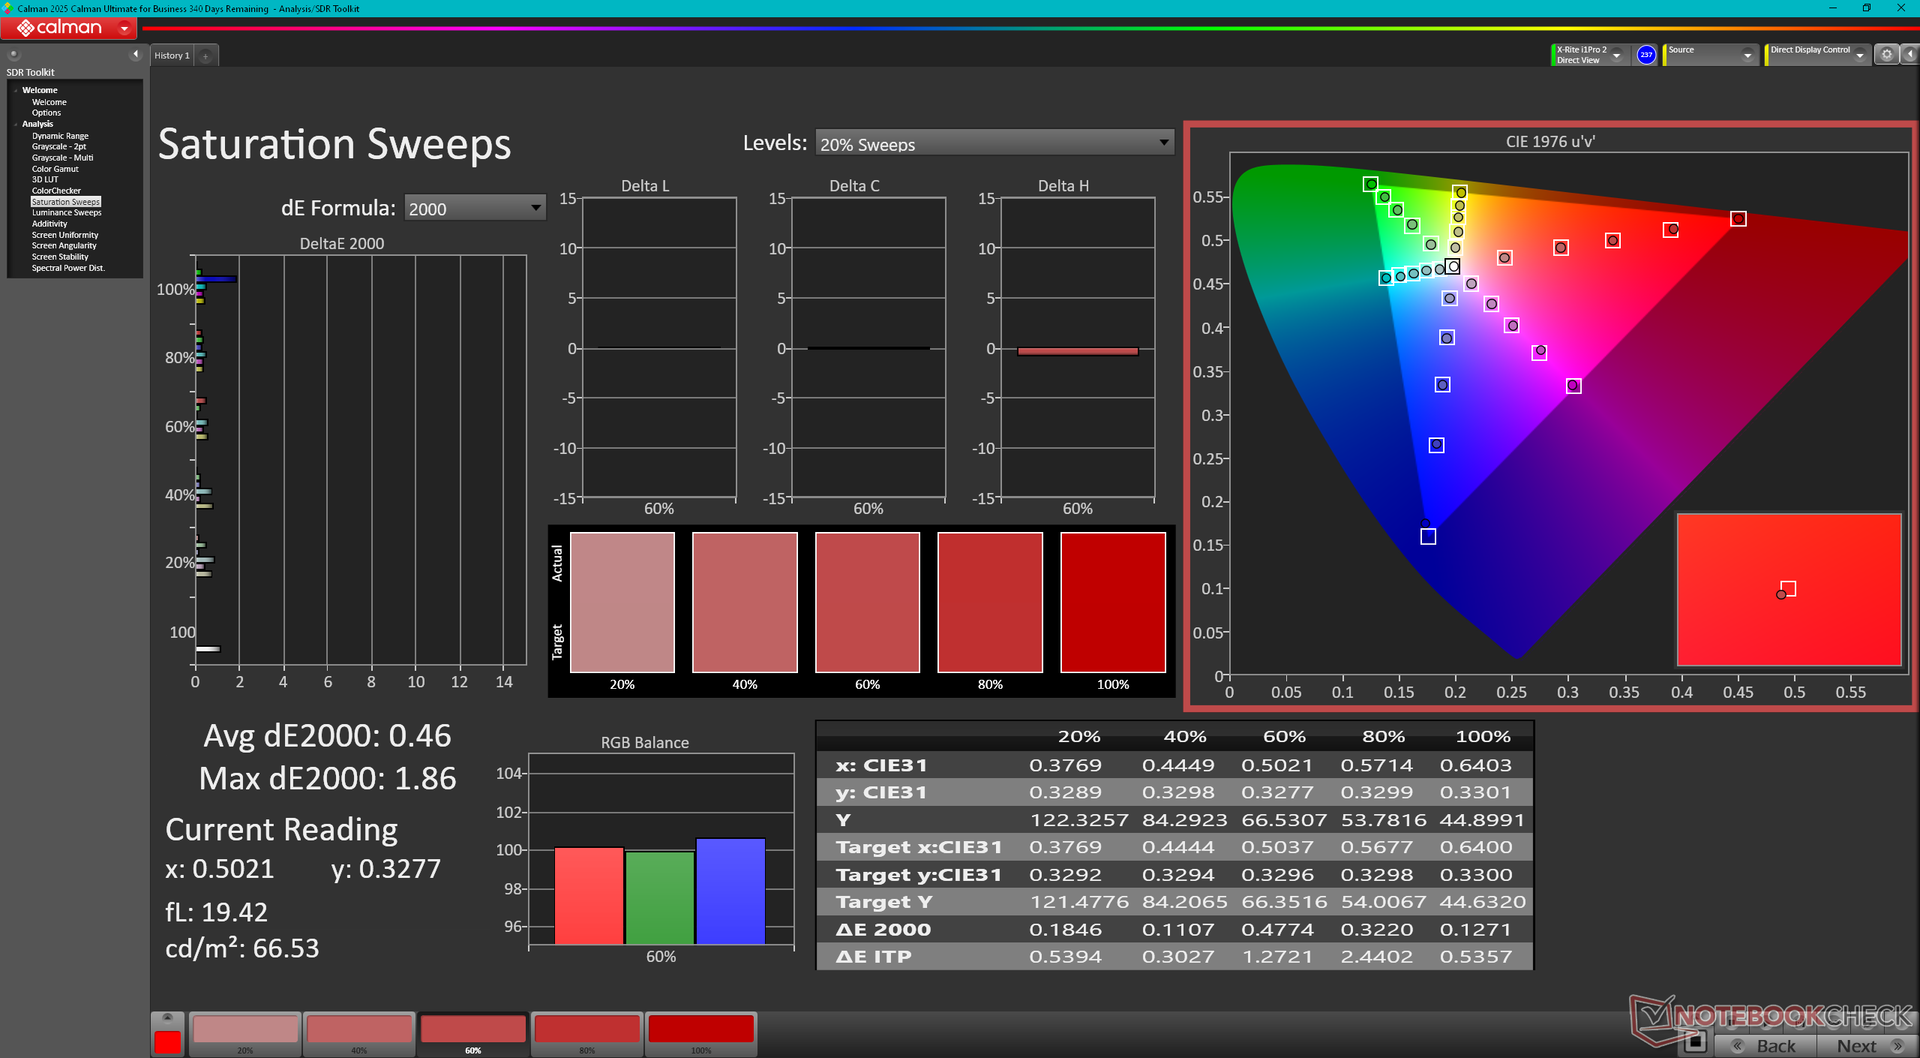
В нашем устройстве используется панель Chi Mei с частотой 60 Гц вместо панели Sharp с частотой 120 Гц в модели 2021 года. Панель Chi Mei обеспечивает аналогичные sRGB цвета, но с немного меньшим уровнем контрастности. Время отклика черно-белого и серо-серого цветов остается очень медленным даже по неигровым стандартам.
| |||||||||||||||||||||||||
Равномерность подсветки: 88 %
От батареи: 405.2 cd/m²
Контрастность: 1192:1 (Уровень чёрного: 0.34 cd/m²)
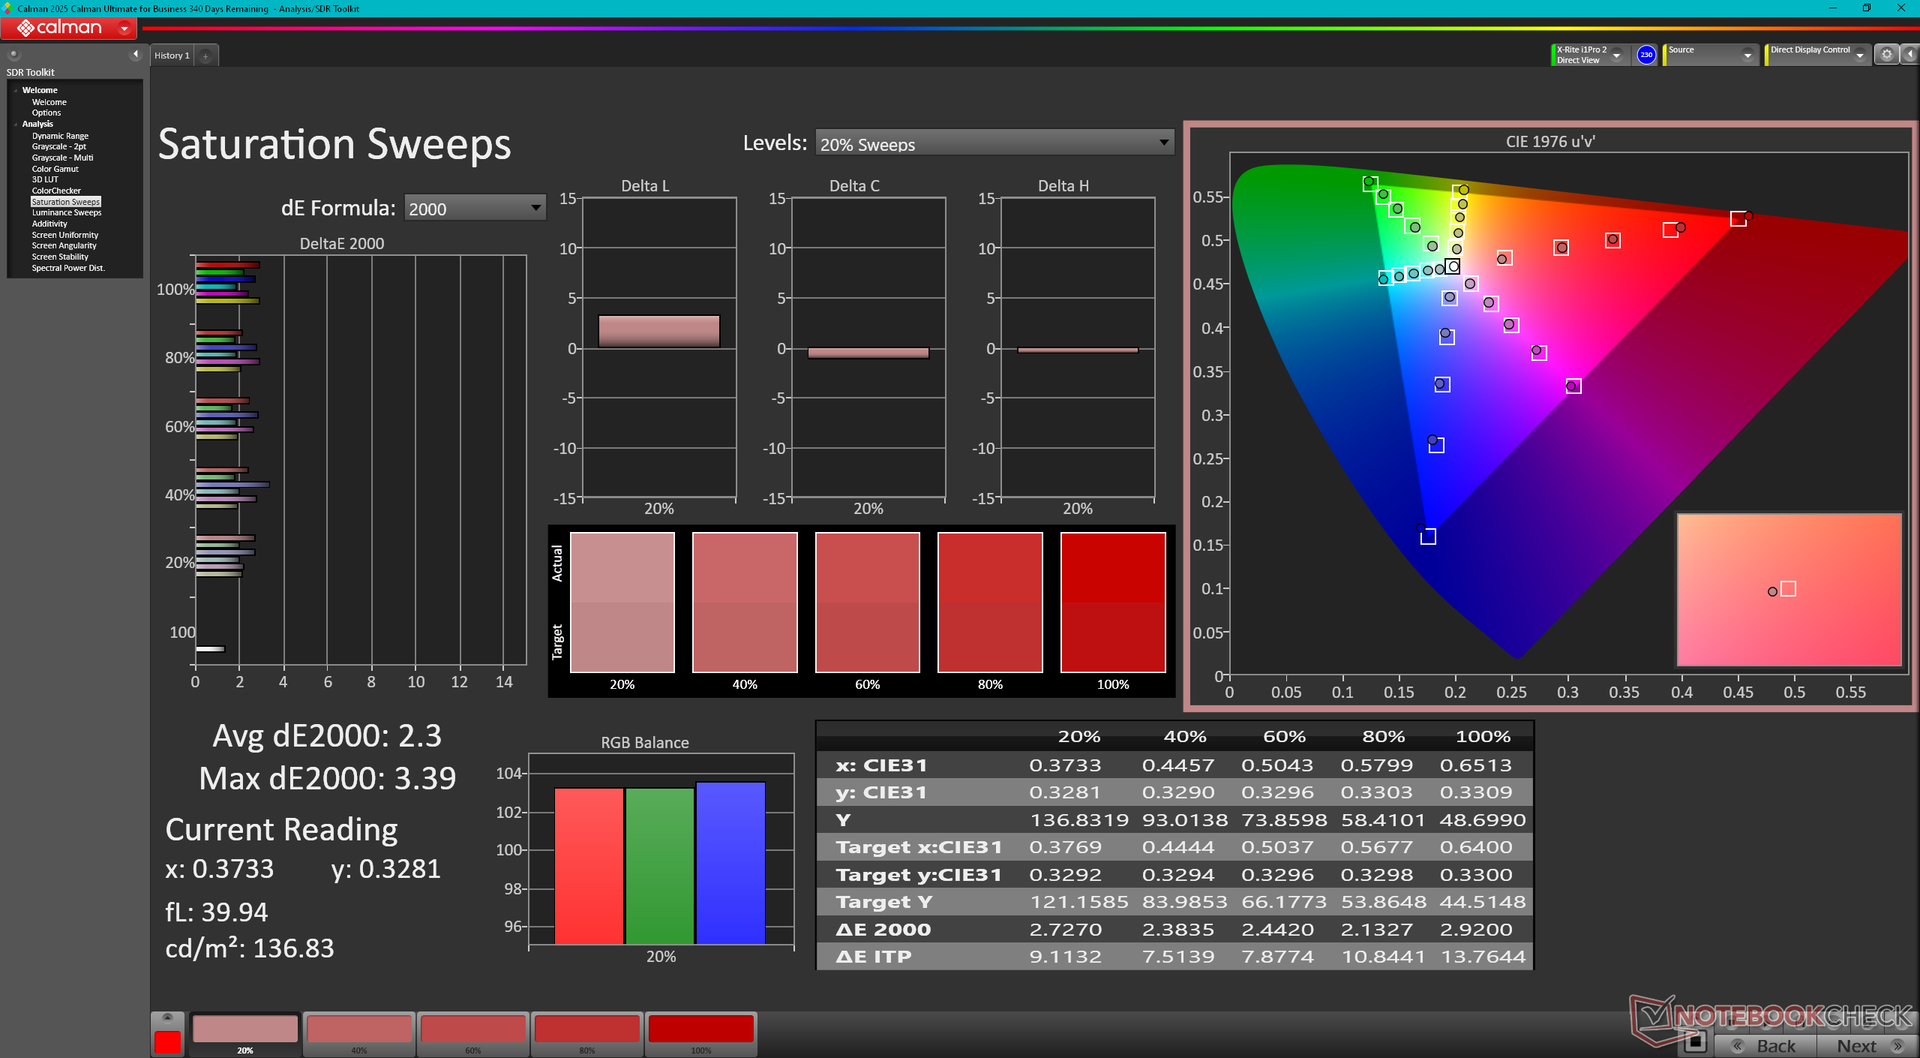
ΔE Color 2.4 | 0.5-29.43 Ø4.87, calibrated: 0.54
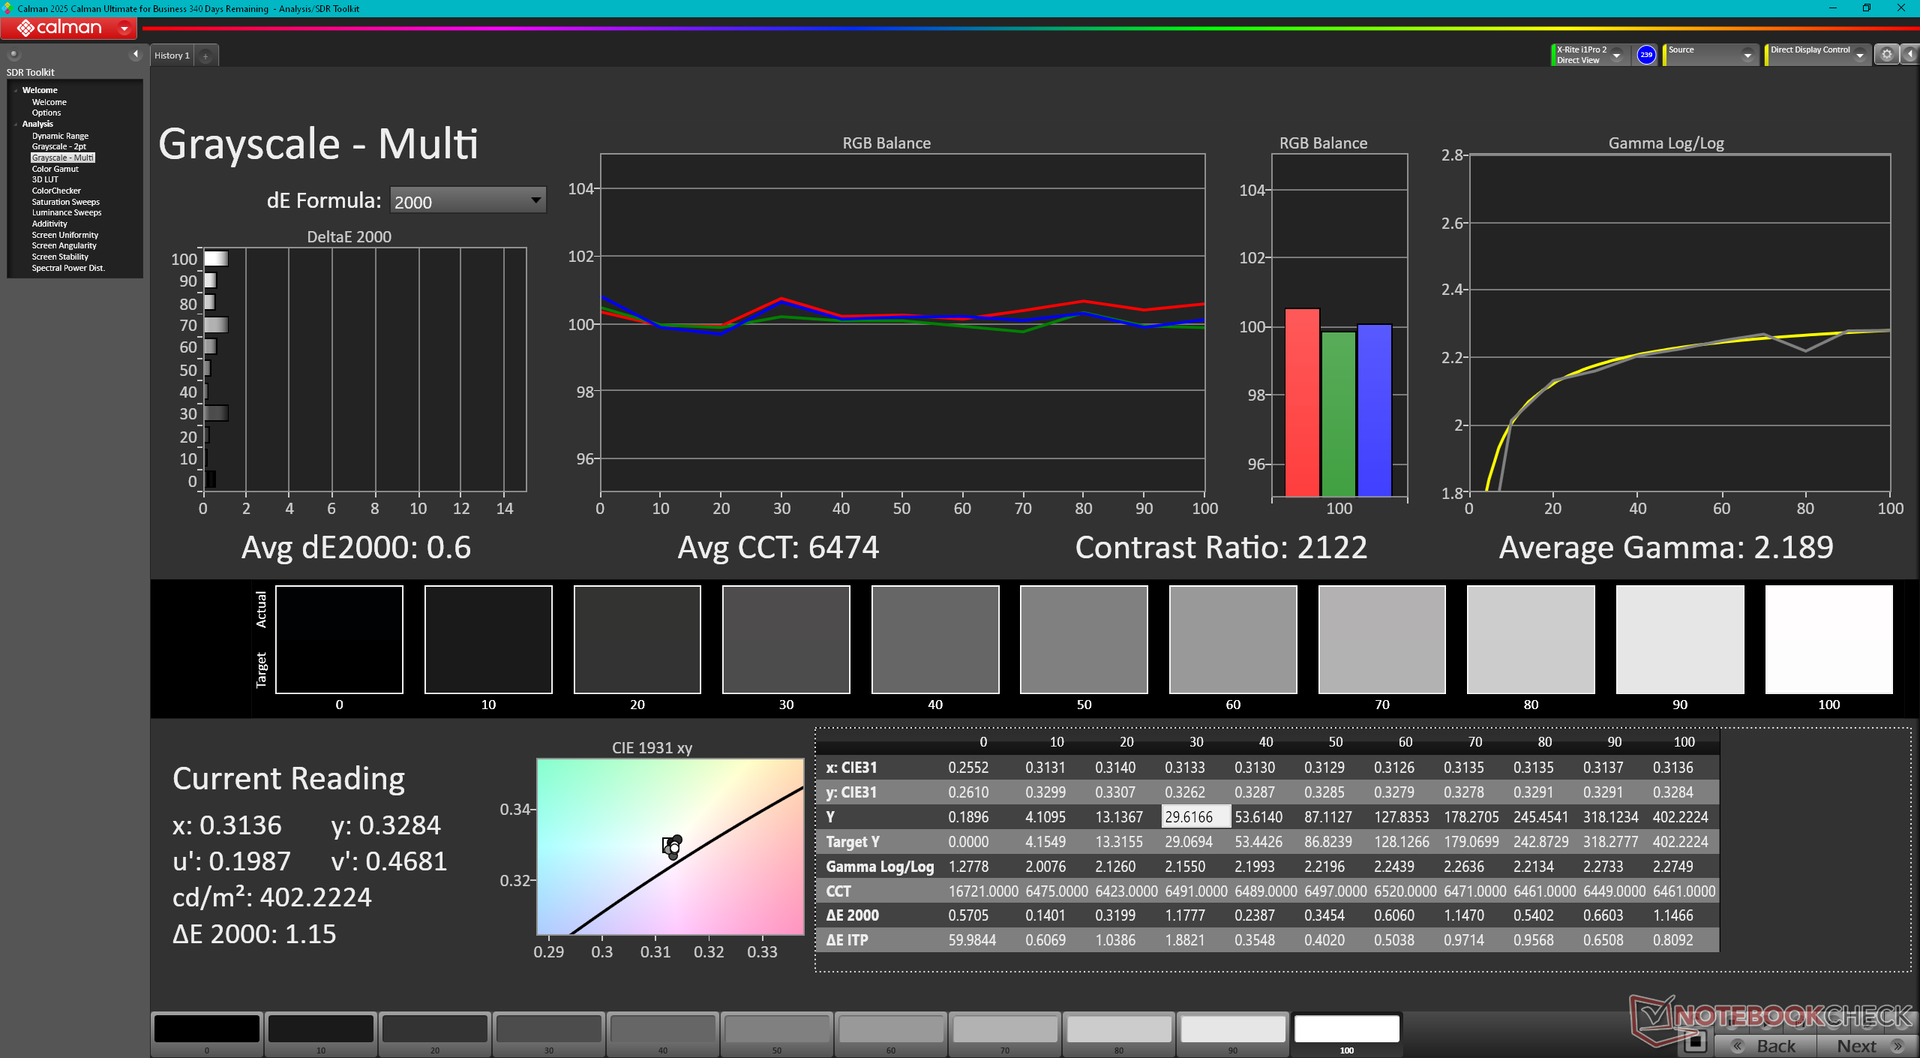
ΔE Greyscale 1.9 | 0.5-98 Ø5.1
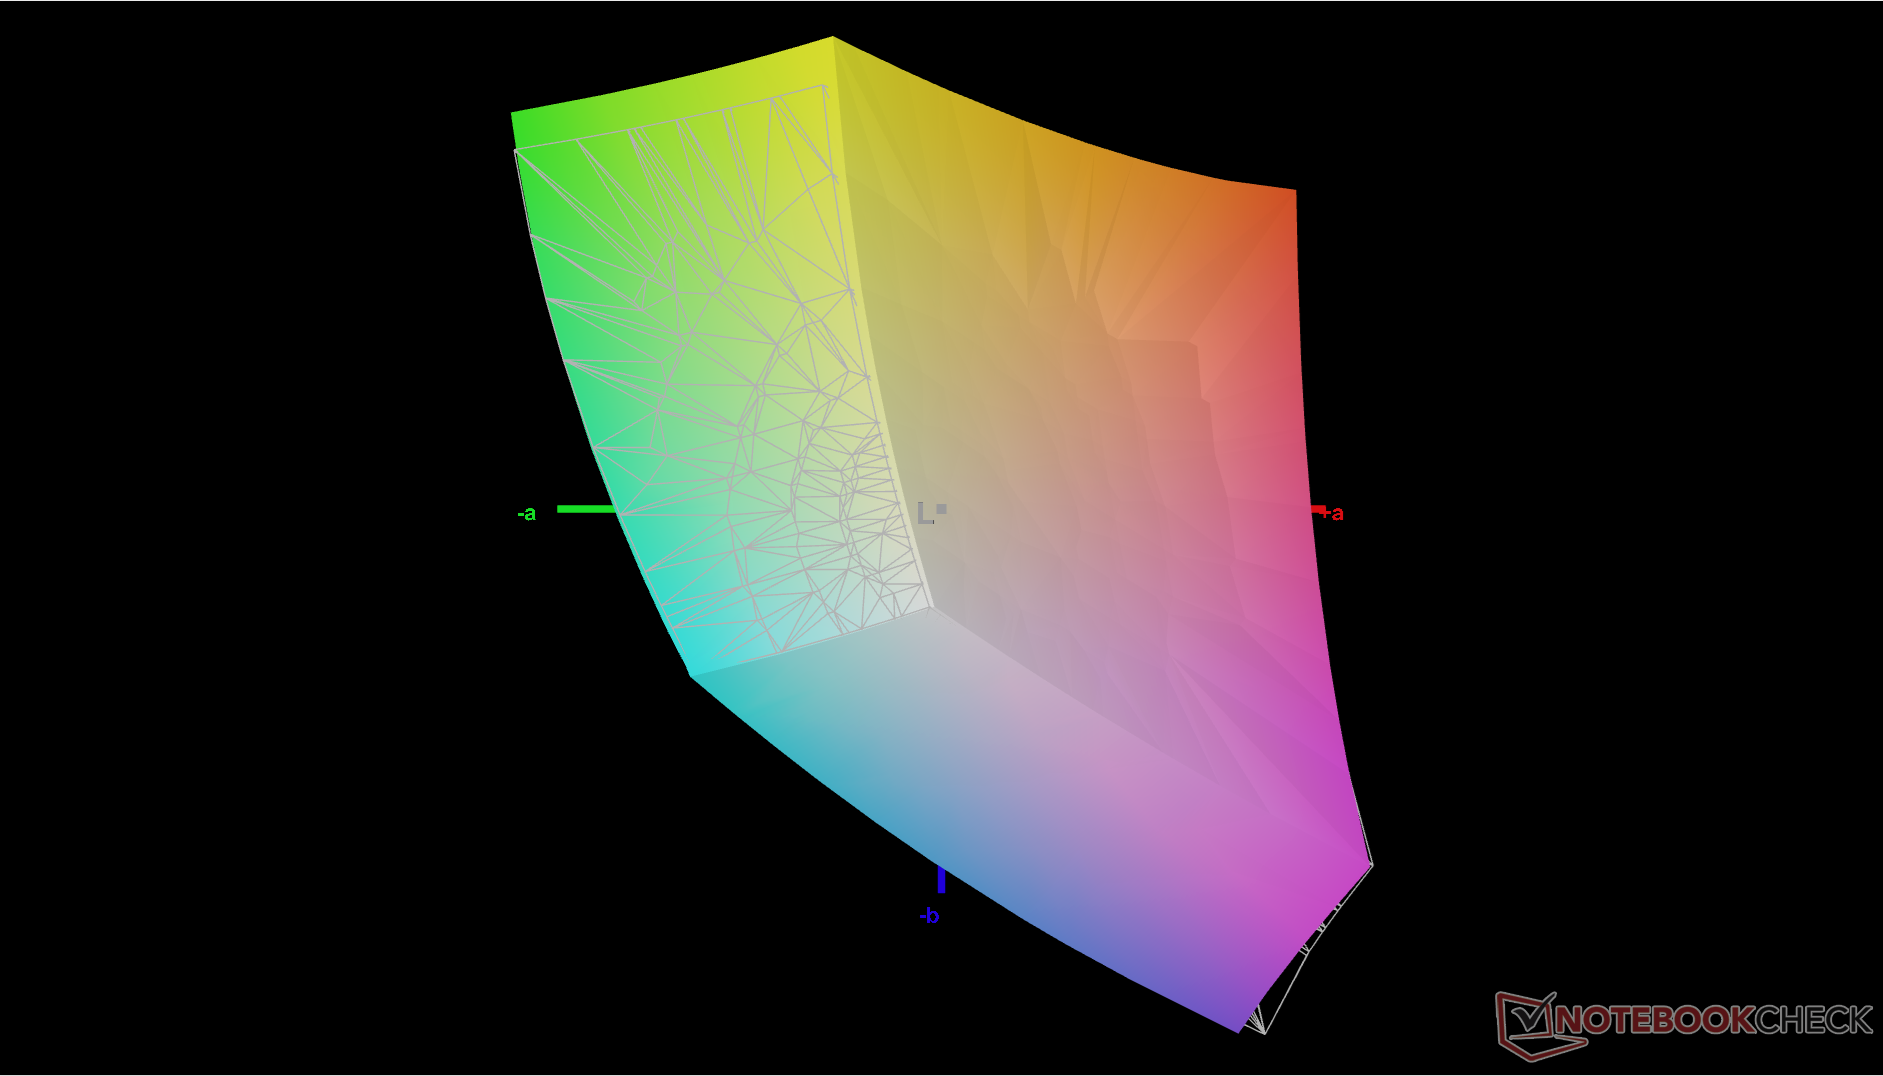
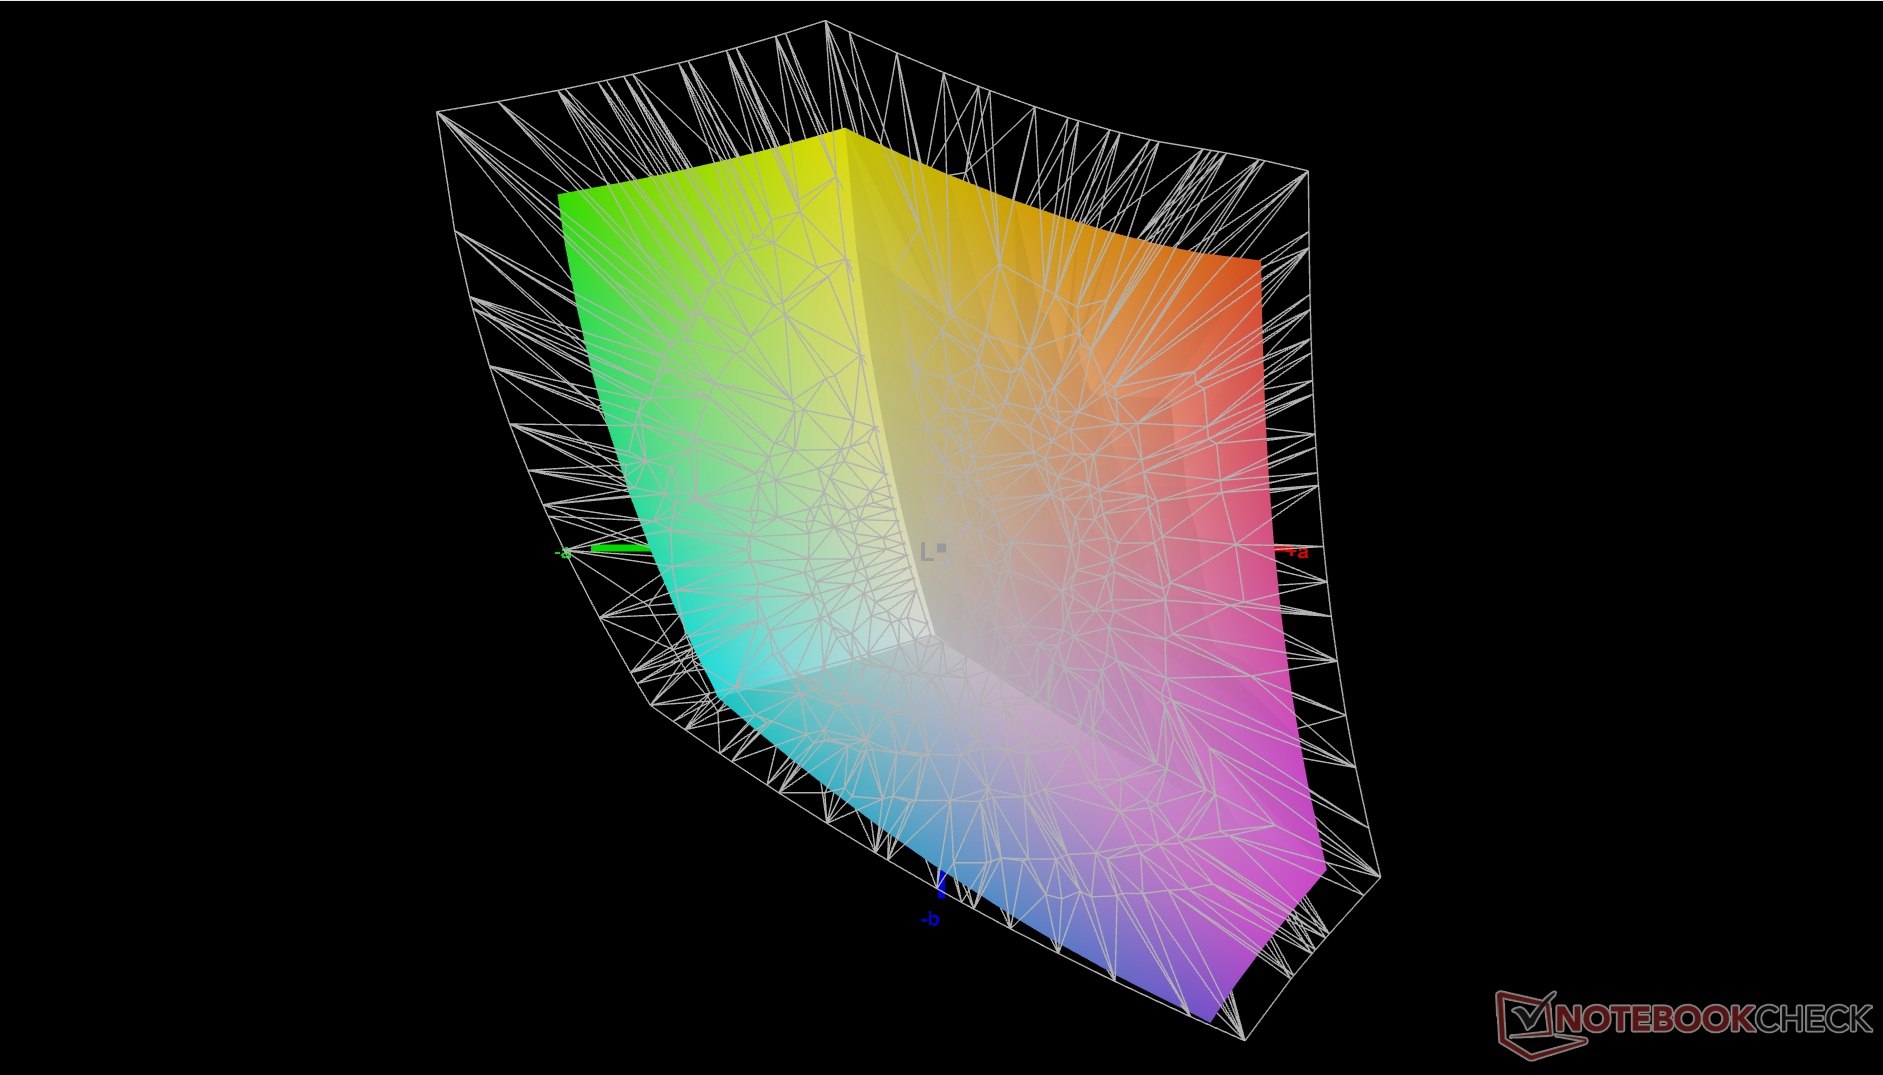
73.1% AdobeRGB 1998 (Argyll 2.2.0 3D)
98.6% sRGB (Argyll 2.2.0 3D)
71.6% Display P3 (Argyll 2.2.0 3D)
Gamma: 2
| MSI Summit E13 AI Evo A1MTG CMN13C6, IPS, 1920x1200, 13.3", 60 Hz | MSI Summit E13 Flip Evo A11MT Sharp LQ134N1JW53, IPS, 1920x1200, 13.4", 120 Hz | Lenovo Yoga Book 9 13IMU9 SDC ATNA33AA02-0, OLED, 2880x1800, 13.3", 60 Hz | Lenovo ThinkPad L13 Yoga G4 i7-1355U NV133WUM-N61, IPS, 1920x1200, 13.3", 60 Hz | HP Elite Dragonfly Folio 13.5 G3 Chi Mei CMN13C0, IPS, 1920x1280, 13.5", 60 Hz | Dell Latitude 9330 AU Optronics B133QAA, IPS, 2560x1600, 13.3", 60 Hz | |
|---|---|---|---|---|---|---|
| Display | -2% | 24% | -0% | -3% | 5% | |
| Display P3 Coverage | 71.6 | 69.8 -3% | 99.7 39% | 71.6 0% | 68.3 -5% | 77.8 9% |
| sRGB Coverage | 98.6 | 98.8 0% | 100 1% | 99.8 1% | 98.6 0% | 99.9 1% |
| AdobeRGB 1998 Coverage | 73.1 | 70.6 -3% | 97 33% | 71.9 -2% | 70.2 -4% | 77.5 6% |
| Response Times | -16% | 96% | 52% | -19% | -29% | |
| Response Time Grey 50% / Grey 80% * | 60 ? | 64 ? -7% | 1.88 ? 97% | 27.3 ? 54% | 66.8 ? -11% | 67.6 ? -13% |
| Response Time Black / White * | 35.1 ? | 44 ? -25% | 2.1 ? 94% | 17.9 ? 49% | 44.4 ? -26% | 50.4 ? -44% |
| PWM Frequency | 60 ? | |||||
| Параметры экрана | -3% | -34% | -25% | -6% | -12% | |
| Яркость в центре | 405.2 | 551.3 36% | 362.6 -11% | 278.1 -31% | 369.5 -9% | 542.3 34% |
| Brightness | 372 | 517 39% | 368 -1% | 280 -25% | 350 -6% | 516 39% |
| Brightness Distribution | 88 | 91 3% | 97 10% | 92 5% | 87 -1% | 85 -3% |
| Уровень чёрного * | 0.34 | 0.37 -9% | 0.34 -0% | 0.24 29% | 0.38 -12% | |
| Контрастность | 1192 | 1490 25% | 818 -31% | 1540 29% | 1427 20% | |
| Colorchecker Delta E * | 2.4 | 1.45 40% | 4.66 -94% | 2.6 -8% | 2.3 4% | 3.18 -33% |
| Colorchecker dE 2000 max. * | 3.56 | 2.86 20% | 7.25 -104% | 4.81 -35% | 4.34 -22% | 6.05 -70% |
| Colorchecker dE 2000 calibrated * | 0.54 | 1.7 -215% | 0.56 -4% | 0.51 6% | 0.6 -11% | 0.67 -24% |
| Delta E для серого * | 1.9 | 1.3 32% | 2.6 -37% | 3.9 -105% | 3.1 -63% | 3.1 -63% |
| Гамма | 2 110% | 2.14 103% | 2.2 100% | 2.29 96% | 2.1 105% | 2.08 106% |
| CCT | 6503 100% | 6580 99% | 6055 107% | 5877 111% | 6248 104% | 6140 106% |
| Покрытие спектра AdobeRGB, % | 65 | |||||
| Color Space (Percent of sRGB) | 99 | |||||
| Среднее значение | -7% /
-5% | 29% /
2% | 9% /
-9% | -9% /
-7% | -12% /
-11% |
* ... меньше = лучше
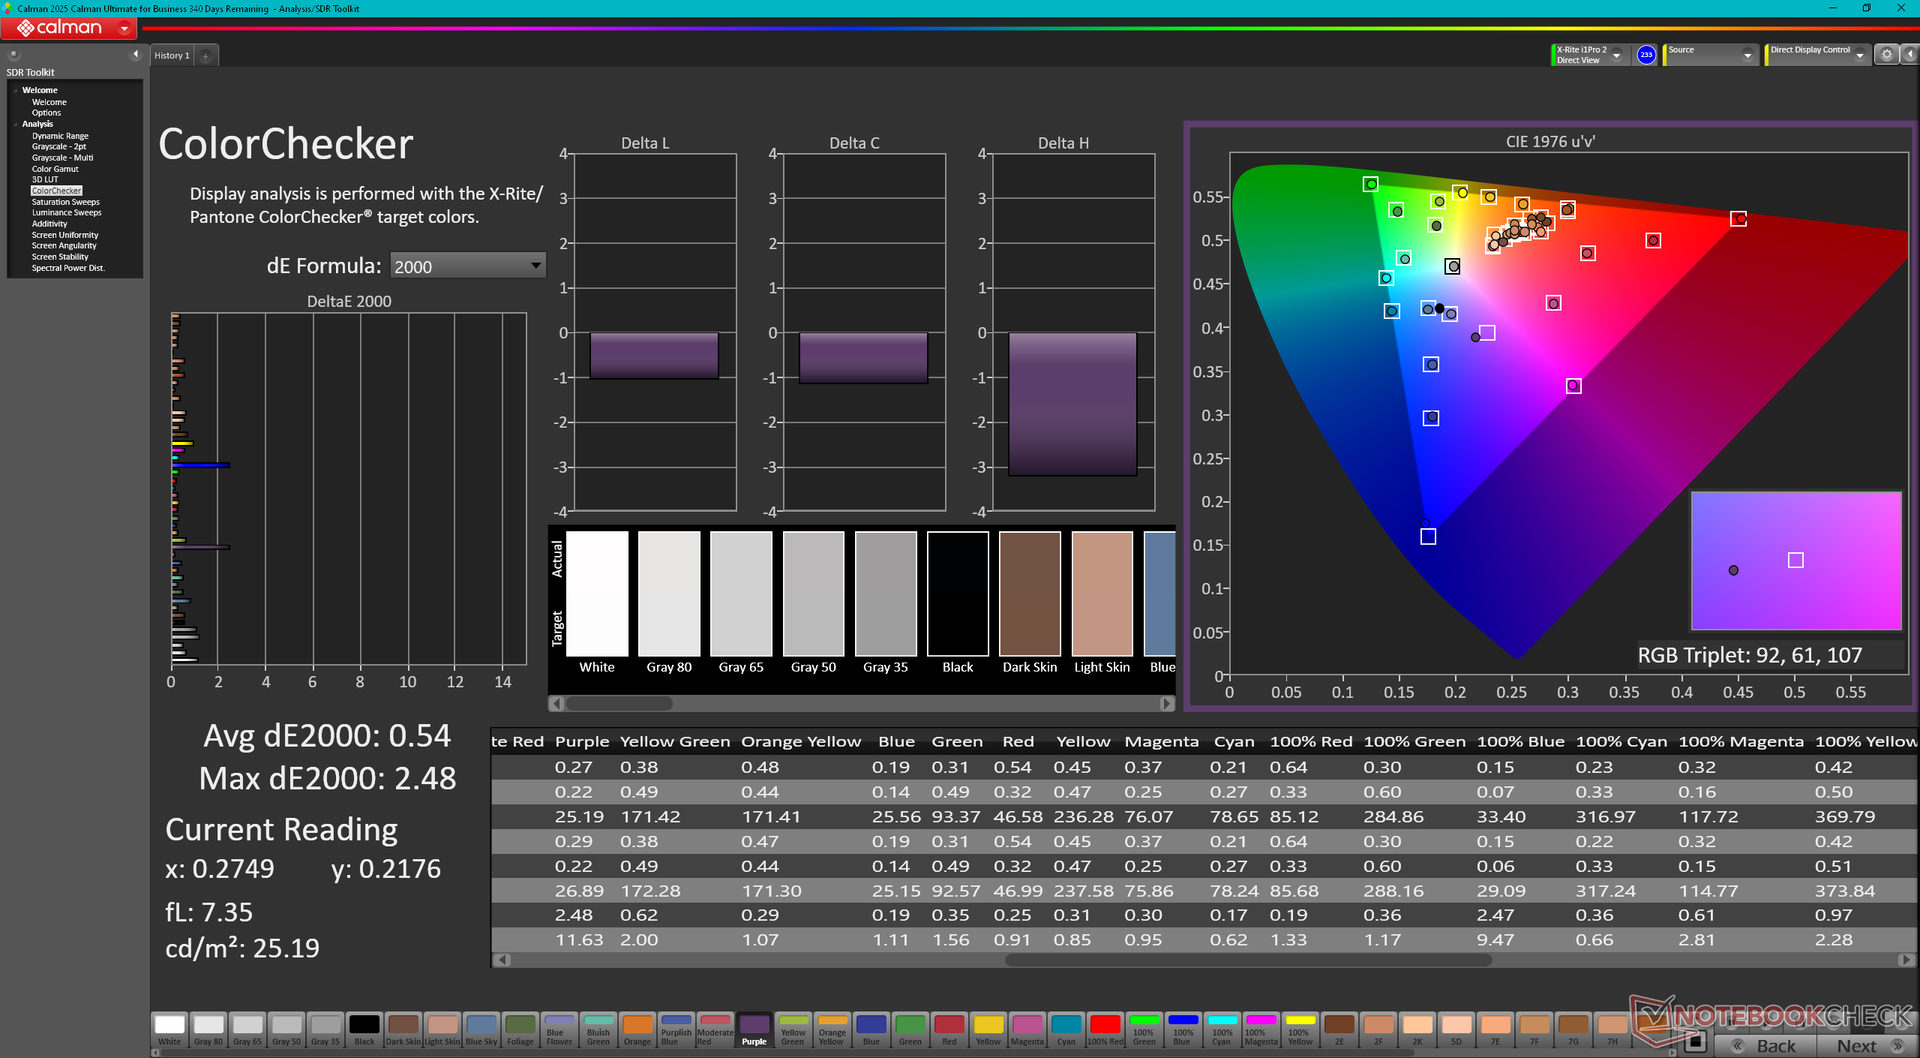
Дисплей может быть прилично откалиброван из коробки, но наша собственная калибровка X-Rite улучшила бы цвета еще больше. Средние значения DeltaE для градаций серого и цвета могут достигать 0,6 и 0,54, соответственно.

Дисплей: тест на время отклика
| ↔ Перемена цвета пикселей, чёрный - белый (1) и белый - чёрный (2) | ||
|---|---|---|
| 35.1 ms ... стадия 1 ↗ и стадия 2 ↘ в сумме | ↗ 17 ms стадия 1 | 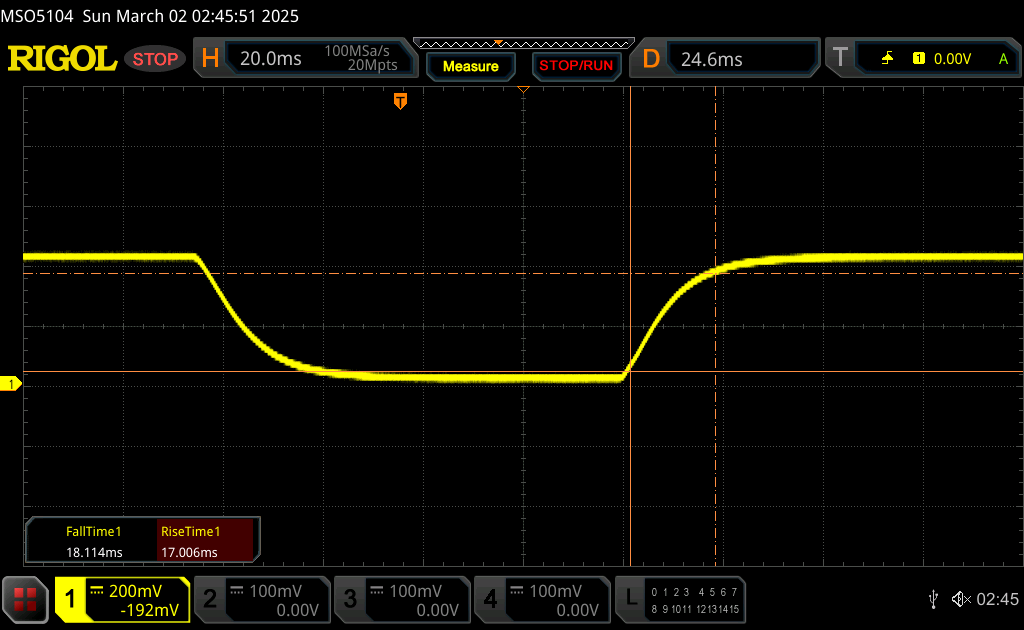 |
| ↘ 18.1 ms стадия 2 | ||
| Это очень большое время отклика. Экран явно не ориентирован на игры и подобные применения. Для сравнения, самый лучший результат среди всех известных нам устройств равен 0.1 миллисек., самый худший - 240 миллисек. » 92% экранов из нашей базы данных показали более хороший результат. Таким образом, тестируемое устройство находится в нижней половине рейтинга (оно отстаёт от среднего результата, равного 20.8 миллисек.) | ||
| ↔ Перемена цвета пикселей, серый 50% - серый 80% (1) и серый 80% - серый 50% (2) | ||
| 60 ms ... стадия 1 ↗ и стадия 2 ↘ в сумме | ↗ 27.2 ms стадия 1 | 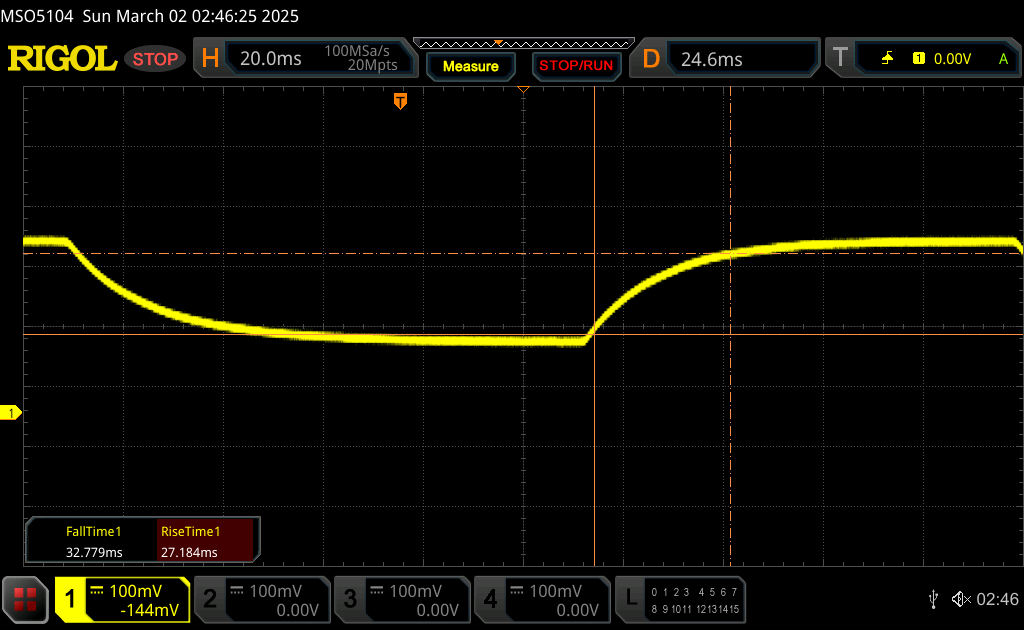 |
| ↘ 32.8 ms стадия 2 | ||
| Это очень большое время отклика. Экран явно не ориентирован на игры и подобные применения. Для сравнения, самый лучший результат среди всех известных нам устройств равен 0.165 миллисек., самый худший - 636 миллисек. » 95% экранов из нашей базы данных показали более хороший результат. Таким образом, тестируемое устройство находится в нижней половине рейтинга (оно отстаёт от среднего результата, равного 32.5 миллисек.) | ||
Тест на мерцание
| Ура! ШИМ не обнаружено | 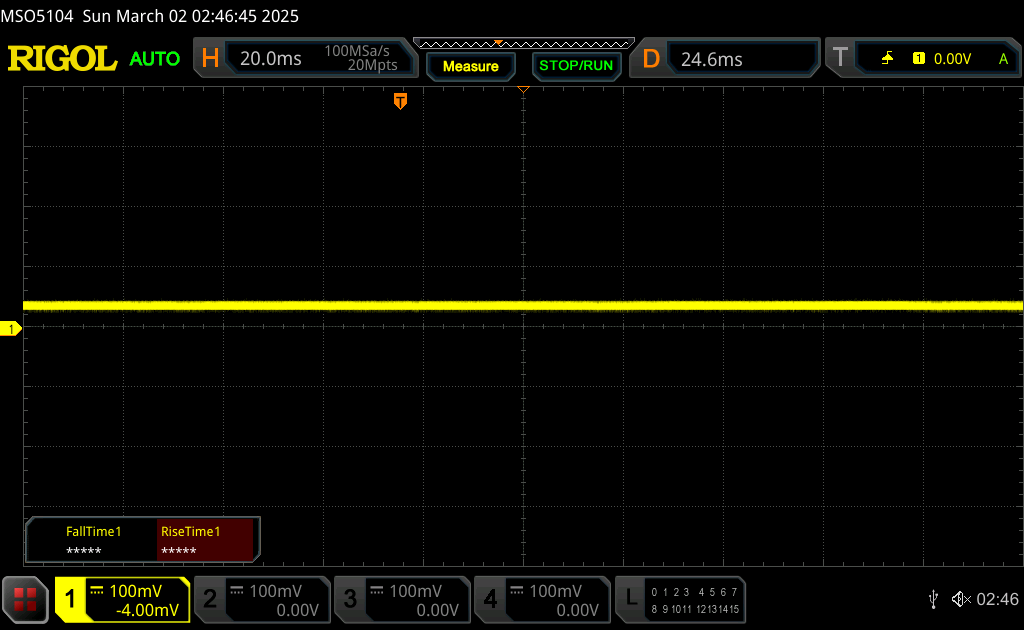 | ||
Для сравнения, 53 % известных нам устройств не применяют PWM для изменения яркости, а среди тех, где PWM используется, типичная частота модуляции составляет 8516 Гц (мин. 5 Гц, макс. 343500 Гц). | |||
Производительность - Core Ultra-H слишком мощный, охлаждение не справляется
Условия тестирования
Мы установили Windows в режим Performance, а MSI Center - в режим Extreme Performance, прежде чем запускать приведенные ниже бенчмарки.
Процессор
Чистая многопоточная производительность процессора падает более чем на 20 процентов уже после первого цикла в нашем стресс-тесте CineBench R15 xT. Следовательно, наша система будет работать примерно на 20% медленнее, чем средний ноутбук в нашей базе данных, оснащенный тем же Core Ultra 7 155H.
Многопоточный тест Cinebench R15
Cinebench R23: Multi Core | Single Core
Cinebench R20: CPU (Multi Core) | CPU (Single Core)
Cinebench R15: CPU Multi 64Bit | CPU Single 64Bit
Blender: v2.79 BMW27 CPU
7-Zip 18.03: 7z b 4 | 7z b 4 -mmt1
Geekbench 6.4: Multi-Core | Single-Core
Geekbench 5.5: Multi-Core | Single-Core
HWBOT x265 Benchmark v2.2: 4k Preset
LibreOffice : 20 Documents To PDF
R Benchmark 2.5: Overall mean
| CPU Performance Rating | |
| Asus ROG Flow Z13 GZ302EA-RU073W | |
| Framework Laptop 13.5 Ryzen 7 7840U | |
| Усредн. модель с Intel Core Ultra 7 155H | |
| MSI Prestige 13 AI Plus Evo A2VMG | |
| MSI Summit E13 AI Evo A1MTG | |
| Dell XPS 13 Plus 9320 4K -2! | |
| Lenovo Yoga Book 9 13IMU9 | |
| Lenovo ThinkPad L13 Yoga G4 i7-1355U | |
| HP Elite Dragonfly Folio 13.5 G3 -2! | |
| Lenovo ThinkPad X13 G3 21BN0046GE -2! | |
| Dell Latitude 9330 -2! | |
| MSI Summit E13 Flip Evo A11MT -2! | |
| Geekbench 6.4 / Multi-Core | |
| Asus ROG Flow Z13 GZ302EA-RU073W | |
| Усредн. модель с Intel Core Ultra 7 155H (7732 - 13656, n=55) | |
| Framework Laptop 13.5 Ryzen 7 7840U | |
| MSI Prestige 13 AI Plus Evo A2VMG | |
| MSI Summit E13 AI Evo A1MTG | |
| Lenovo Yoga Book 9 13IMU9 | |
| Lenovo ThinkPad L13 Yoga G4 i7-1355U | |
| Geekbench 6.4 / Single-Core | |
| Asus ROG Flow Z13 GZ302EA-RU073W | |
| MSI Prestige 13 AI Plus Evo A2VMG | |
| Framework Laptop 13.5 Ryzen 7 7840U | |
| Lenovo ThinkPad L13 Yoga G4 i7-1355U | |
| Усредн. модель с Intel Core Ultra 7 155H (1901 - 2473, n=52) | |
| Lenovo Yoga Book 9 13IMU9 | |
| MSI Summit E13 AI Evo A1MTG | |
* ... меньше = лучше
AIDA64: FP32 Ray-Trace | FPU Julia | CPU SHA3 | CPU Queen | FPU SinJulia | FPU Mandel | CPU AES | CPU ZLib | FP64 Ray-Trace | CPU PhotoWorxx
| Performance Rating | |
| Усредн. модель с Intel Core Ultra 7 155H | |
| MSI Summit E13 AI Evo A1MTG | |
| Lenovo Yoga Book 9 13IMU9 | |
| MSI Summit E13 Flip Evo A11MT | |
| HP Elite Dragonfly Folio 13.5 G3 | |
| Lenovo ThinkPad L13 Yoga G4 i7-1355U | |
| Dell Latitude 9330 | |
| AIDA64 / FP32 Ray-Trace | |
| Усредн. модель с Intel Core Ultra 7 155H (6670 - 18470, n=50) | |
| MSI Summit E13 AI Evo A1MTG | |
| Lenovo Yoga Book 9 13IMU9 | |
| MSI Summit E13 Flip Evo A11MT | |
| Dell Latitude 9330 | |
| HP Elite Dragonfly Folio 13.5 G3 | |
| Lenovo ThinkPad L13 Yoga G4 i7-1355U | |
| AIDA64 / FPU Julia | |
| Усредн. модель с Intel Core Ultra 7 155H (40905 - 93181, n=50) | |
| MSI Summit E13 AI Evo A1MTG | |
| Lenovo Yoga Book 9 13IMU9 | |
| HP Elite Dragonfly Folio 13.5 G3 | |
| Dell Latitude 9330 | |
| Lenovo ThinkPad L13 Yoga G4 i7-1355U | |
| MSI Summit E13 Flip Evo A11MT | |
| AIDA64 / CPU SHA3 | |
| Усредн. модель с Intel Core Ultra 7 155H (1940 - 4436, n=50) | |
| MSI Summit E13 AI Evo A1MTG | |
| Lenovo Yoga Book 9 13IMU9 | |
| MSI Summit E13 Flip Evo A11MT | |
| Dell Latitude 9330 | |
| Lenovo ThinkPad L13 Yoga G4 i7-1355U | |
| HP Elite Dragonfly Folio 13.5 G3 | |
| AIDA64 / CPU Queen | |
| Усредн. модель с Intel Core Ultra 7 155H (64698 - 94181, n=50) | |
| MSI Summit E13 AI Evo A1MTG | |
| HP Elite Dragonfly Folio 13.5 G3 | |
| Lenovo ThinkPad L13 Yoga G4 i7-1355U | |
| MSI Summit E13 Flip Evo A11MT | |
| Dell Latitude 9330 | |
| Lenovo Yoga Book 9 13IMU9 | |
| AIDA64 / FPU SinJulia | |
| Усредн. модель с Intel Core Ultra 7 155H (5639 - 10647, n=50) | |
| MSI Summit E13 AI Evo A1MTG | |
| Lenovo Yoga Book 9 13IMU9 | |
| MSI Summit E13 Flip Evo A11MT | |
| HP Elite Dragonfly Folio 13.5 G3 | |
| Lenovo ThinkPad L13 Yoga G4 i7-1355U | |
| Dell Latitude 9330 | |
| AIDA64 / FPU Mandel | |
| Усредн. модель с Intel Core Ultra 7 155H (18236 - 47685, n=50) | |
| MSI Summit E13 AI Evo A1MTG | |
| Lenovo Yoga Book 9 13IMU9 | |
| MSI Summit E13 Flip Evo A11MT | |
| HP Elite Dragonfly Folio 13.5 G3 | |
| Dell Latitude 9330 | |
| Lenovo ThinkPad L13 Yoga G4 i7-1355U | |
| AIDA64 / CPU AES | |
| Усредн. модель с Intel Core Ultra 7 155H (45713 - 152179, n=50) | |
| MSI Summit E13 Flip Evo A11MT | |
| MSI Summit E13 AI Evo A1MTG | |
| Lenovo Yoga Book 9 13IMU9 | |
| HP Elite Dragonfly Folio 13.5 G3 | |
| Lenovo ThinkPad L13 Yoga G4 i7-1355U | |
| Dell Latitude 9330 | |
| AIDA64 / CPU ZLib | |
| Усредн. модель с Intel Core Ultra 7 155H (557 - 1250, n=50) | |
| MSI Summit E13 AI Evo A1MTG | |
| Lenovo Yoga Book 9 13IMU9 | |
| HP Elite Dragonfly Folio 13.5 G3 | |
| Lenovo ThinkPad L13 Yoga G4 i7-1355U | |
| Dell Latitude 9330 | |
| MSI Summit E13 Flip Evo A11MT | |
| AIDA64 / FP64 Ray-Trace | |
| Усредн. модель с Intel Core Ultra 7 155H (3569 - 9802, n=50) | |
| MSI Summit E13 AI Evo A1MTG | |
| Lenovo Yoga Book 9 13IMU9 | |
| MSI Summit E13 Flip Evo A11MT | |
| Dell Latitude 9330 | |
| HP Elite Dragonfly Folio 13.5 G3 | |
| Lenovo ThinkPad L13 Yoga G4 i7-1355U | |
| AIDA64 / CPU PhotoWorxx | |
| Усредн. модель с Intel Core Ultra 7 155H (32719 - 54223, n=50) | |
| Lenovo Yoga Book 9 13IMU9 | |
| HP Elite Dragonfly Folio 13.5 G3 | |
| MSI Summit E13 AI Evo A1MTG | |
| MSI Summit E13 Flip Evo A11MT | |
| Dell Latitude 9330 | |
| Lenovo ThinkPad L13 Yoga G4 i7-1355U | |
Стресс-тест
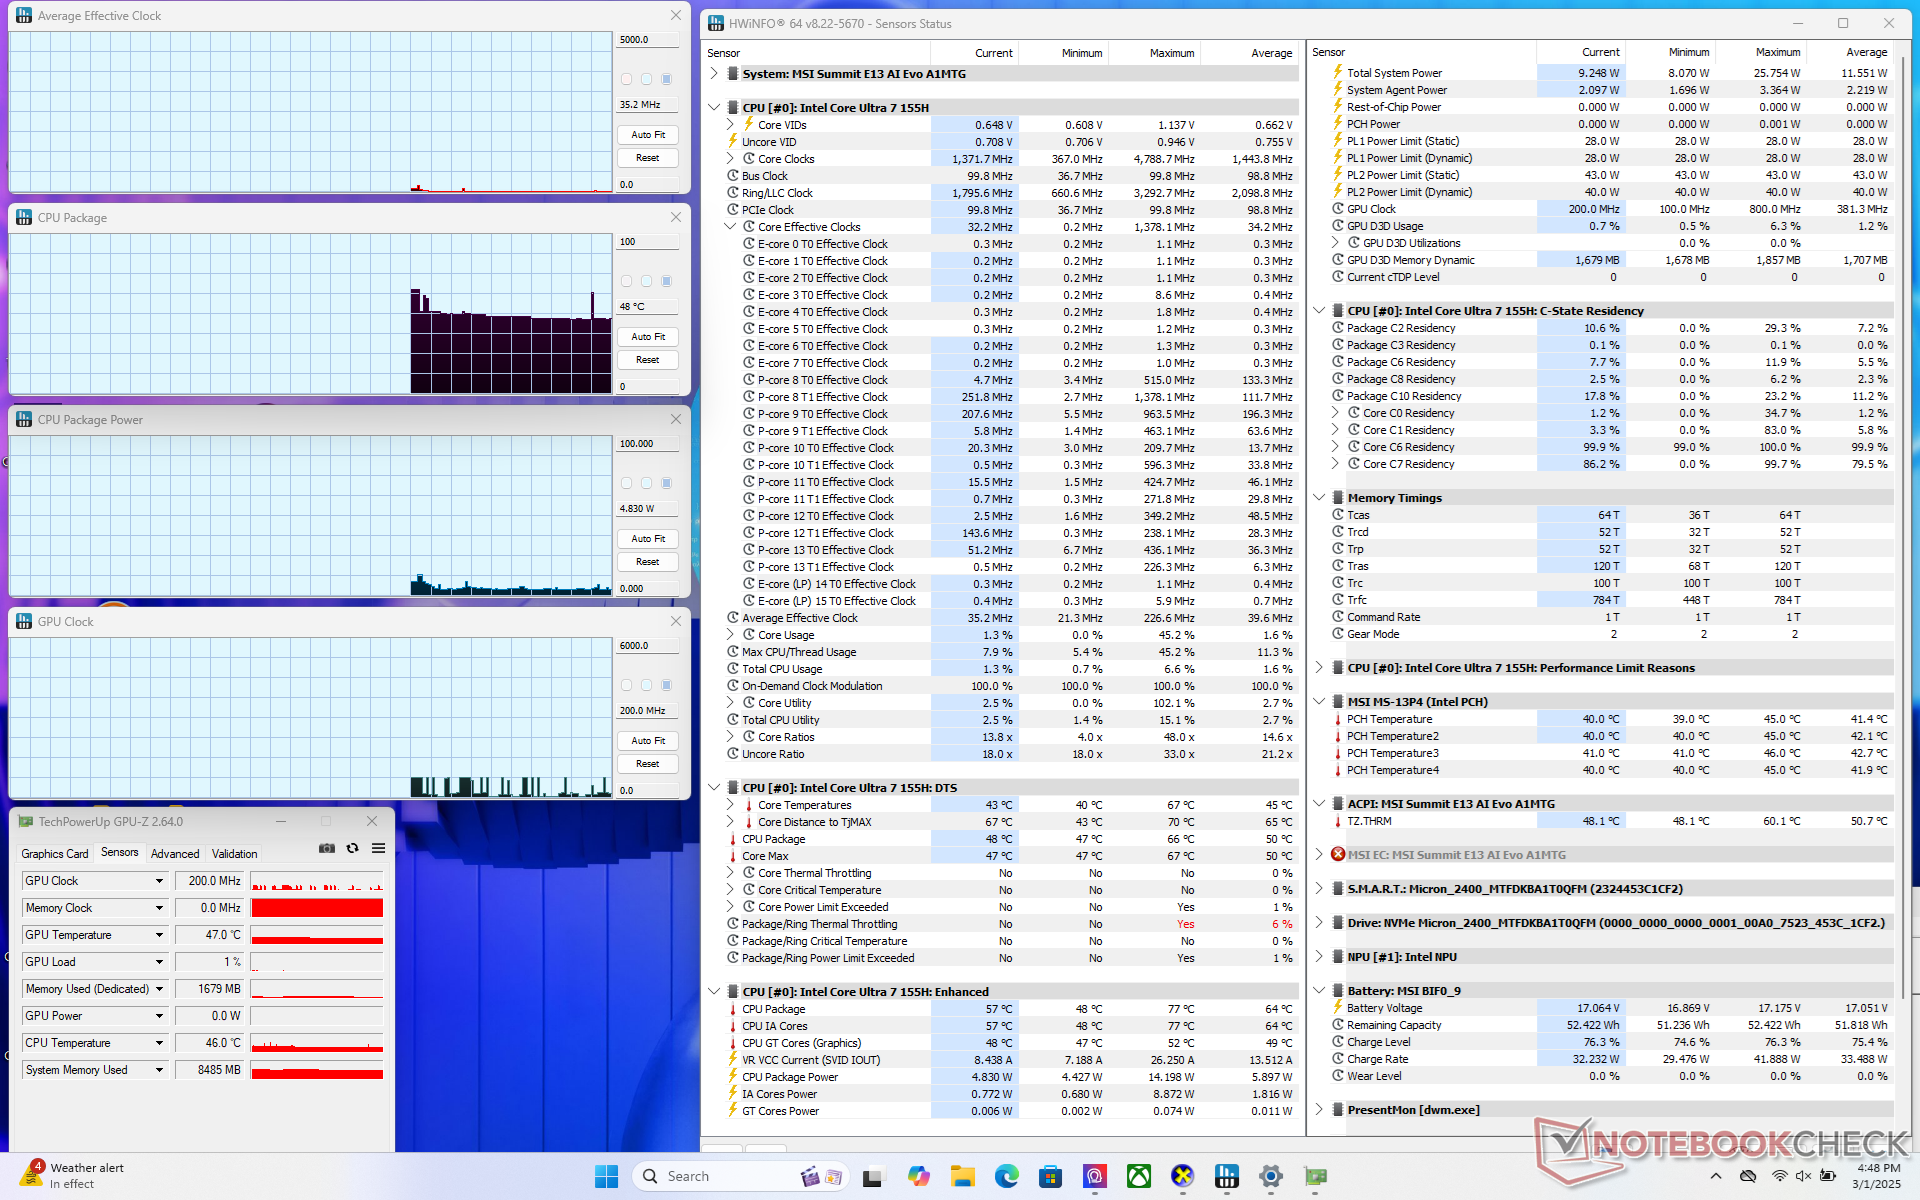
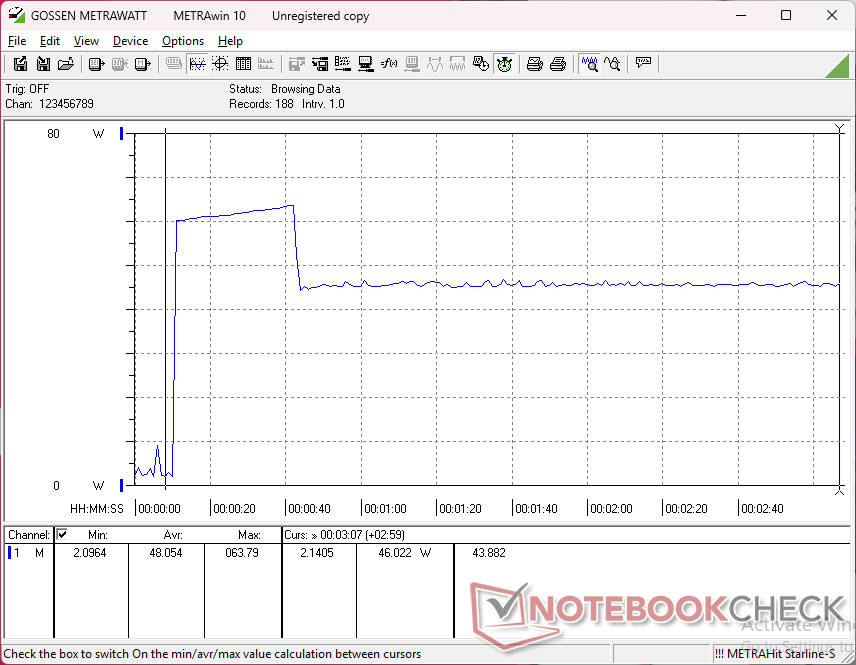
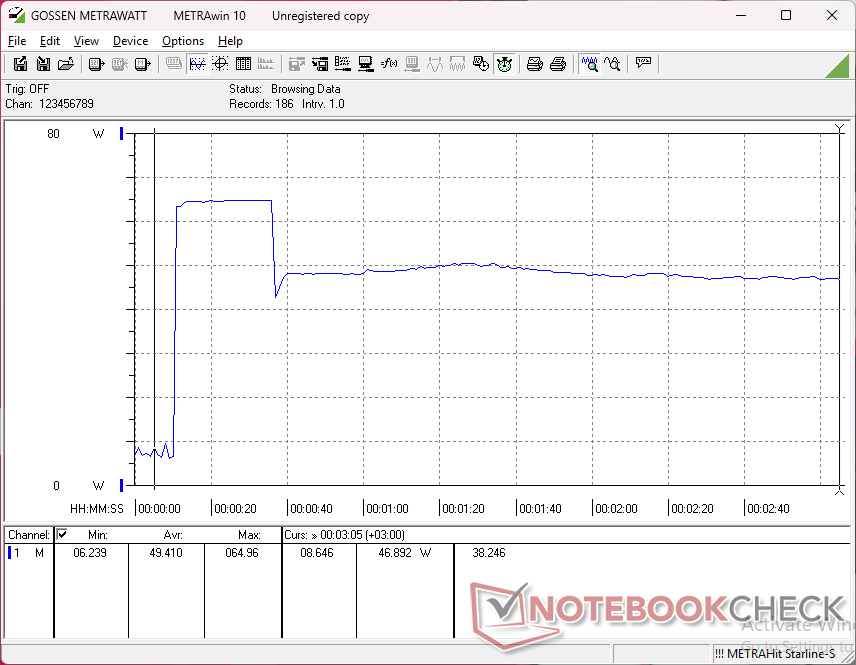
При запуске Prime95 процессор разгонялся до 2,1 ГГц и 41 Вт, пока через несколько мгновений не достигал температуры ядра 84 C. Затем он стабилизируется на частоте 1,3 ГГц и мощности 28 Вт, чтобы поддерживать температуру ядра на уровне 81 C при включенном Cooler Boost. Температура ядра повысится всего на несколько градусов, если Cooler Boost отключить.
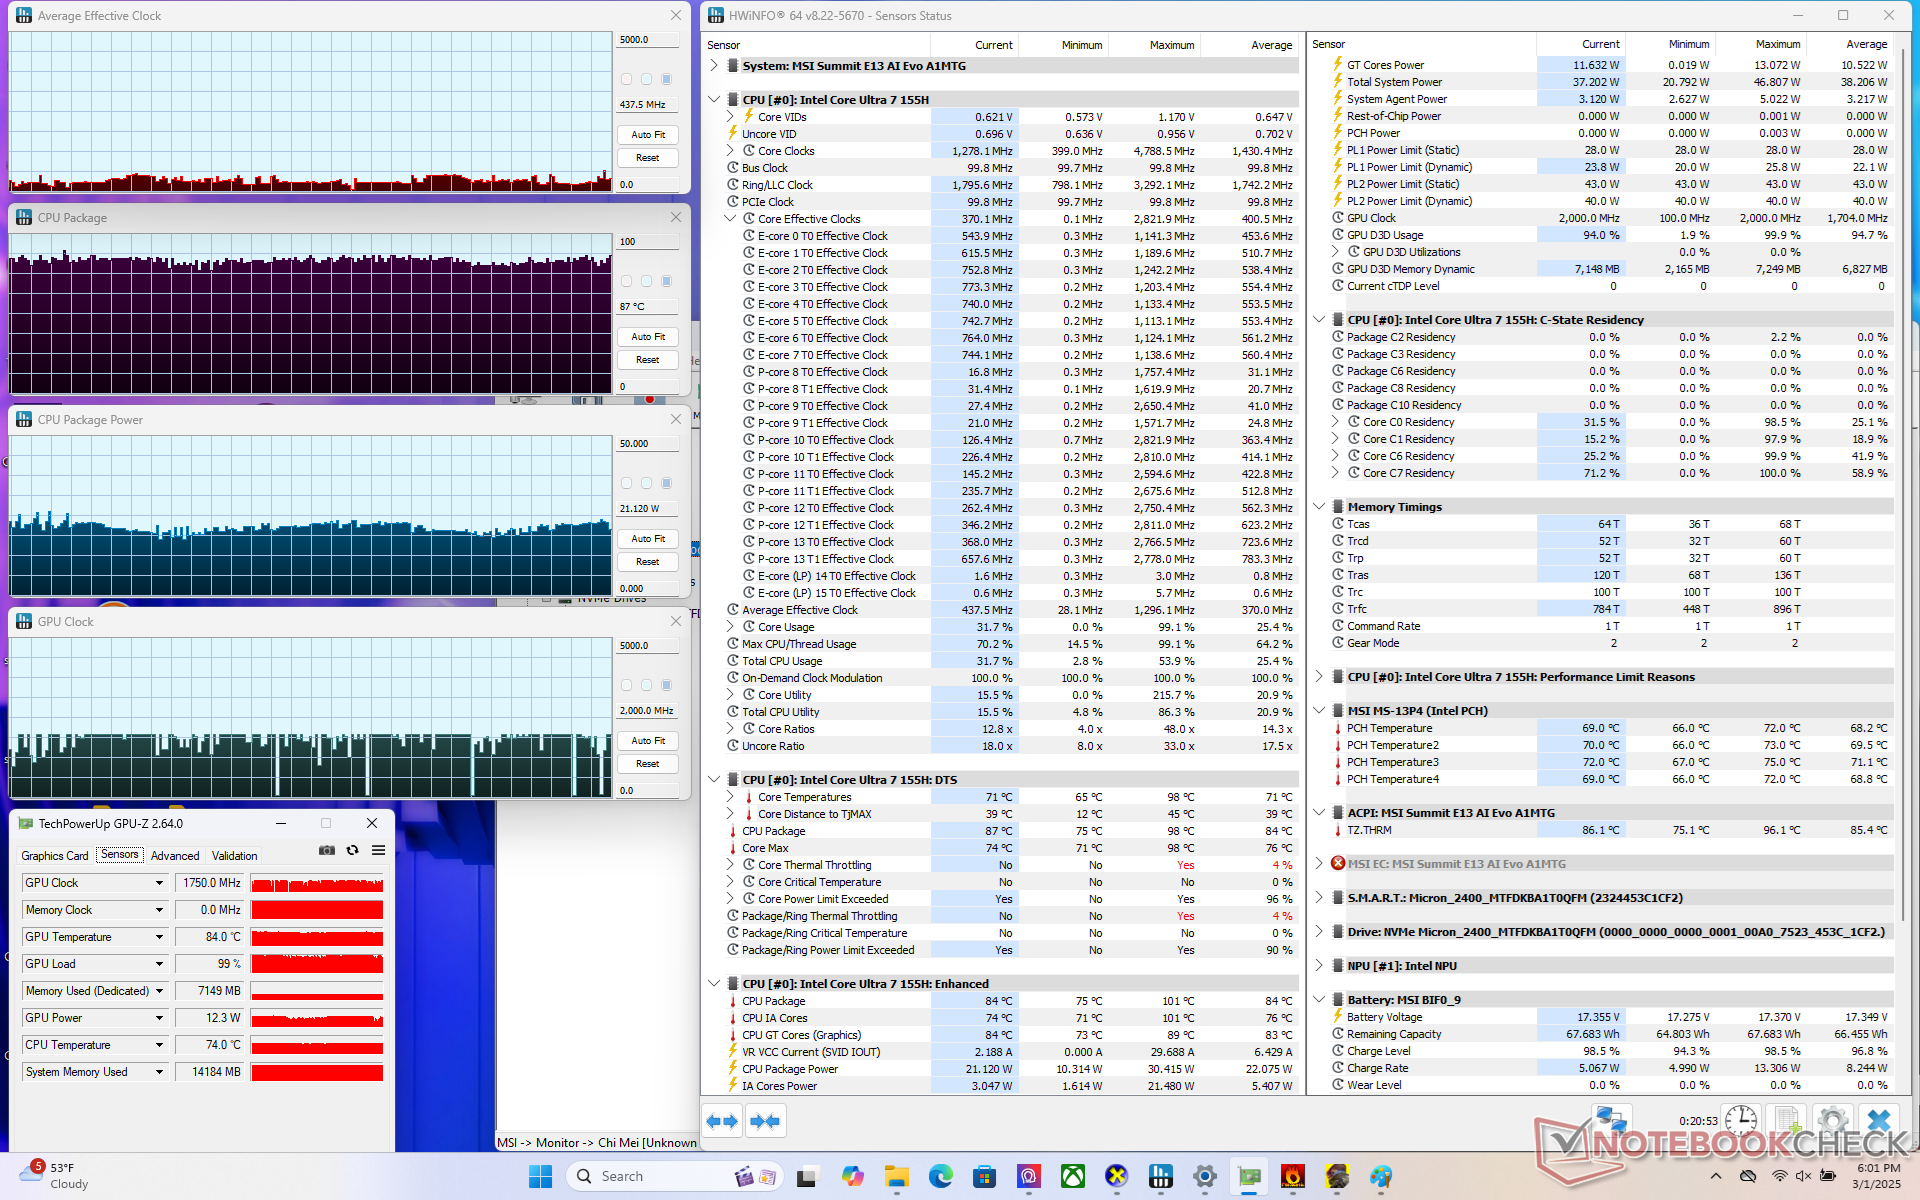
При запуске Cyberpunk 2077 тактовая частота GPU была относительно нестабильной, как показано на скриншоте ниже, даже в режиме простоя в игре. Это отражает нестабильную частоту кадров, как отмечено в разделе "Производительность GPU" ниже. Температура ядра также была очень высокой - 87 C или более чем на 10 C теплее, чем у модели 2021 года.

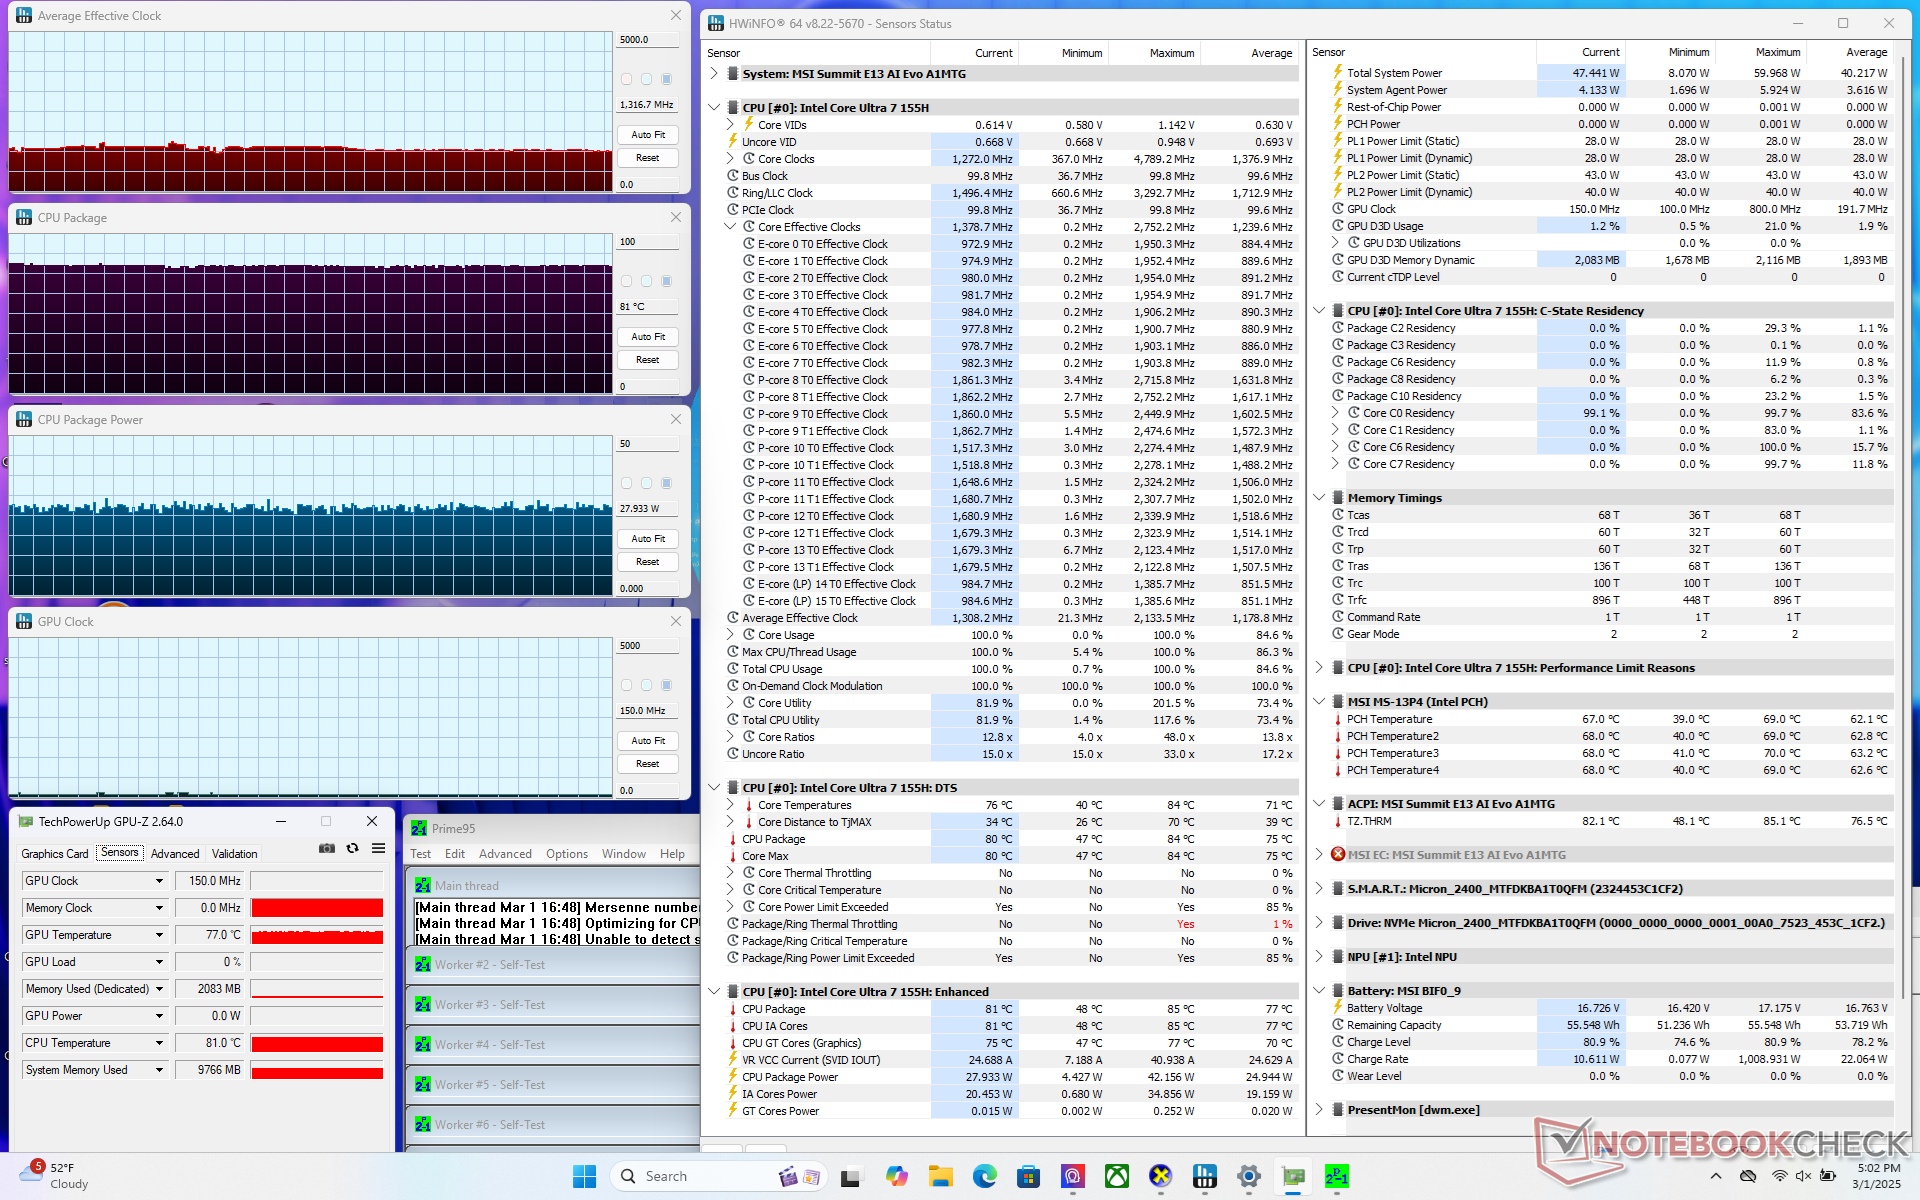
| Средняя тактовая частота процессора (ГГц) | Тактовая частота графического процессора (МГц) | Средняя температура процессора (°C) | |
| Без нагрузки | -- | -- | 48 |
| Prime95 (Cooler Boost) | 1.3 | -- | 81 |
| Prime95 | 1.3 | -- | 81 |
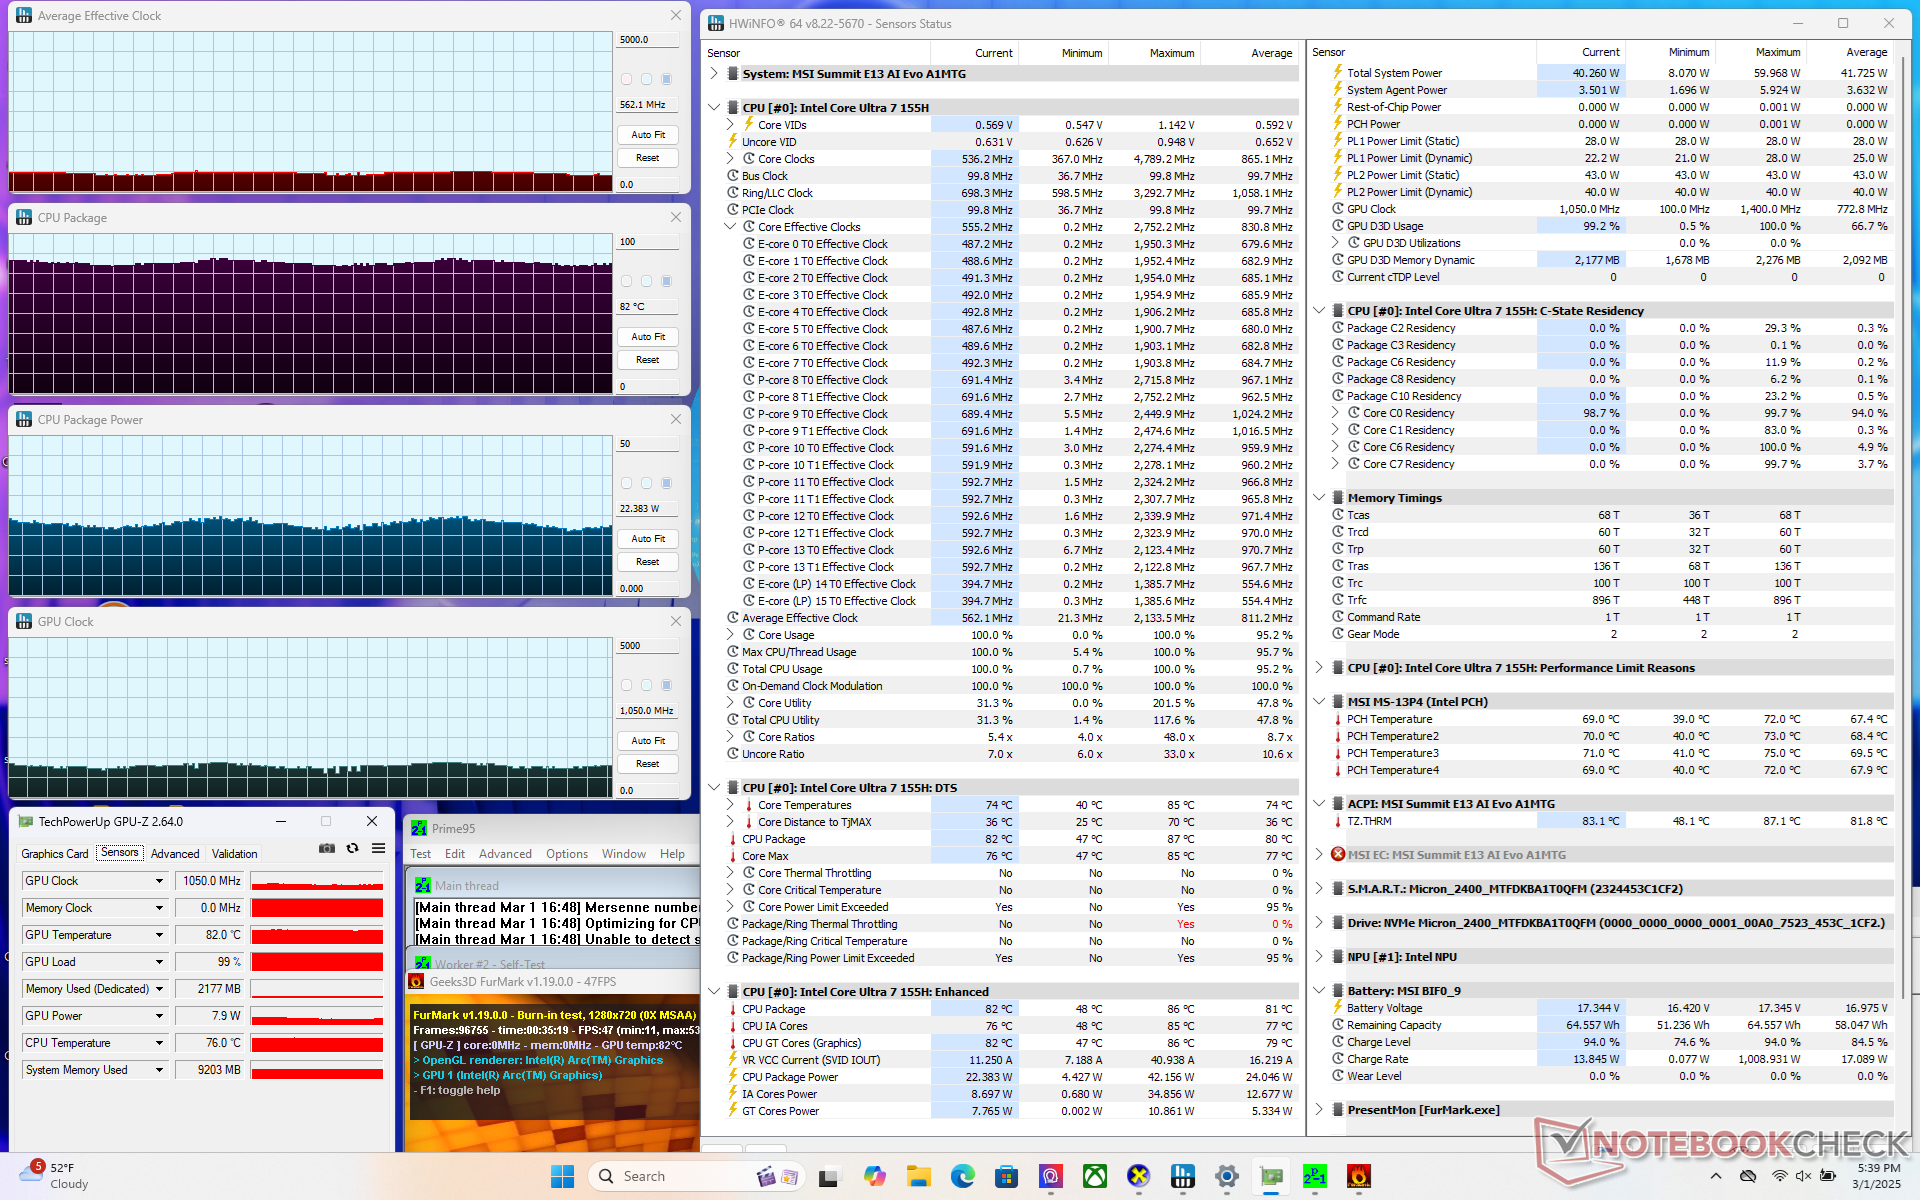
| Prime95 + FurMark | 0.6 | 1050 | 82 |
| Cyberpunk 2077 | 0.4 | ~2000 | 87 |
Производительность системы
CrossMark: Overall | Productivity | Creativity | Responsiveness
WebXPRT 3: Overall
WebXPRT 4: Overall
Mozilla Kraken 1.1: Total
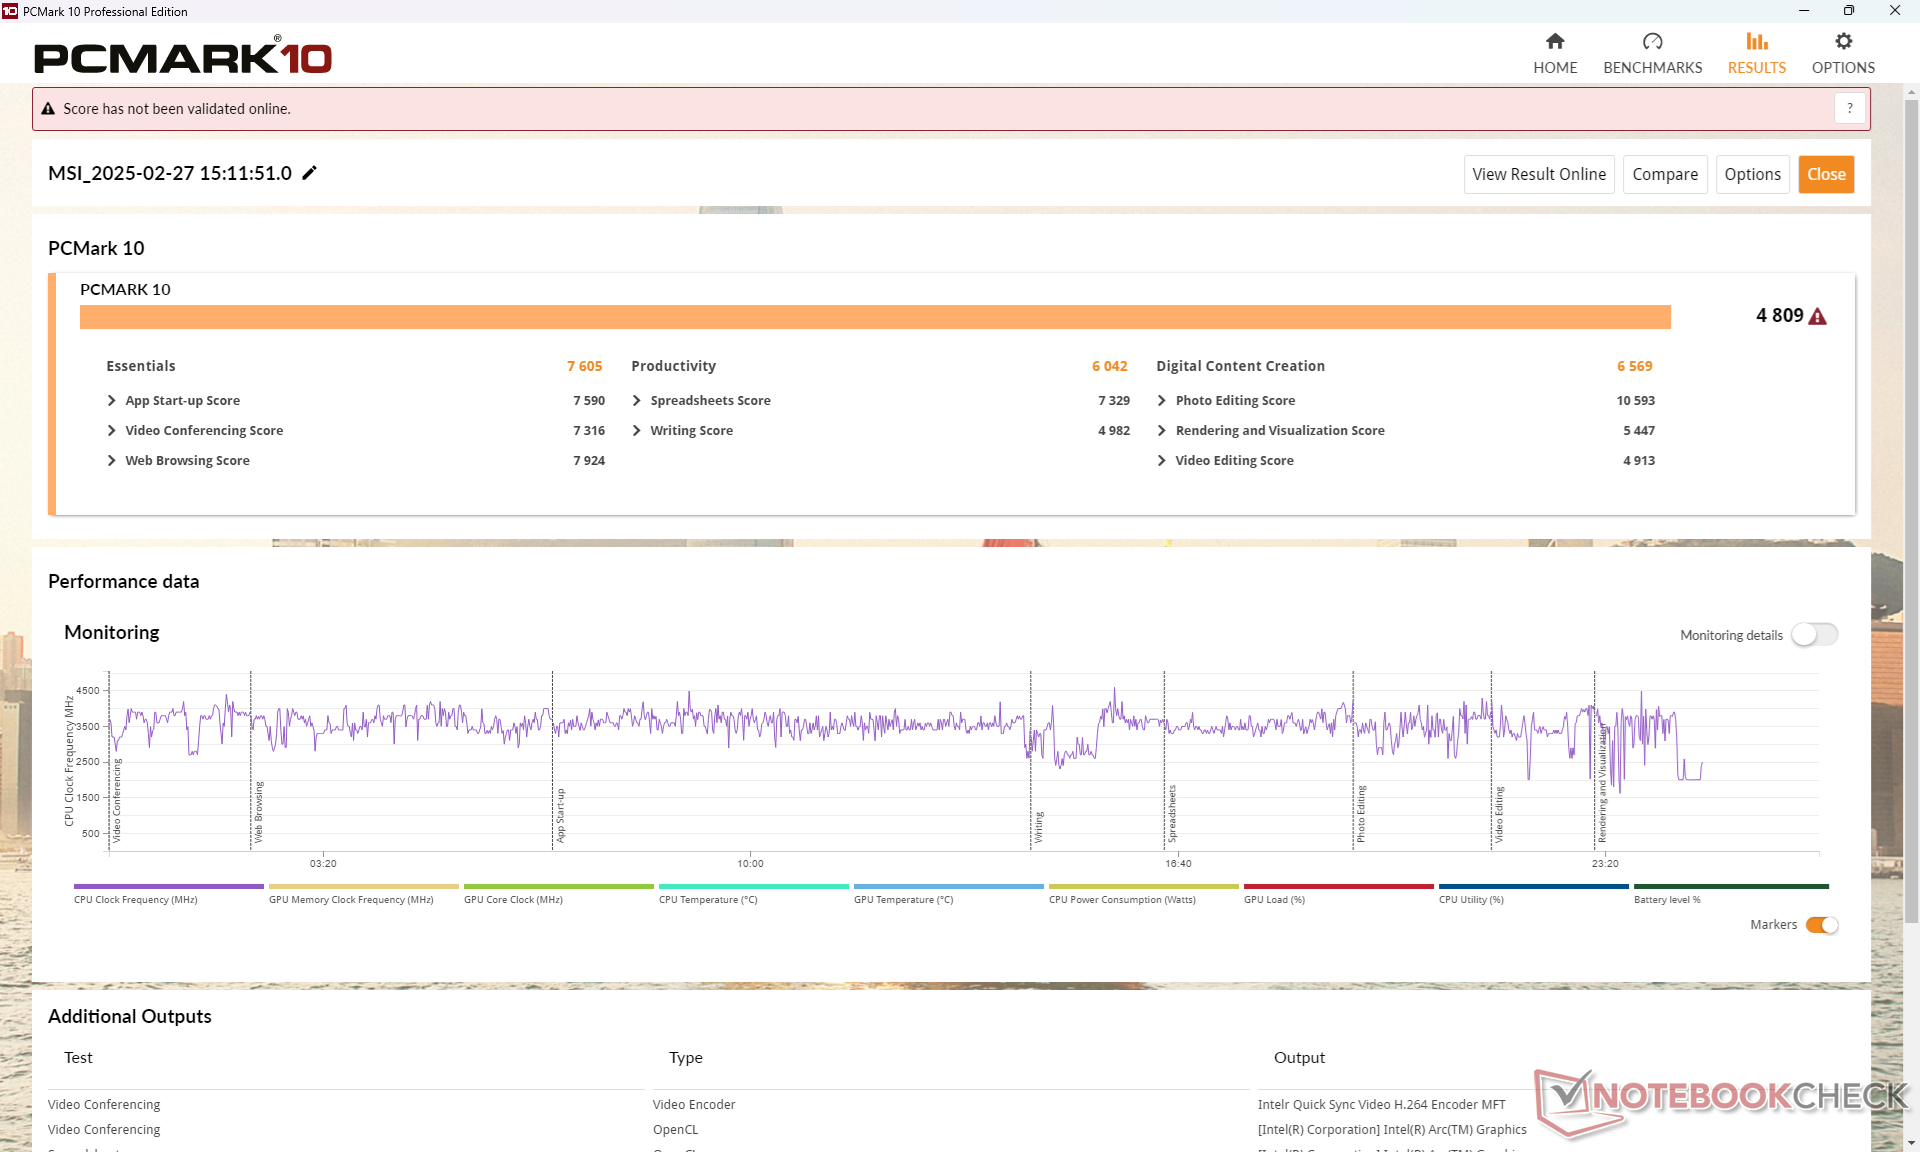
| PCMark 10 / Score | |
| Усредн. модель с Intel Core Ultra 7 155H, Intel Arc 8-Core iGPU (4809 - 7529, n=34) | |
| Lenovo Yoga Book 9 13IMU9 | |
| Lenovo ThinkPad L13 Yoga G4 i7-1355U | |
| HP Elite Dragonfly Folio 13.5 G3 | |
| Dell Latitude 9330 | |
| MSI Summit E13 AI Evo A1MTG | |
| MSI Summit E13 Flip Evo A11MT | |
| PCMark 10 / Essentials | |
| HP Elite Dragonfly Folio 13.5 G3 | |
| Lenovo ThinkPad L13 Yoga G4 i7-1355U | |
| Lenovo Yoga Book 9 13IMU9 | |
| Усредн. модель с Intel Core Ultra 7 155H, Intel Arc 8-Core iGPU (7605 - 11289, n=34) | |
| Dell Latitude 9330 | |
| MSI Summit E13 Flip Evo A11MT | |
| MSI Summit E13 AI Evo A1MTG | |
| PCMark 10 / Productivity | |
| Усредн. модель с Intel Core Ultra 7 155H, Intel Arc 8-Core iGPU (6042 - 10591, n=34) | |
| Lenovo Yoga Book 9 13IMU9 | |
| Lenovo ThinkPad L13 Yoga G4 i7-1355U | |
| HP Elite Dragonfly Folio 13.5 G3 | |
| Dell Latitude 9330 | |
| MSI Summit E13 Flip Evo A11MT | |
| MSI Summit E13 AI Evo A1MTG | |
| PCMark 10 / Digital Content Creation | |
| Усредн. модель с Intel Core Ultra 7 155H, Intel Arc 8-Core iGPU (4985 - 10709, n=34) | |
| Lenovo Yoga Book 9 13IMU9 | |
| MSI Summit E13 AI Evo A1MTG | |
| Lenovo ThinkPad L13 Yoga G4 i7-1355U | |
| HP Elite Dragonfly Folio 13.5 G3 | |
| Dell Latitude 9330 | |
| MSI Summit E13 Flip Evo A11MT | |
| CrossMark / Overall | |
| Усредн. модель с Intel Core Ultra 7 155H, Intel Arc 8-Core iGPU (1366 - 1903, n=34) | |
| MSI Summit E13 AI Evo A1MTG | |
| HP Elite Dragonfly Folio 13.5 G3 | |
| Lenovo ThinkPad L13 Yoga G4 i7-1355U | |
| Lenovo Yoga Book 9 13IMU9 | |
| CrossMark / Productivity | |
| Усредн. модель с Intel Core Ultra 7 155H, Intel Arc 8-Core iGPU (1291 - 1798, n=33) | |
| HP Elite Dragonfly Folio 13.5 G3 | |
| MSI Summit E13 AI Evo A1MTG | |
| Lenovo ThinkPad L13 Yoga G4 i7-1355U | |
| Lenovo Yoga Book 9 13IMU9 | |
| CrossMark / Creativity | |
| Усредн. модель с Intel Core Ultra 7 155H, Intel Arc 8-Core iGPU (1519 - 1929, n=33) | |
| MSI Summit E13 AI Evo A1MTG | |
| HP Elite Dragonfly Folio 13.5 G3 | |
| Lenovo ThinkPad L13 Yoga G4 i7-1355U | |
| Lenovo Yoga Book 9 13IMU9 | |
| CrossMark / Responsiveness | |
| HP Elite Dragonfly Folio 13.5 G3 | |
| MSI Summit E13 AI Evo A1MTG | |
| Усредн. модель с Intel Core Ultra 7 155H, Intel Arc 8-Core iGPU (939 - 1802, n=33) | |
| Lenovo Yoga Book 9 13IMU9 | |
| Lenovo ThinkPad L13 Yoga G4 i7-1355U | |
| WebXPRT 3 / Overall | |
| Lenovo ThinkPad L13 Yoga G4 i7-1355U | |
| HP Elite Dragonfly Folio 13.5 G3 | |
| MSI Summit E13 AI Evo A1MTG | |
| Усредн. модель с Intel Core Ultra 7 155H, Intel Arc 8-Core iGPU (252 - 299, n=34) | |
| Lenovo Yoga Book 9 13IMU9 | |
| MSI Summit E13 Flip Evo A11MT | |
| Dell Latitude 9330 | |
| WebXPRT 4 / Overall | |
| Lenovo ThinkPad L13 Yoga G4 i7-1355U | |
| Усредн. модель с Intel Core Ultra 7 155H, Intel Arc 8-Core iGPU (166.4 - 309, n=29) | |
| Lenovo Yoga Book 9 13IMU9 | |
| HP Elite Dragonfly Folio 13.5 G3 | |
| Dell Latitude 9330 | |
| MSI Summit E13 AI Evo A1MTG | |
| Mozilla Kraken 1.1 / Total | |
| MSI Summit E13 Flip Evo A11MT | |
| Dell Latitude 9330 | |
| HP Elite Dragonfly Folio 13.5 G3 | |
| Lenovo Yoga Book 9 13IMU9 | |
| MSI Summit E13 AI Evo A1MTG | |
| Усредн. модель с Intel Core Ultra 7 155H, Intel Arc 8-Core iGPU (517 - 614, n=35) | |
| Lenovo ThinkPad L13 Yoga G4 i7-1355U | |
* ... меньше = лучше
| PCMark 10 Score | 4809 баллов | |
? | ||
| AIDA64 / Memory Copy | |
| Усредн. модель с Intel Core Ultra 7 155H (62397 - 96791, n=50) | |
| Lenovo Yoga Book 9 13IMU9 | |
| MSI Summit E13 AI Evo A1MTG | |
| Dell Latitude 9330 | |
| HP Elite Dragonfly Folio 13.5 G3 | |
| Lenovo ThinkPad L13 Yoga G4 i7-1355U | |
| MSI Summit E13 Flip Evo A11MT | |
| AIDA64 / Memory Read | |
| Усредн. модель с Intel Core Ultra 7 155H (60544 - 90647, n=50) | |
| MSI Summit E13 AI Evo A1MTG | |
| HP Elite Dragonfly Folio 13.5 G3 | |
| Lenovo Yoga Book 9 13IMU9 | |
| Dell Latitude 9330 | |
| MSI Summit E13 Flip Evo A11MT | |
| Lenovo ThinkPad L13 Yoga G4 i7-1355U | |
| AIDA64 / Memory Write | |
| HP Elite Dragonfly Folio 13.5 G3 | |
| MSI Summit E13 AI Evo A1MTG | |
| Усредн. модель с Intel Core Ultra 7 155H (58692 - 93451, n=50) | |
| Lenovo ThinkPad L13 Yoga G4 i7-1355U | |
| Dell Latitude 9330 | |
| Lenovo Yoga Book 9 13IMU9 | |
| MSI Summit E13 Flip Evo A11MT | |
| AIDA64 / Memory Latency | |
| Lenovo Yoga Book 9 13IMU9 | |
| Усредн. модель с Intel Core Ultra 7 155H (116.2 - 233, n=50) | |
| MSI Summit E13 AI Evo A1MTG | |
| HP Elite Dragonfly Folio 13.5 G3 | |
| Dell Latitude 9330 | |
| Lenovo ThinkPad L13 Yoga G4 i7-1355U | |
| MSI Summit E13 Flip Evo A11MT | |
* ... меньше = лучше
Задержка DPC
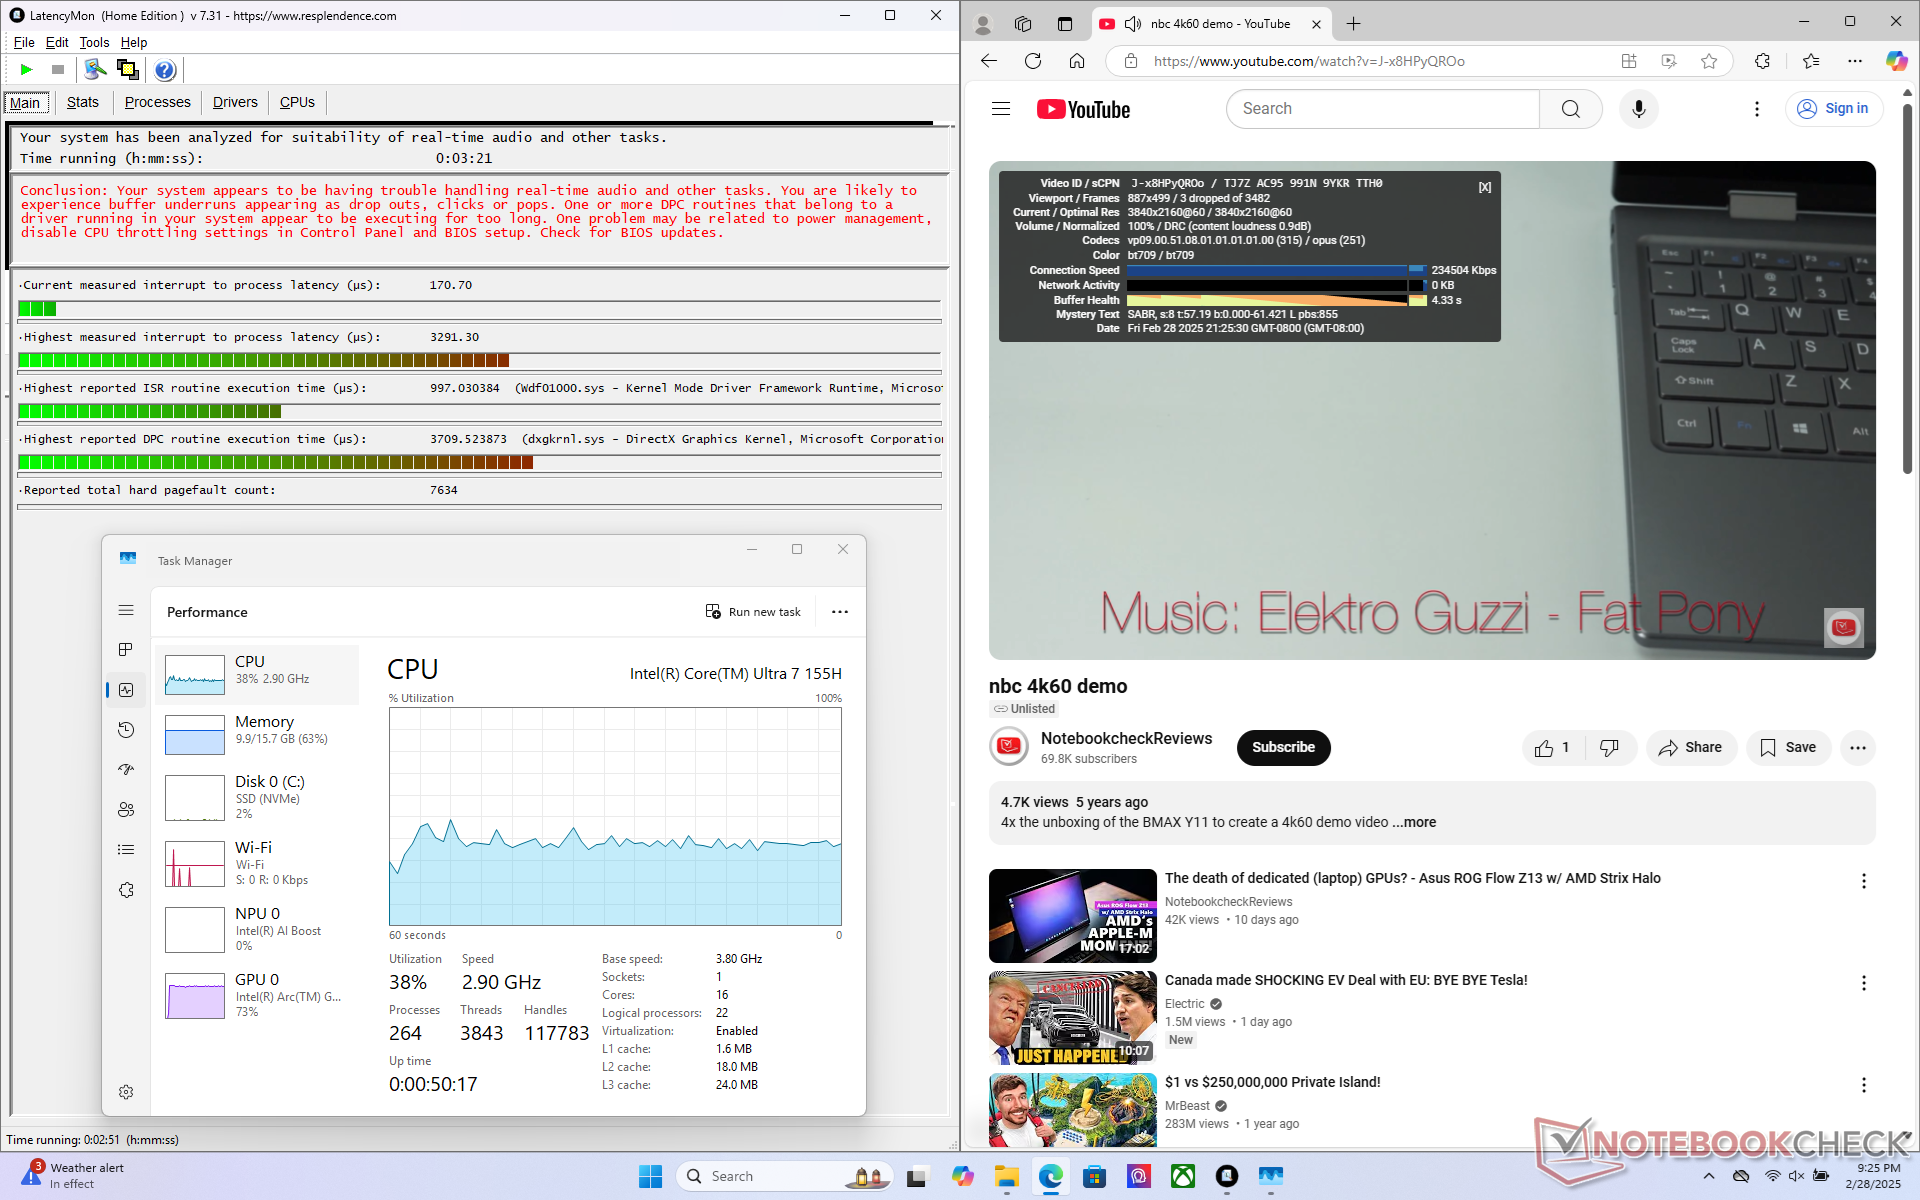
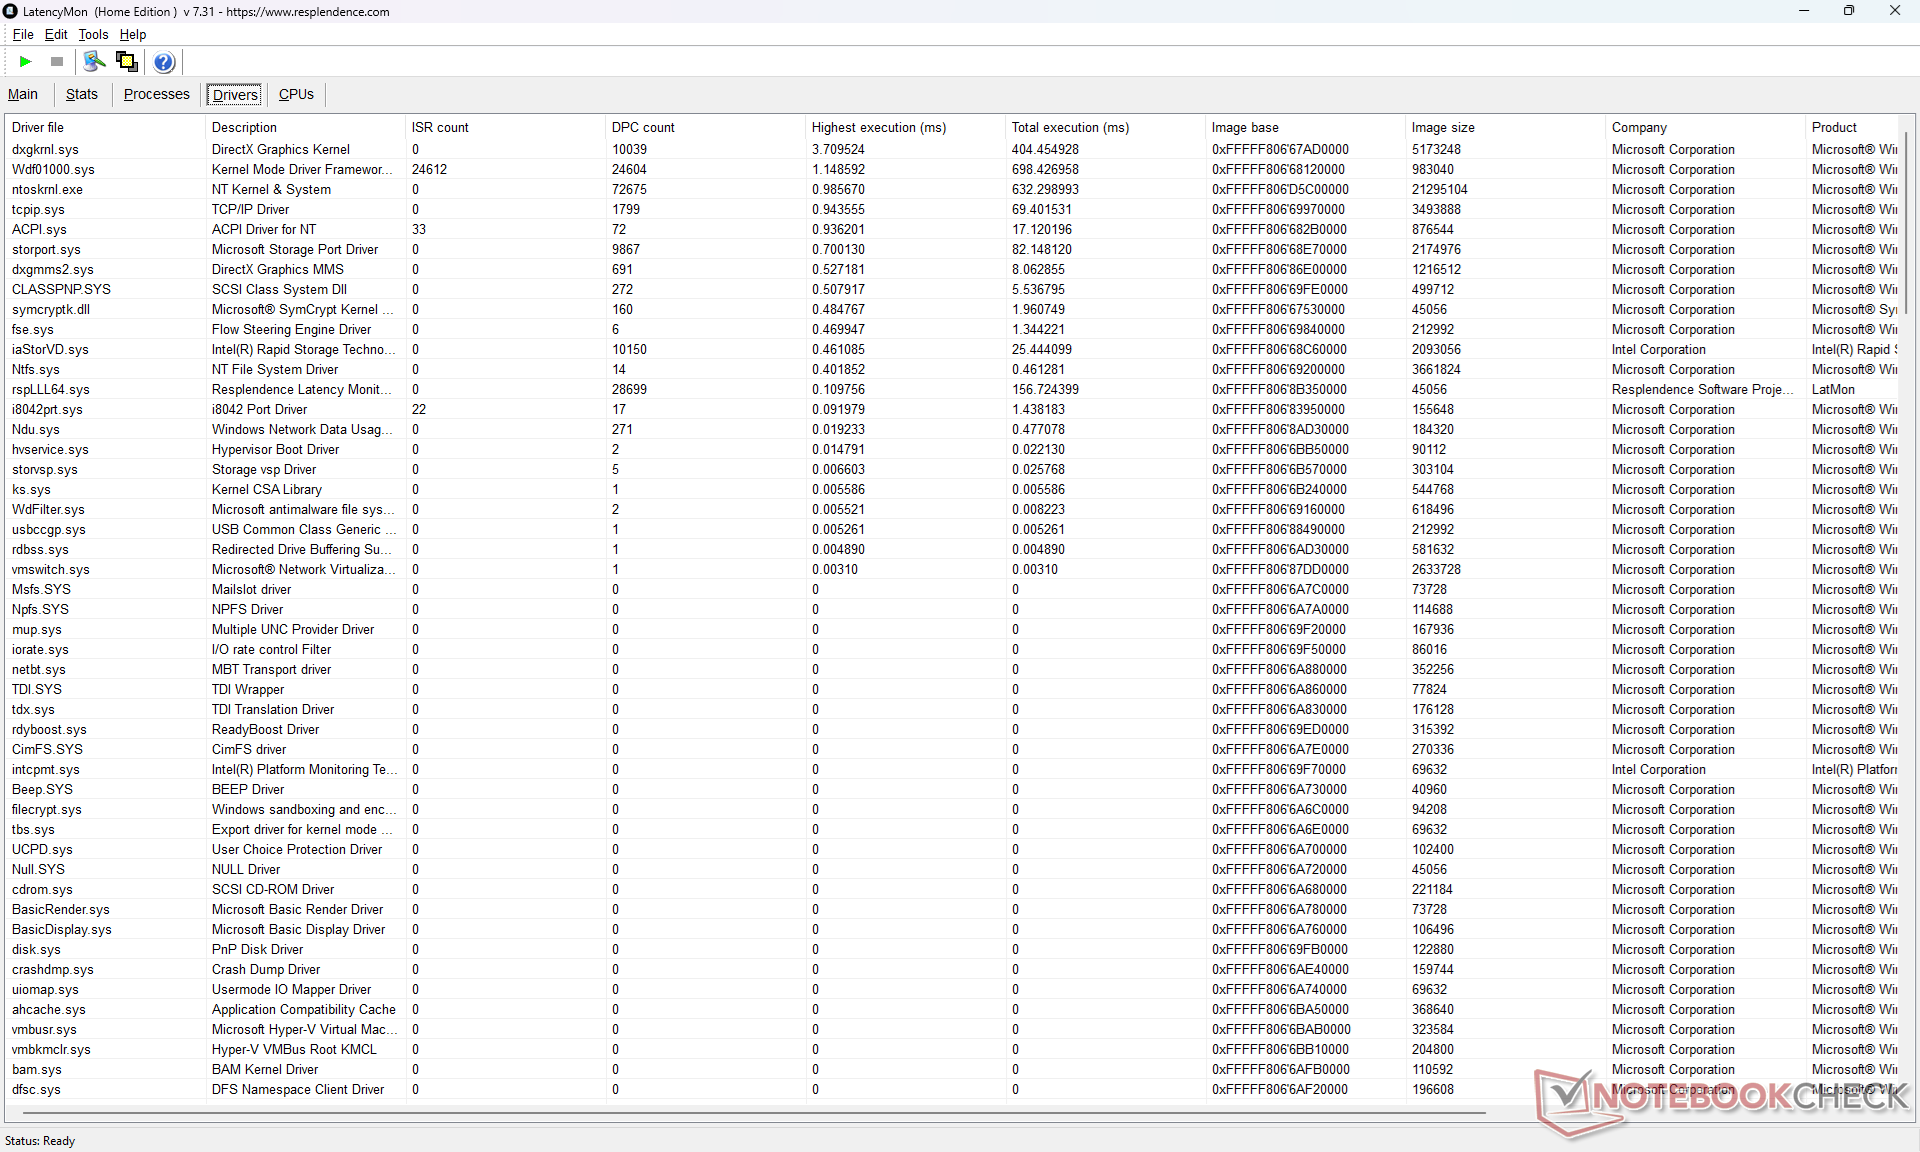
LatencyMon выявляет проблемы с DPC при открытии нескольких вкладок браузера на нашей домашней странице. воспроизведение видео 4K60 несовершенно, но все же плавно: всего 3 выпавших кадра в начале теста.
| DPC Latencies / LatencyMon - interrupt to process latency (max), Web, Youtube, Prime95 | |
| Dell Latitude 9330 | |
| HP Elite Dragonfly Folio 13.5 G3 | |
| MSI Summit E13 AI Evo A1MTG | |
| MSI Summit E13 Flip Evo A11MT | |
| Lenovo ThinkPad L13 Yoga G4 i7-1355U | |
| Lenovo Yoga Book 9 13IMU9 | |
* ... меньше = лучше
Накопитель
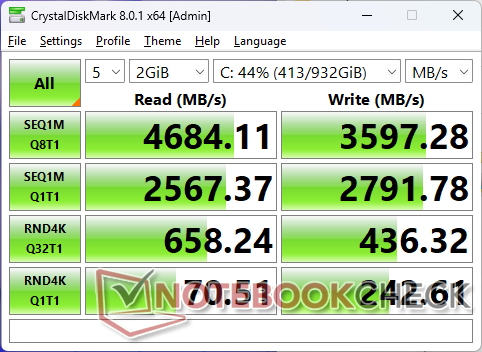
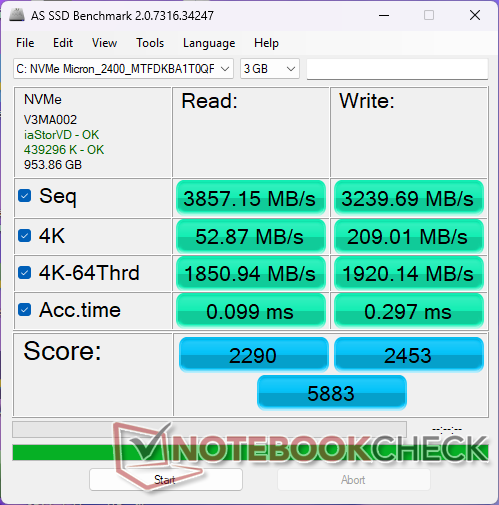
Micron 2400 PCIe4 x4 NVMe SSD дросселируется под нагрузкой. Например, при запуске DiskSpd в цикле скорость передачи данных достигала ~4300 МБ/с, а затем падала до ~2600 МБ/с примерно через 5 минут после начала теста.

* ... меньше = лучше
Чтение в DiskSpd, Глубина запроса 8
Видеокарта
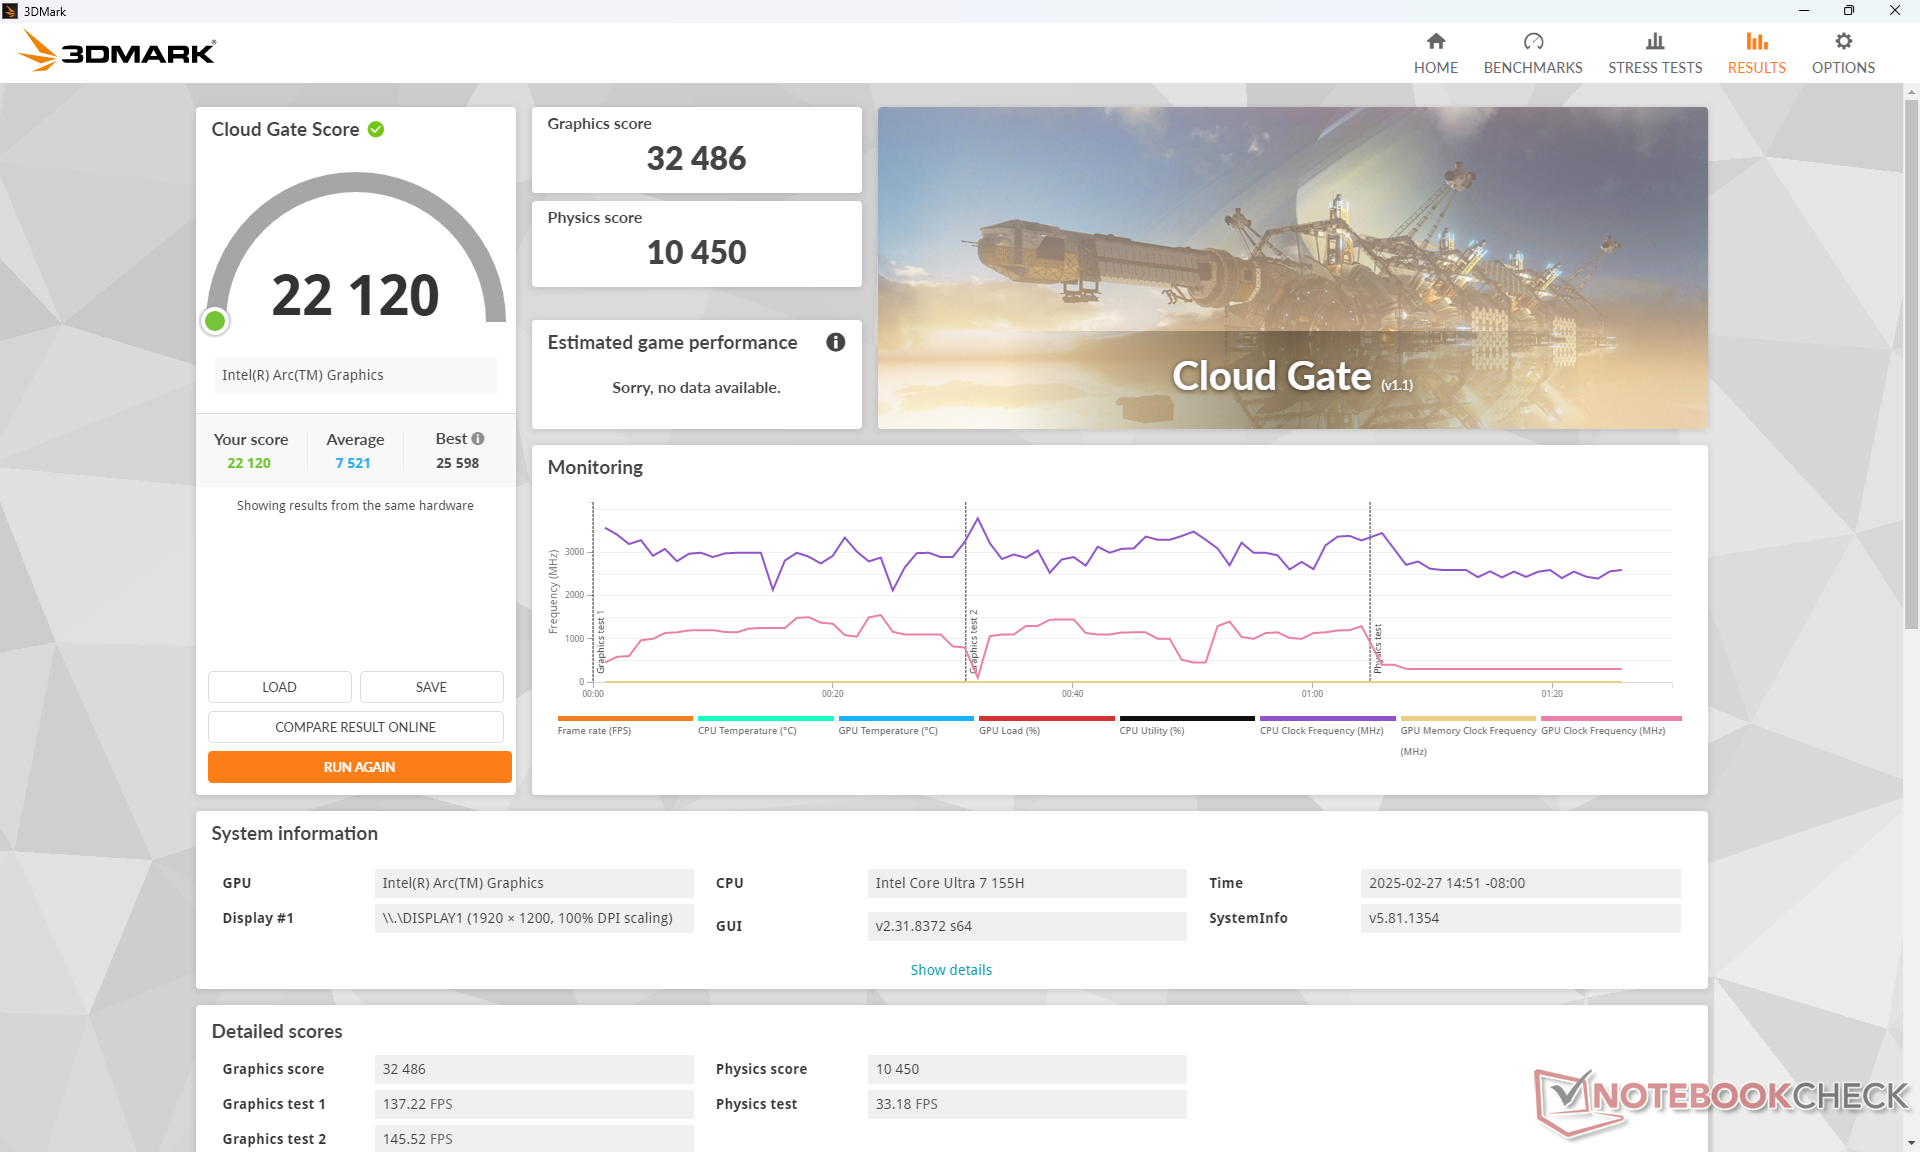
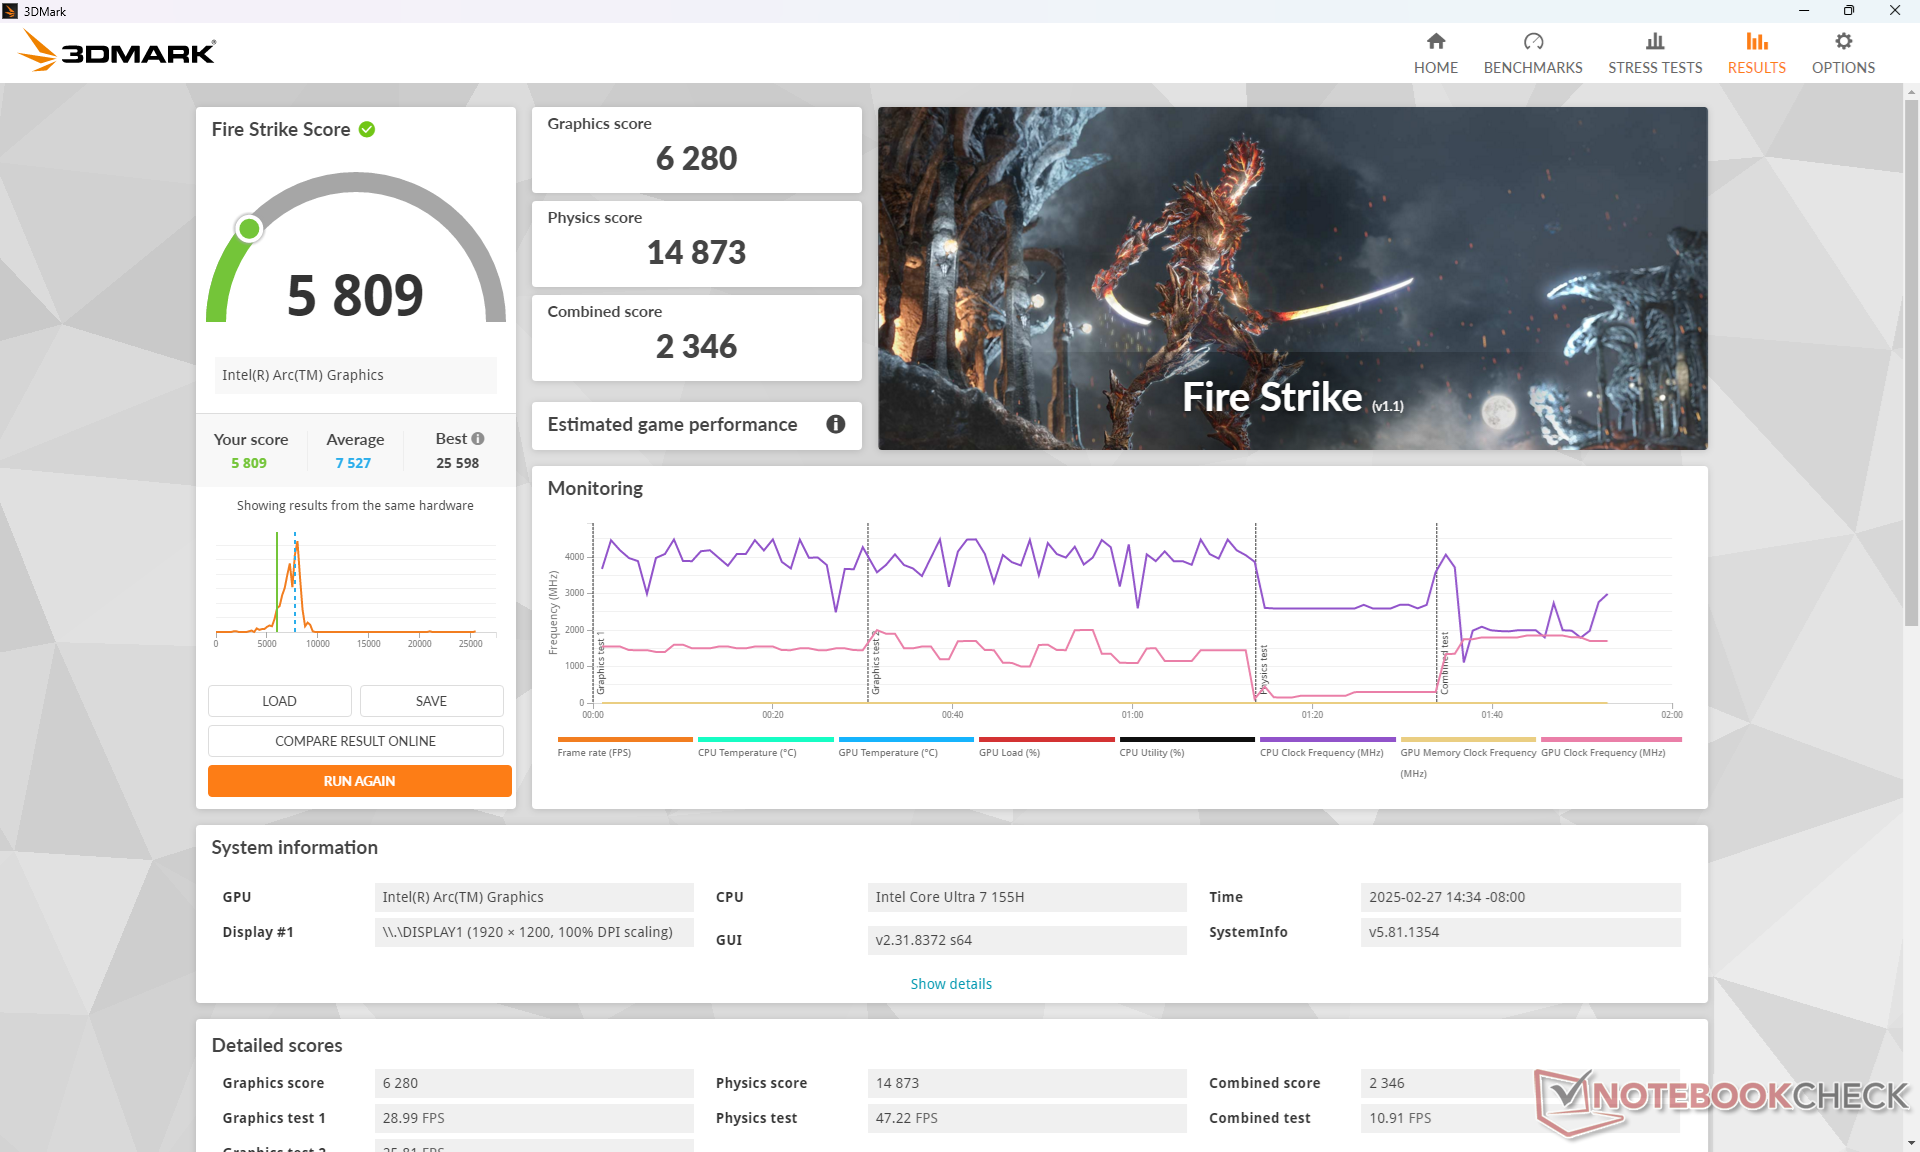
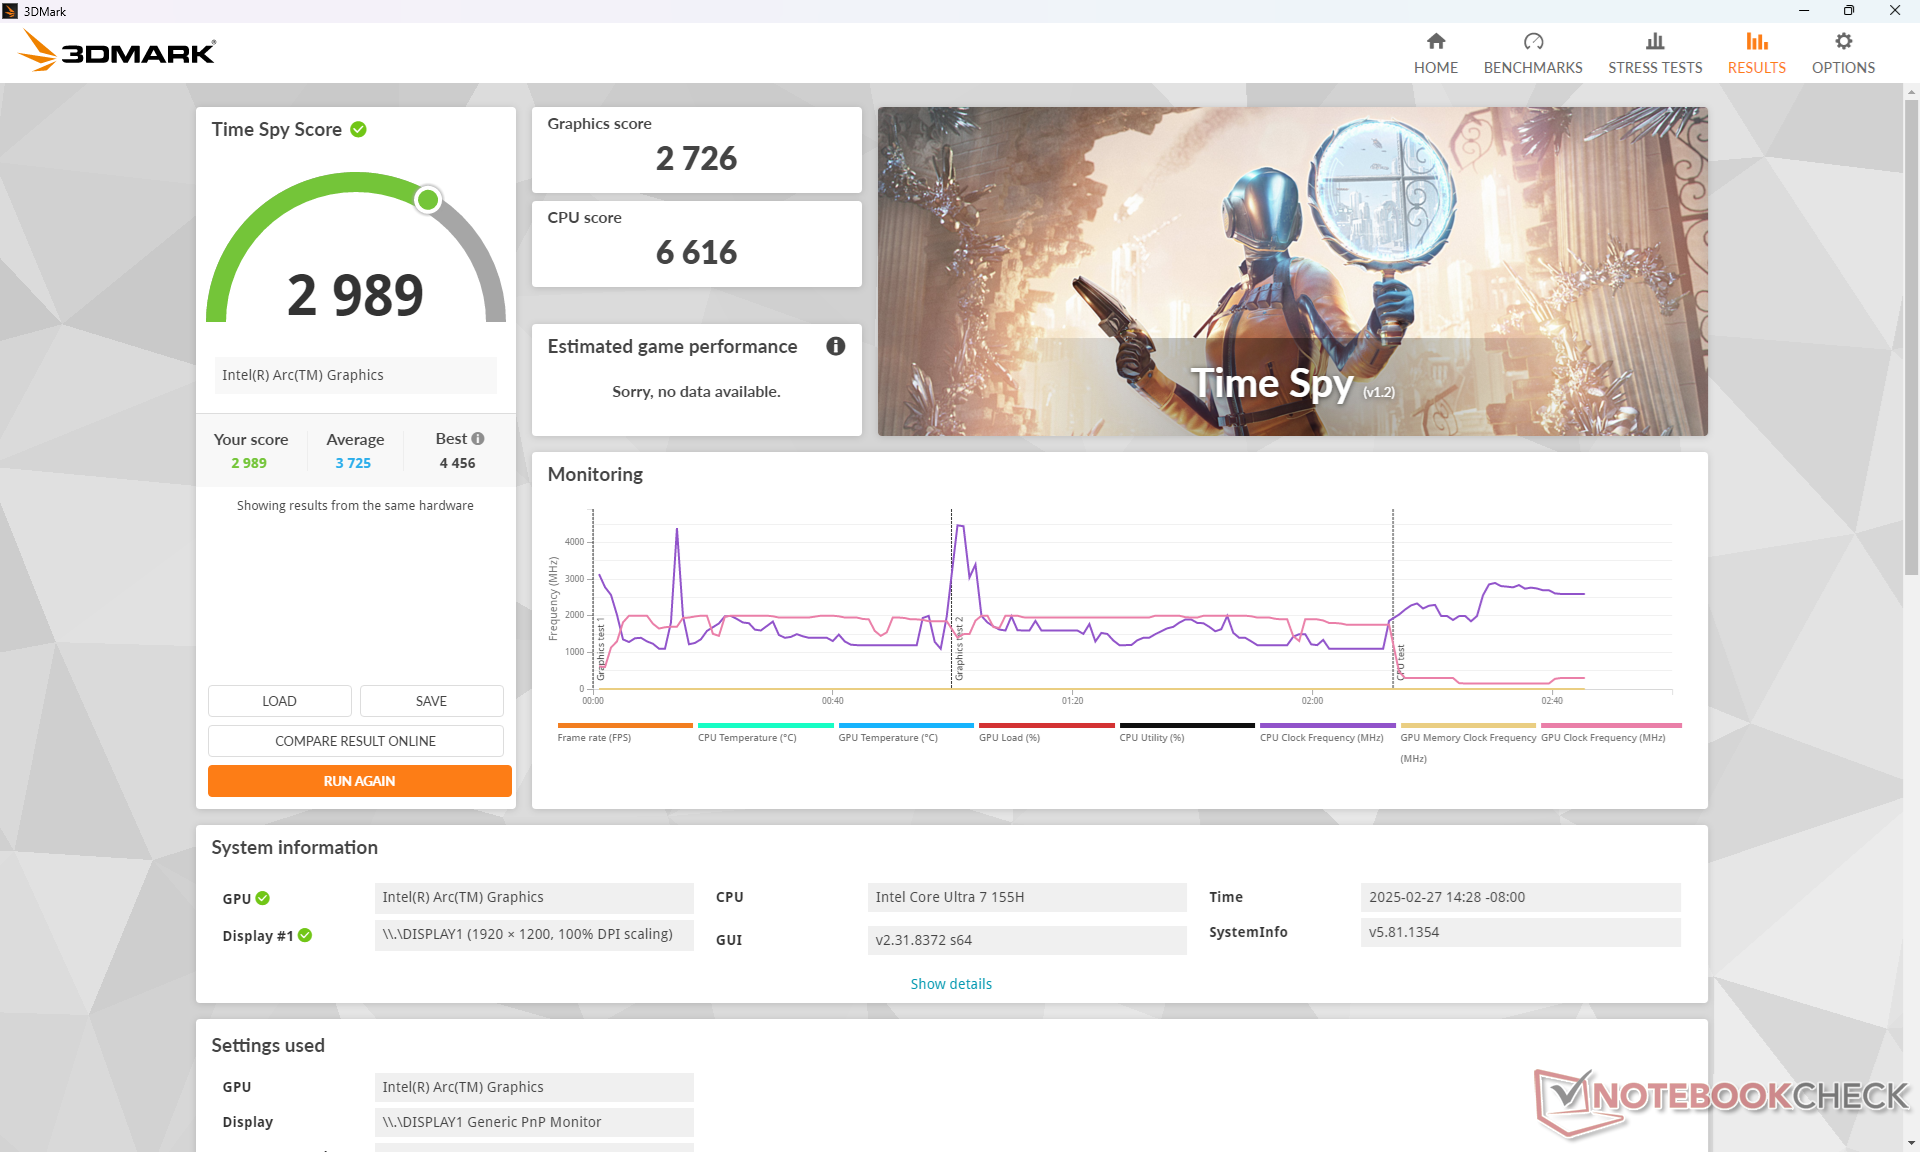
Более медленная, чем ожидалось, производительность процессора, о которой говорилось выше, привела к более медленной, чем ожидалось, производительности графики. На сайте Arc 8 в нашем MSI работает примерно на 15-25% медленнее, чем средний ноутбук в нашей базе данных с такой же интегрированной графикой, согласно бенчмаркам 3DMark.
F1 22 и Cyberpunk 2077 выходили из строя при настройках High или Ultra.
| Профиль мощности | Оценка графики | Оценка физики | Комбинированный балл |
| Режим производительности | 6280 | 14873 | 2346 |
| Сбалансированный режим | 5786 (-8%) | 9842 (-34%) | 1685 (-28%) |
| Питание от аккумулятора | 5196 (-17%) | 15031 (-0%) | 2267 (-3%) |
Работа в сбалансированном режиме может довольно сильно повлиять на производительность процессора, судя по нашей таблице результатов Fire Strike, приведенной выше.
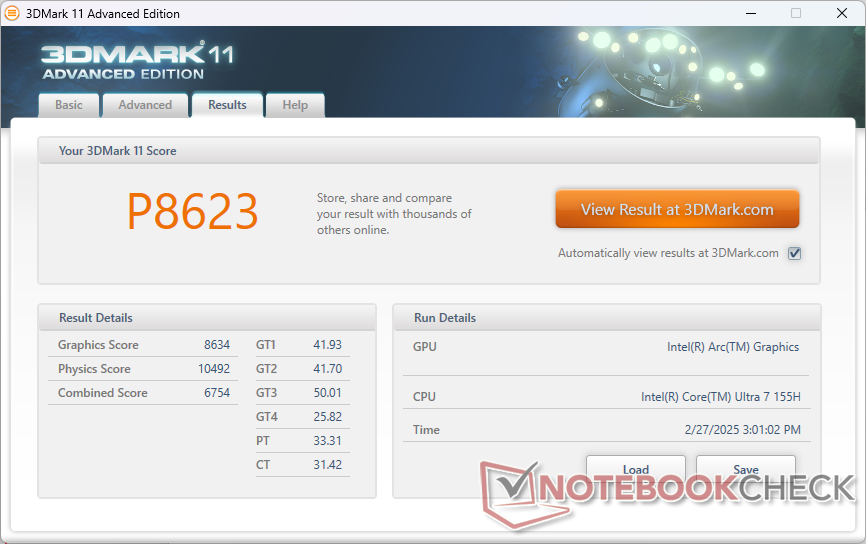
| 3DMark 11 Performance | 8623 баллов | |
| 3DMark Cloud Gate Standard Score | 22120 баллов | |
| 3DMark Fire Strike Score | 5809 баллов | |
| 3DMark Time Spy Score | 2989 баллов | |
? | ||
* ... меньше = лучше
Игровая производительность
Игровая производительность оставляет желать лучшего. Помимо упомянутых выше недостатков CPU и GPU, заметные проблемы с призраками и заиканием могут отвлекать даже при запуске таких нетребовательных игр, как DOTA 2 Reborn.
| Cyberpunk 2077 2.2 Phantom Liberty | |
| 1280x720 Low Preset (FSR off) | |
| MSI Prestige 13 AI Plus Evo A2VMG | |
| Усредн. модель с Intel Arc 8-Core iGPU (34.5 - 58, n=18) | |
| MSI Summit E13 AI Evo A1MTG | |
| Lenovo Yoga Book 9 13IMU9 | |
| 1920x1080 Low Preset (FSR off) | |
| Asus ROG Flow Z13 GZ302EA-RU073W | |
| MSI Prestige 13 AI Plus Evo A2VMG | |
| Усредн. модель с Intel Arc 8-Core iGPU (11.3 - 38, n=36) | |
| MSI Summit E13 AI Evo A1MTG | |
| Lenovo Yoga Book 9 13IMU9 | |
| 1920x1080 Medium Preset (FSR off) | |
| Asus ROG Flow Z13 GZ302EA-RU073W | |
| MSI Prestige 13 AI Plus Evo A2VMG | |
| Усредн. модель с Intel Arc 8-Core iGPU (9.42 - 31.4, n=34) | |
| MSI Summit E13 AI Evo A1MTG | |
| Lenovo Yoga Book 9 13IMU9 | |
| 1920x1080 High Preset (FSR off) | |
| Asus ROG Flow Z13 GZ302EA-RU073W | |
| MSI Prestige 13 AI Plus Evo A2VMG | |
| Усредн. модель с Intel Arc 8-Core iGPU (7.3 - 27.6, n=34) | |
| Lenovo Yoga Book 9 13IMU9 | |
| 1920x1080 Ultra Preset (FSR off) | |
| Asus ROG Flow Z13 GZ302EA-RU073W | |
| MSI Prestige 13 AI Plus Evo A2VMG | |
| Усредн. модель с Intel Arc 8-Core iGPU (13 - 24.7, n=26) | |
| Lenovo Yoga Book 9 13IMU9 | |
Частота кадров, Cyberpunk 2077
| мин. | сред. | выс. | макс. | |
|---|---|---|---|---|
| GTA V (2015) | 50.6 | 51.1 | 23.9 | 12 |
| Dota 2 Reborn (2015) | 93.2 | 83.5 | 65.2 | 63 |
| Final Fantasy XV Benchmark (2018) | 49.2 | 29.4 | 20.7 | |
| X-Plane 11.11 (2018) | 46.2 | 37.5 | 31.4 | |
| Strange Brigade (2018) | 131.2 | 61.3 | 45.7 | 33.9 |
| Tiny Tina's Wonderlands (2022) | 41.5 | 31.7 | 22 | 17.7 |
| F1 22 (2022) | 57.8 | 53.5 | ||
| Baldur's Gate 3 (2023) | 22.8 | 19.5 | 16.8 | 16.3 |
| Cyberpunk 2077 2.2 Phantom Liberty (2023) | 28.3 | 23.4 |
Температурные и акустические показатели
Система охлаждения
Шум вентилятора тихий, если речь идет только о просмотре веб-страниц или потоковой передаче данных, но он довольно быстро нарастает при увеличении нагрузки. Кроме того, шум относительно высокочастотный, поэтому любые изменения числа оборотов становятся заметными. Вентиляторы шумят громче, чем на большинстве других 13-дюймовых бизнес-ноутбуков, при выполнении требовательных нагрузок, таких как игры, из-за более требовательного процессора Core Ultra-H.
Уровень шума
| Ожидание |
| 24.1 / 24.8 / 26.5 дБ |
| Нагрузка |
| 39.3 / 49.1 дБ |
 | ||
30 dB бесшумно 40 dB(A) различимо 50 dB(A) громко |
||
min: | ||
| MSI Summit E13 AI Evo A1MTG Arc 8-Core, Ultra 7 155H, Micron 2400 MTFDKBA1T0QFM | MSI Summit E13 Flip Evo A11MT Iris Xe G7 96EUs, i7-1185G7, Phison 1TB SM2801T24GKBB4S-E162 | Lenovo Yoga Book 9 13IMU9 Graphics 4-Core, Ultra 7 155U | Lenovo ThinkPad L13 Yoga G4 i7-1355U Iris Xe G7 96EUs, i7-1355U, Samsung PM9B1 512GB MZAL4512HBLU | HP Elite Dragonfly Folio 13.5 G3 Iris Xe G7 96EUs, i7-1265U, Samsung PM9A1 MZVL2512HCJQ | Dell Latitude 9330 Iris Xe G7 96EUs, i7-1260U | |
|---|---|---|---|---|---|---|
| Уровень шума | 0% | 16% | 11% | 11% | 9% | |
| в выкл. виде (фон) * | 24 | 24.5 -2% | 23.3 3% | 23.1 4% | 24.6 -3% | 23 4% |
| Мин. в простое * | 24.1 | 24.7 -2% | 23.3 3% | 23.4 3% | 24.6 -2% | 23 5% |
| В простое, сред. * | 24.8 | 24.7 -0% | 23.3 6% | 23.4 6% | 24.6 1% | 23.1 7% |
| В простое, макс. * | 26.5 | 26.4 -0% | 24.6 7% | 23.4 12% | 24.6 7% | 23.1 13% |
| Нагрузка, сред. * | 39.3 | 37.8 4% | 26.2 33% | 33.9 14% | 27.8 29% | 37.1 6% |
| Cyberpunk 2077 ultra * | 45 | |||||
| Нагрузка, макс. * | 49.1 | 48.8 1% | 27.3 44% | 36.9 25% | 33.4 32% | 40.5 18% |
| Witcher 3 ultra * | 41.4 | 27.3 | 36.9 | 33.4 | 40.6 |
* ... меньше = лучше
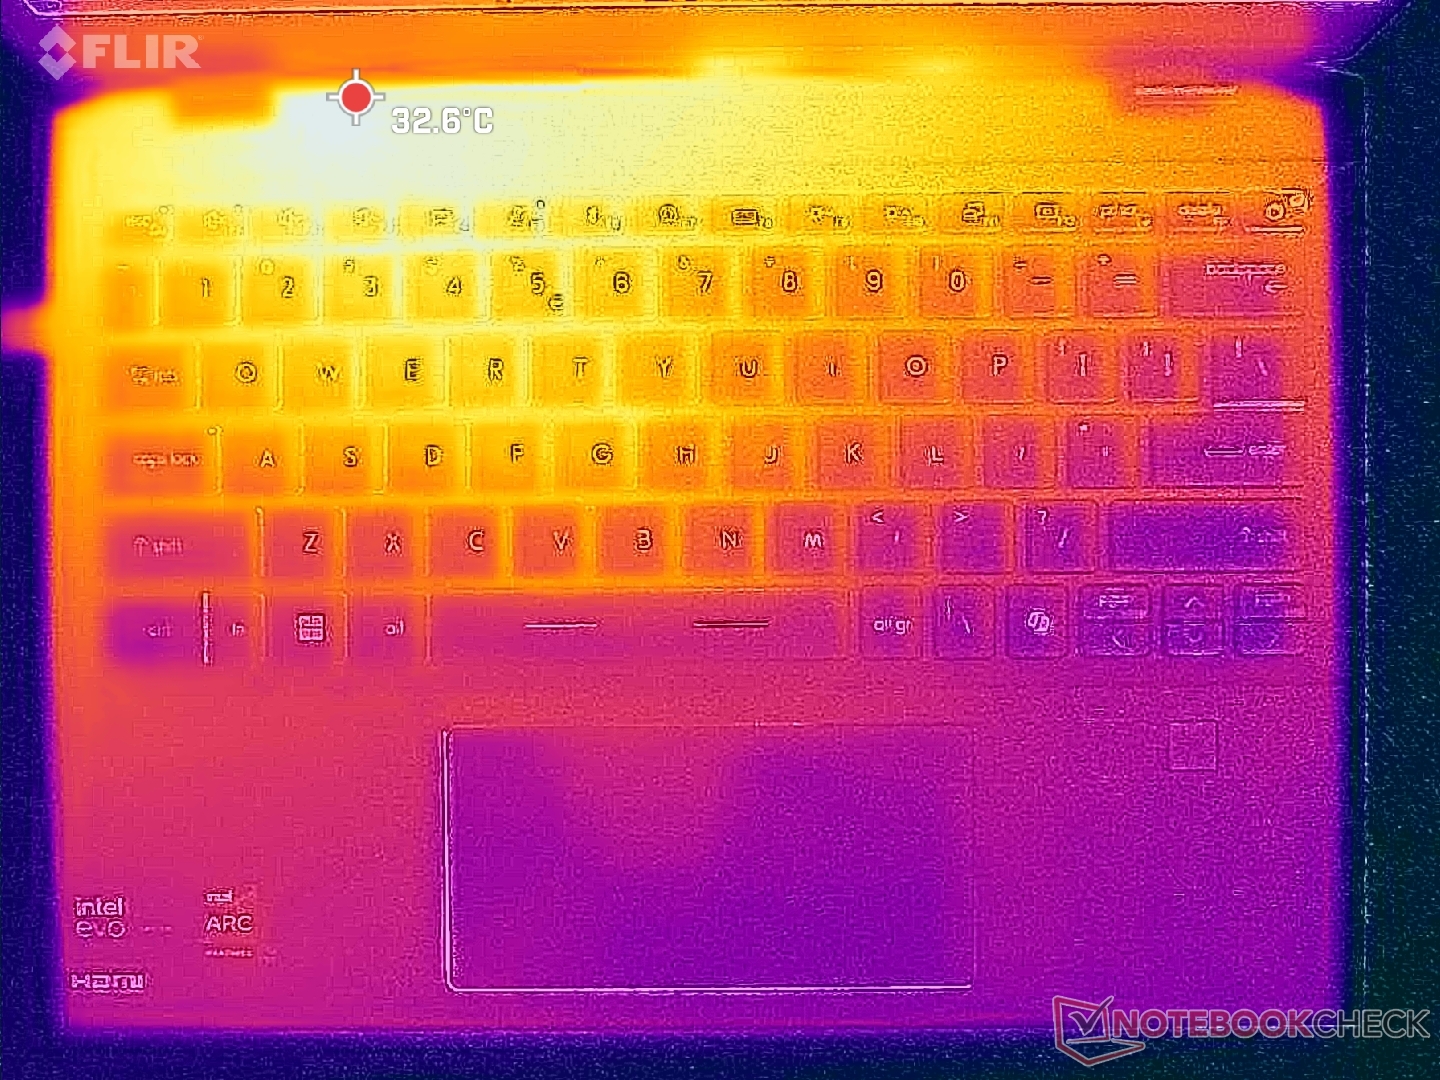
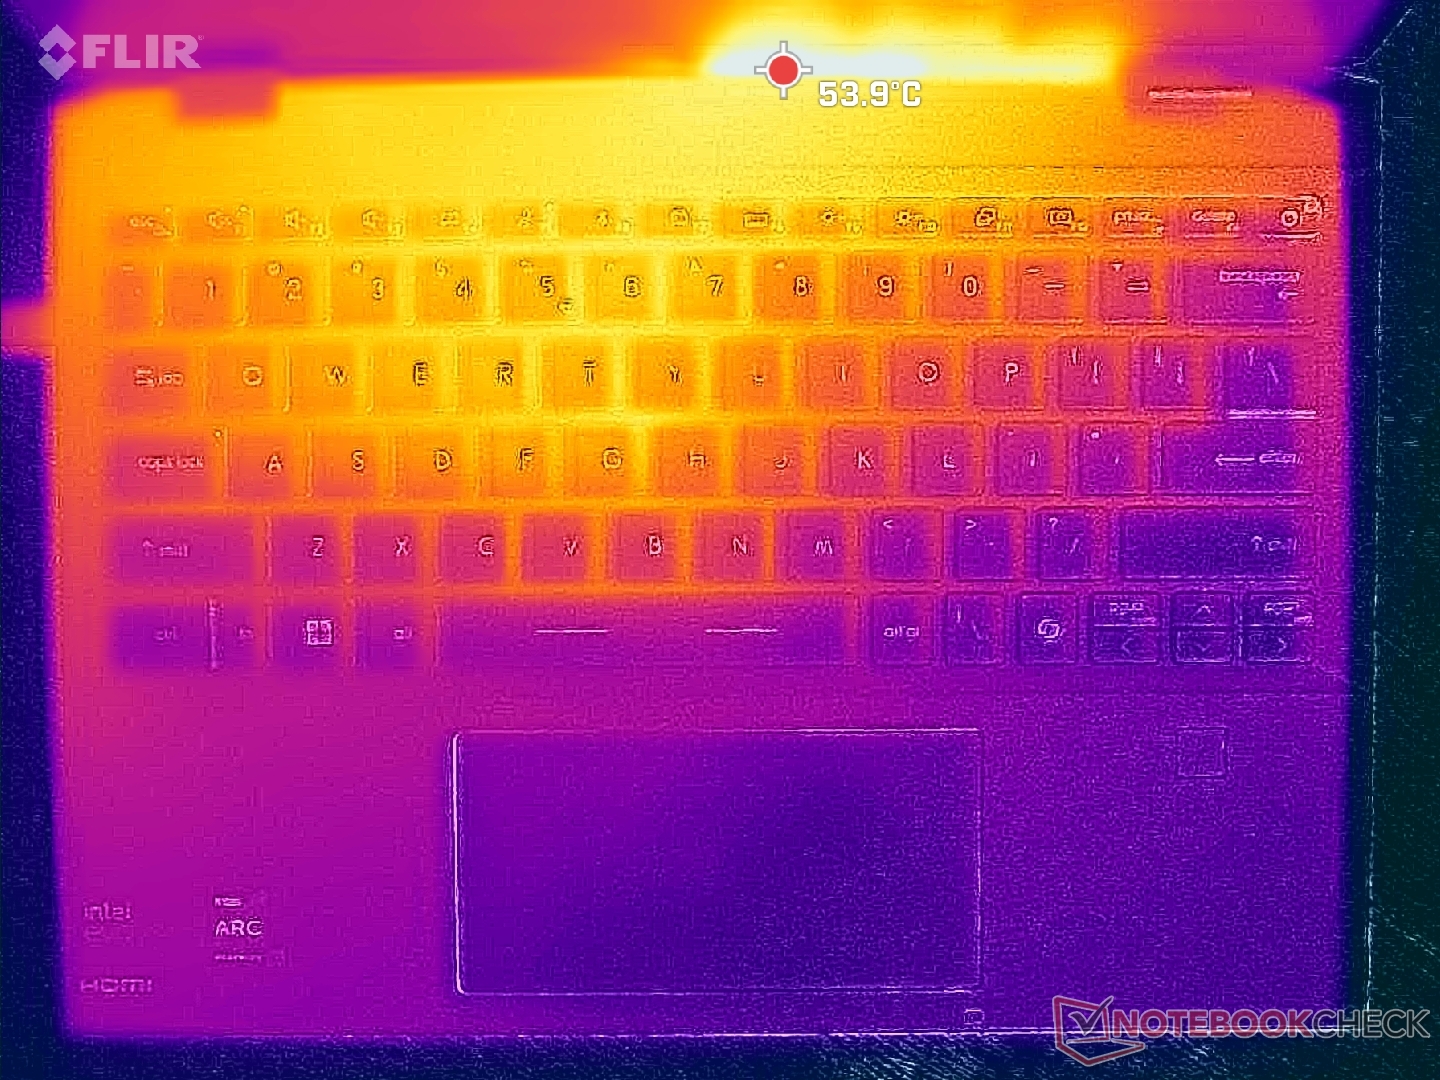
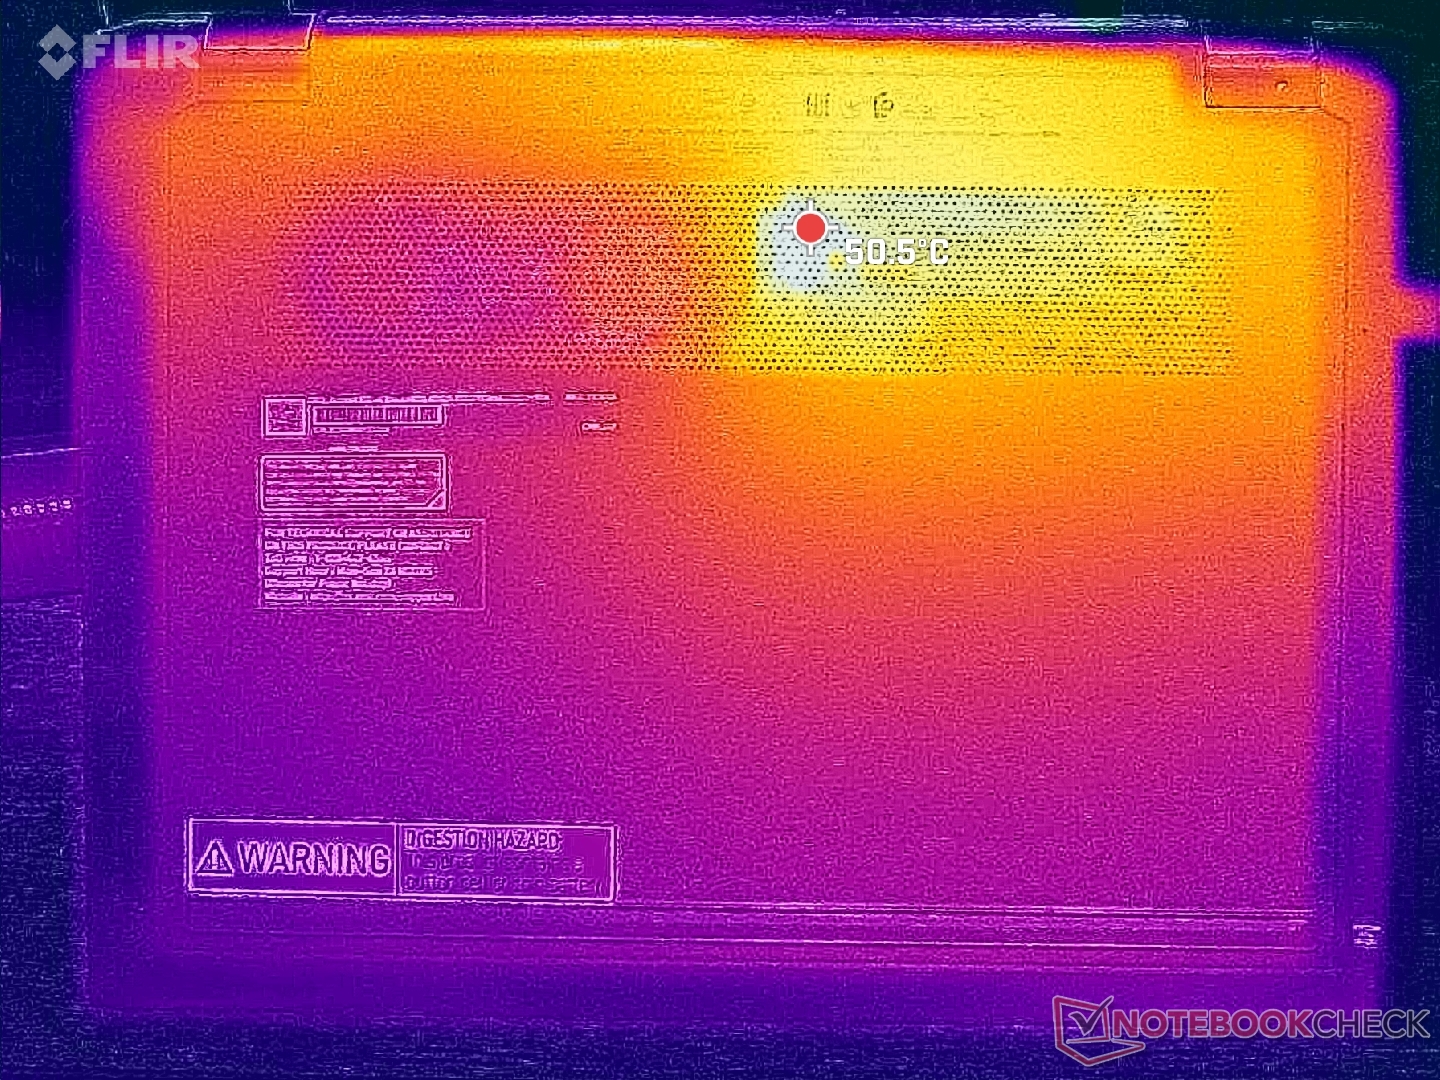
Температура
Поверхность очень сильно нагревается даже при простое на рабочем столе. Температура в горячих точках варьируется от 36 C на холостом ходу до более 45 C при работе с высокими нагрузками, что теплее, чем у большинства других 13-дюймовых кабриолетов.
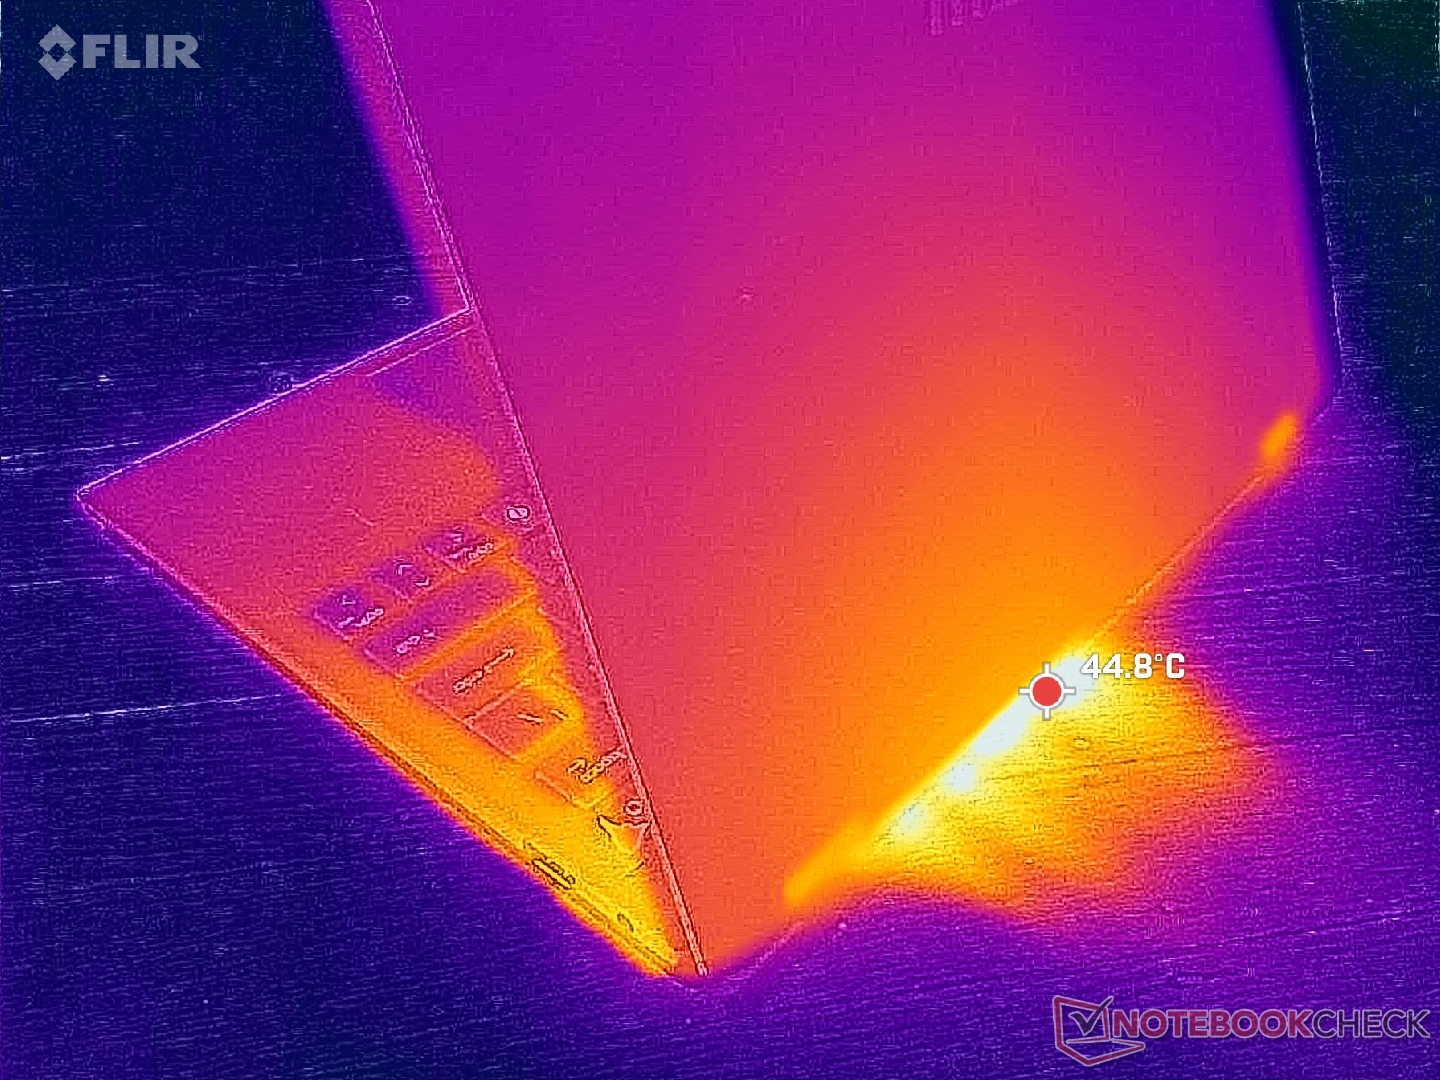
(-) Макс. температура верха корпуса составила 45.2 град. Цельсия. Типичное значение для устройств этого же класса (Convertible) = 35.3 градуса (-ов) при минимуме в 19.6 град. и максимуме в 60 град.
(±) Макс. температура дна составила 44.8 град. Цельсия. Типичное значение для устройств этого же класса = 36.8 градуса (-ов).
(+) При отсутствии вычислительной нагрузки верх корпуса нагревается в среднем до 30.1 град. Типичное значение для устройств этого же класса = 30.2 градуса (-ов).
(+) Палуба на ощупь: Прохладно (28.8 град. Цельсия).
(±) Средняя температура палубы у похожих моделей составила 28 град. Цельсия, это -0.8 градуса (-ов) разницы.

| MSI Summit E13 AI Evo A1MTG Intel Core Ultra 7 155H, Intel Arc 8-Core iGPU | MSI Summit E13 Flip Evo A11MT Intel Core i7-1185G7, Intel Iris Xe Graphics G7 96EUs | Lenovo Yoga Book 9 13IMU9 Intel Core Ultra 7 155U, Intel Graphics 4-Core iGPU (Arc) | Lenovo ThinkPad L13 Yoga G4 i7-1355U Intel Core i7-1355U, Intel Iris Xe Graphics G7 96EUs | HP Elite Dragonfly Folio 13.5 G3 Intel Core i7-1265U, Intel Iris Xe Graphics G7 96EUs | Dell Latitude 9330 Intel Core i7-1260U, Intel Iris Xe Graphics G7 96EUs | |
|---|---|---|---|---|---|---|
| Нагрев | -7% | 10% | 6% | 28% | 12% | |
| Нагрузка, макс. сверху * | 45.2 | 52 -15% | 39.2 13% | 38.4 15% | 32.8 27% | 40.6 10% |
| Нагрузка, макс. на дне * | 44.8 | 57.4 -28% | 41 8% | 46 -3% | 33.4 25% | 50.2 -12% |
| В простое сверху * | 34.8 | 30.4 13% | 32.2 7% | 31.2 10% | 24.6 29% | 25 28% |
| В простое на дне * | 35.8 | 34.2 4% | 31.6 12% | 34.8 3% | 24.6 31% | 27.6 23% |
* ... меньше = лучше
Встроенная акустика
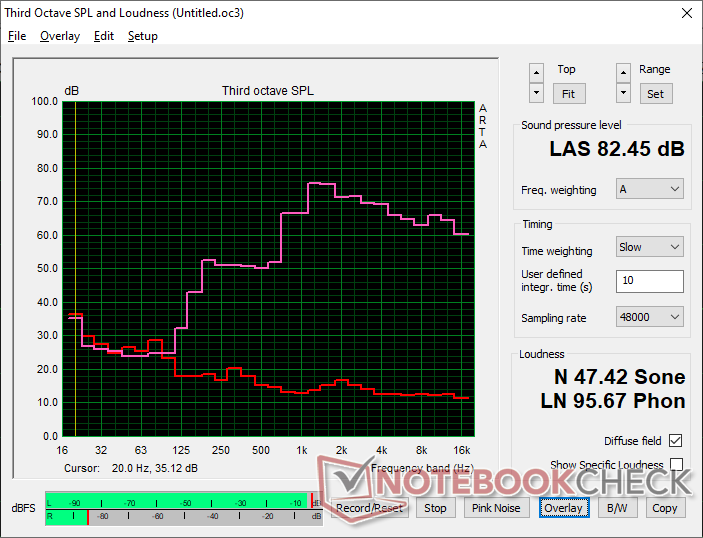
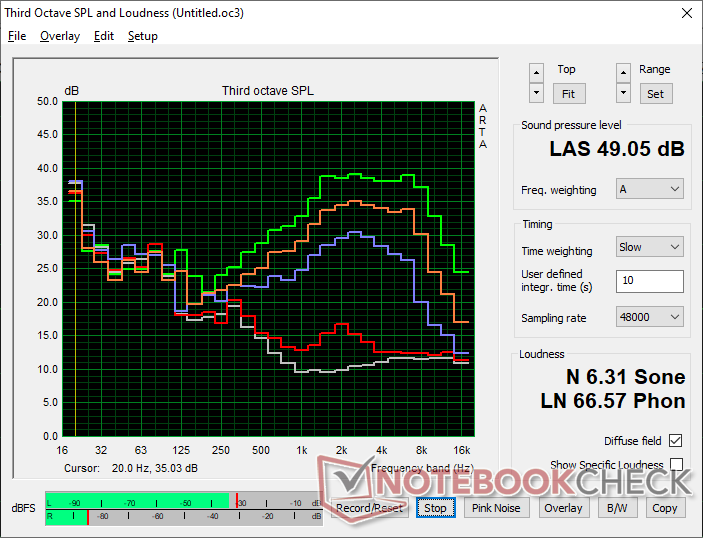
Анализ АЧХ аудиосистемы MSI Summit E13 AI Evo A1MTG
(+) | отличный уровень макс. громкости (82.5 дБА)
Низкие частоты (100 Гц - 315 Гц)
(-) | баса почти нет (на 21.9% меньше медианы)
(±) | он умеренно сбалансирован
Средние частоты (400 Гц - 2000 Гц)
(±) | диапазон воспроизводится тише желаемого (отклонение 9.2% от медианы)
(±) | он умеренно ровный, без больших "горбов" или провалов
Высокие частоты (2 кГц - 16 кГц)
(+) | диапазон отлично сбалансирован (отклонение лишь 3.2% от медианы)
(+) | он ровный, без "горбов" или провалов
Весь диапазон (100 - 16000 Гц)
(±) | звук в целом не очень сбалансирован (21.4% отличия от медианы)
в сравнении с устройствами того же класса
» 55% прямо сравнимых устройств показал(и) себя лучше, 12% примерно так же, 33% значительно хуже
» Δ наилучшего устройства из прямо сравнимых: 6%, средняя Δ: 20%, худший результат: 57%
в сравнении со всеми тестированными устройствами
» 57% известных нам устройств показал(и) себя лучше, 7% примерно так же, 35% значительно хуже
» Δ наилучшего устройства среди известных нам: 4%, средняя Δ: 24%, худший результат: 134%
Анализ АЧХ аудиосистемы Apple MacBook Pro 16 2021 M1 Pro
(+) | отличный уровень макс. громкости (84.7 дБА)
Низкие частоты (100 Гц - 315 Гц)
(+) | бас отлично сбалансирован (отклонение лишь 3.8% от медианы)
(+) | он ровный, без "горбов" или провалов
Средние частоты (400 Гц - 2000 Гц)
(+) | диапазон не провален и не выпячен (отклонение лишь 1.3% от медианы)
(+) | он ровный, без "горбов" или провалов
Высокие частоты (2 кГц - 16 кГц)
(+) | диапазон отлично сбалансирован (отклонение лишь 1.9% от медианы)
(+) | он ровный, без "горбов" или провалов
Весь диапазон (100 - 16000 Гц)
(+) | звук в целом сбалансирован (4.6% отличия от медианы)
в сравнении с устройствами того же класса
» 0% прямо сравнимых устройств показал(и) себя лучше, 0% примерно так же, 100% значительно хуже
» Δ наилучшего устройства из прямо сравнимых: 5%, средняя Δ: 18%, худший результат: 45%
в сравнении со всеми тестированными устройствами
» 0% известных нам устройств показал(и) себя лучше, 0% примерно так же, 100% значительно хуже
» Δ наилучшего устройства среди известных нам: 4%, средняя Δ: 24%, худший результат: 134%
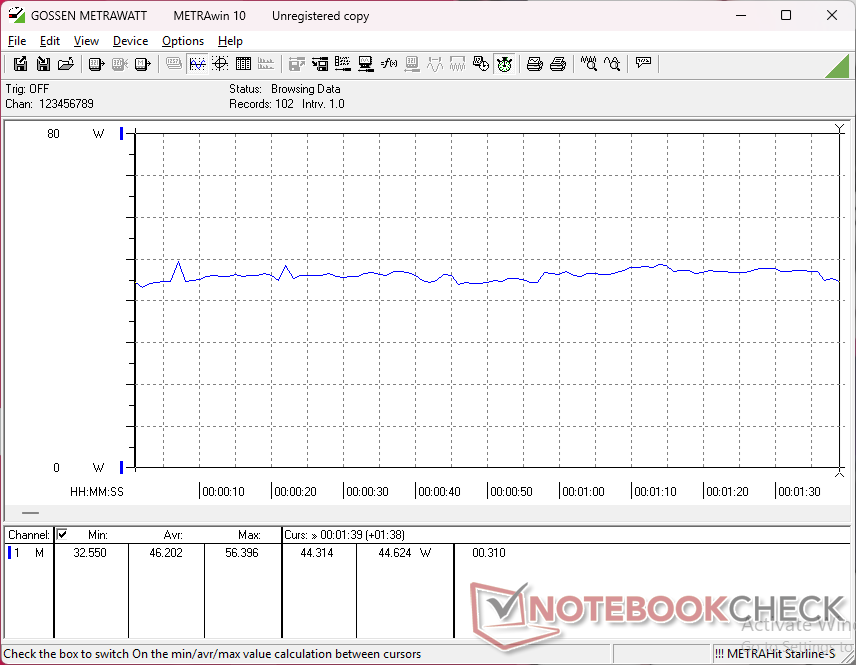
Энергопотребление
Потребляемая мощность
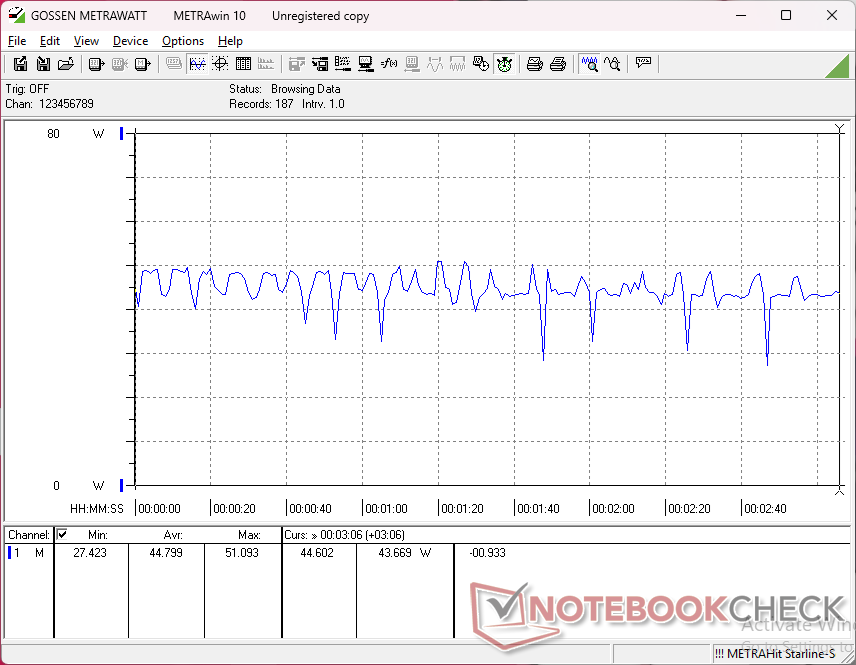
Энергопотребление может быть нестабильным при работе с такими требовательными к GPU нагрузками, как Cyberpunk 2077 , что согласуется с отмеченными выше замираниями частоты кадров. Это контрастирует с Framework 13.5 который поставляется с точно таким же процессором Core Ultra 7 155H, но с гораздо более стабильным потреблением под нагрузкой.
| Выкл. | |
| Ожидание | |
| Нагрузка |
|
Легенда:
min: | |
| MSI Summit E13 AI Evo A1MTG Ultra 7 155H, Arc 8-Core, Micron 2400 MTFDKBA1T0QFM, IPS, 1920x1200, 13.3" | MSI Summit E13 Flip Evo A11MT i7-1185G7, Iris Xe G7 96EUs, Phison 1TB SM2801T24GKBB4S-E162, IPS, 1920x1200, 13.4" | Lenovo Yoga Book 9 13IMU9 Ultra 7 155U, Graphics 4-Core, , OLED, 2880x1800, 13.3" | Lenovo ThinkPad L13 Yoga G4 i7-1355U i7-1355U, Iris Xe G7 96EUs, Samsung PM9B1 512GB MZAL4512HBLU, IPS, 1920x1200, 13.3" | HP Elite Dragonfly Folio 13.5 G3 i7-1265U, Iris Xe G7 96EUs, Samsung PM9A1 MZVL2512HCJQ, IPS, 1920x1280, 13.5" | Dell Latitude 9330 i7-1260U, Iris Xe G7 96EUs, , IPS, 2560x1600, 13.3" | |
|---|---|---|---|---|---|---|
| Энергопотребление | -52% | -116% | -59% | -26% | -40% | |
| В простое, мин. * | 2.3 | 4.8 -109% | 7.1 -209% | 5.5 -139% | 3.4 -48% | 4.7 -104% |
| В простое, сред. * | 4.8 | 8.4 -75% | 9.1 -90% | 8.3 -73% | 4.9 -2% | 8.2 -71% |
| В простое, макс. * | 5 | 8.6 -72% | 18.4 -268% | 9.1 -82% | 9.3 -86% | 8.4 -68% |
| Нагрузка, сред. * | 46.2 | 47.1 -2% | 51.3 -11% | 49.9 -8% | 41.9 9% | 36.8 20% |
| Cyberpunk 2077 ultra external monitor * | 41.9 | |||||
| Cyberpunk 2077 ultra * | 44.8 | |||||
| Нагрузка, макс. * | 65 | 65.9 -1% | 65.5 -1% | 60 8% | 67.5 -4% | 49.9 23% |
| Witcher 3 ultra * | 51.6 | 41.5 | 42.4 | 36.4 | 30.4 |
* ... меньше = лучше
Энергопотребление: Cyberpunk 2077, Стресс-тест
Энергопотребление с внешним монитором
Автономность
Время работы WLAN меньше, чем у старшей модели Summit E13, на пару часов, но в целом оно все равно хорошее - почти 9,5 часов работы в реальных условиях.
| MSI Summit E13 AI Evo A1MTG Ultra 7 155H, Arc 8-Core, 70 Вт⋅ч | MSI Summit E13 Flip Evo A11MT i7-1185G7, Iris Xe G7 96EUs, 70 Вт⋅ч | Lenovo Yoga Book 9 13IMU9 Ultra 7 155U, Graphics 4-Core, 80 Вт⋅ч | Lenovo ThinkPad L13 Yoga G4 i7-1355U i7-1355U, Iris Xe G7 96EUs, 46 Вт⋅ч | HP Elite Dragonfly Folio 13.5 G3 i7-1265U, Iris Xe G7 96EUs, 53 Вт⋅ч | Dell Latitude 9330 i7-1260U, Iris Xe G7 96EUs, 50 Вт⋅ч | |
|---|---|---|---|---|---|---|
| Время работы | 18% | 7% | -35% | -1% | -1% | |
| Чтение сайтов по Wi-Fi v.2 | 568 | 672 18% | 608 7% | 371 -35% | 565 -1% | 564 -1% |
| В простое | 1267 | 1637 | 923 | |||
| Нагрузка и 100% яркости | 109 | 158 | 140 |
Общая оценка Notebookcheck
MSI Summit E13 AI Evo A1MTG
- 04 March 2025 v8
Allen Ngo
 Total Sustainability Score:
 Декларация о непредвзятости
Отбор устройств для обзора осуществляется нашей редакцией. Тестовый образец был свободно приобретен автором за свой счет. Кредитор не имел никакого влияния на этот обзор, и производитель не получил копию этого обзора до публикации. Обязанности публиковать этот обзор не было. Мы никогда не принимаем компенсацию или оплату в обмен на наши отзывы. Являясь независимой медиа-компанией, Notebookcheck не подчиняется власти производителей, розничных продавцов или издателей.
Вот как проводит тестирование Notebookcheck
Каждый год Notebookcheck независимо проверяет сотни ноутбуков и смартфонов, используя стандартизированные процедуры, чтобы гарантировать сопоставимость всех результатов. В течение примерно 20 лет мы постоянно совершенствовали наши методы испытаний и при этом установили отраслевые стандарты. В наших испытательных лабораториях опытные специалисты и редакторы используют высококачественное измерительное оборудование. Эти тесты включают в себя многоэтапный процесс проверки. Наша сложная рейтинговая система основана на сотнях обоснованных измерений и критериев, что обеспечивает объективность.

