Notebookcheck Logo
Teaser

Обзор рабочей станции Lenovo ThinkPad P16 Gen 2: Тяжеловес с супернавороченной графикой

Nvidia RTX 4000 Ada дебютирует с впечатляющими показателями.

Видеокарта с TGP 130 Вт делает эту модель одной из самых быстрых 16-дюймовых рабочих станций в ассортименте Lenovo. Однако такие аспекты, шумность и нагрев выше нормы из-за наличия столь мощных компонентов
Allen Ngo (перевод DeepL) Опубликовано 🇺🇸 🇫🇷 ...
рабочие станции ноутбуки Raptor Lake

Вердикт - За мощность приходится платить

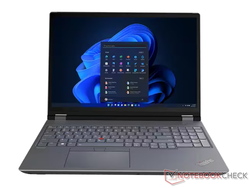
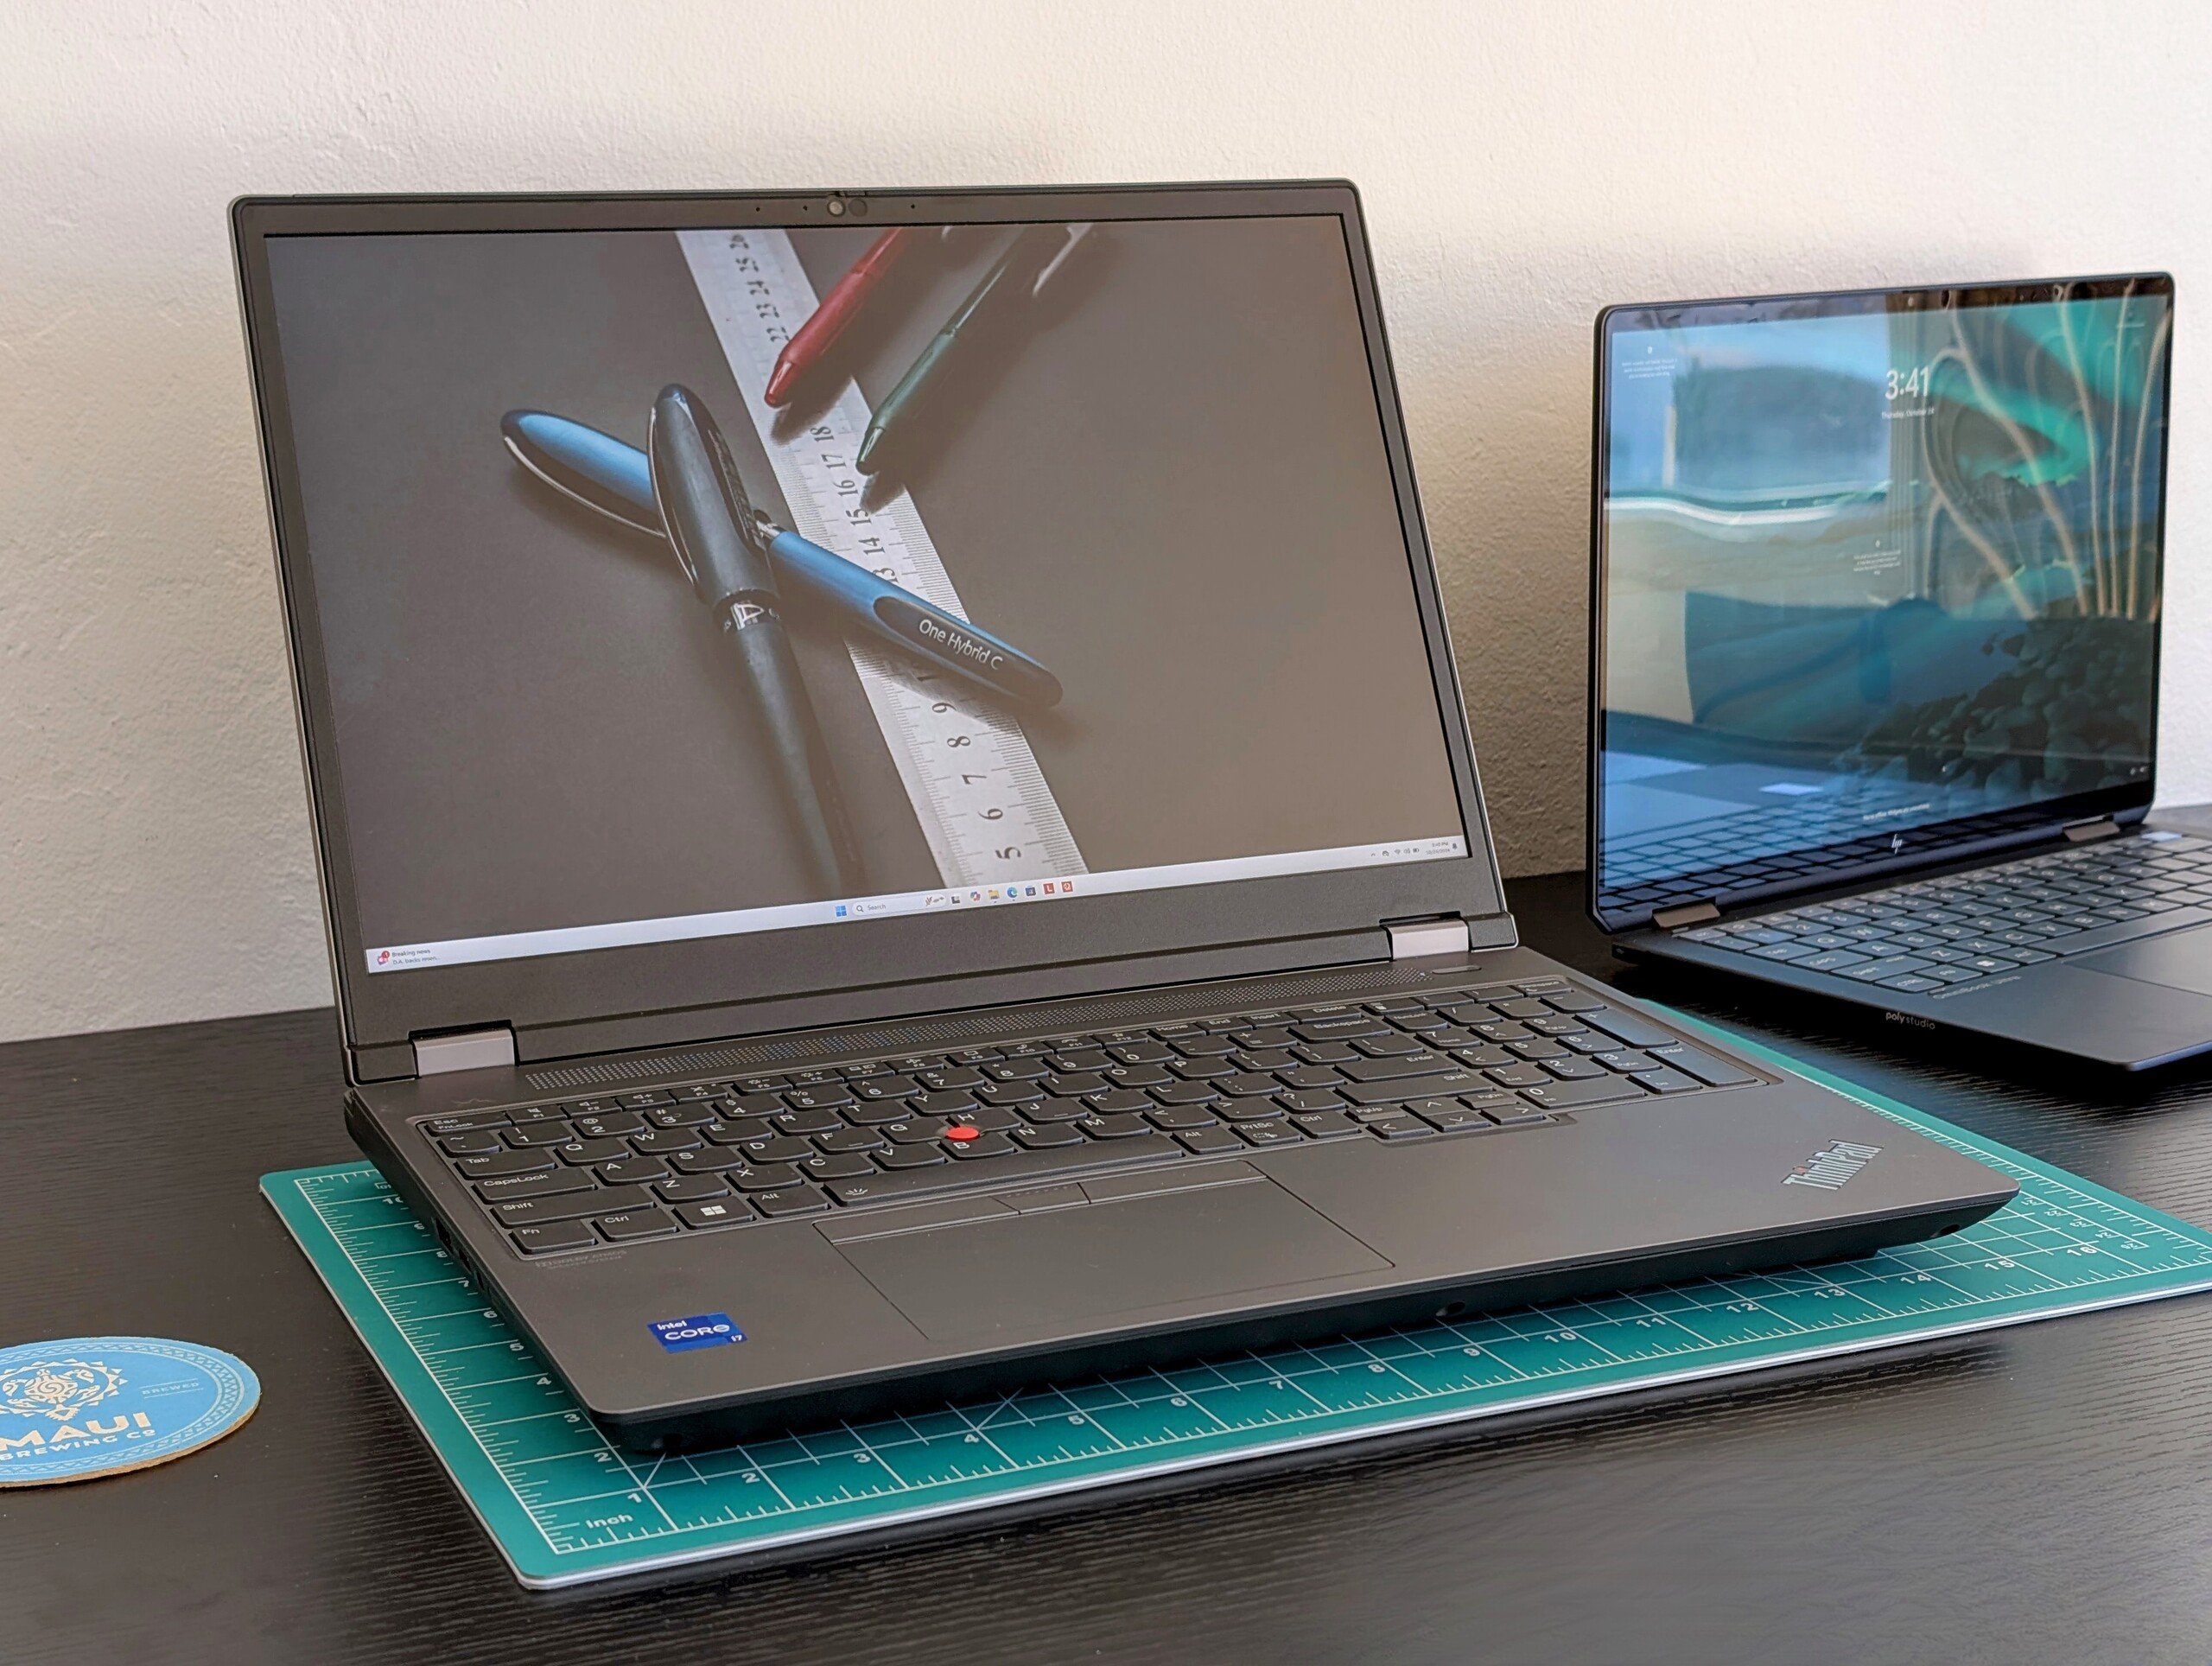
В обзоре: Lenovo ThinkPad P16 Gen 2 RTX 4000

ThinkPad P16 Gen 2 ставит во главу угла производительность, даже если это означает, что система больше, тяжелее, громче и теплее. Если Вы сможете справиться с этими недостатками, то Вы увидите, что его 130-ваттный RTX 4000 Ada - это монстр мобильной рабочей станции.

ThinkPad P16 Gen 2 справляется с высокими нагрузками благодаря требовательной 130-ваттной графике TGP, что выделяет его среди большинства других 16-дюймовых рабочих станций.

Возможно, самым заметным недостатком является то, что графический процессор может дросселировать примерно на 10% после нескольких минут нагрузки, что говорит о том, что система охлаждения не может бесконечно выдерживать все требования GPU. Время работы от аккумулятора также очень мало - всего несколько часов. Несмотря на это, ThinkPad P16 Gen 2 по-прежнему является одной из самых быстрых рабочих станций в своем классе 16-дюймовых устройств.

Хорошо (86%) Lenovo ThinkPad P16 Gen 2 Intel Core i7-14700HXNVIDIA RTX 4000 Ada Generation Laptop GPU Workstation - 25 October 2024 - v8
Тестовый образец выдан нам компанией Lenovo
Сохранить защищённую авторским правом картинку с итоговым рейтингом в формате PNG / SVG

За

+ один из самых быстрых GPU для рабочих станций на рынке
+ высокопроизводительная 130-ваттная графика TGP
+ простота обслуживания и возможности расширения
+ полный sRGB 165 Гц дисплей
+ прочная конструкция корпуса

Против

- ограниченная производительность графики
- очень теплая температура поверхности
- тяжелый даже для своей размерной категории
- очень громкий под нагрузкой
- отсутствие зарядки через USB-C
- короткое время автономной работы

Соперники

Image
Модель
Geizhals
Вес
Height
Display
1.
85.9%
Lenovo ThinkPad P16 Gen 2
Intel Core i7-14700HX ⎘
NVIDIA RTX 4000 Ada Generation Laptop GPU ⎘
32 Гбайт ОЗУ, 1024 Гбайт SSD
Listenpreis 3500 USD3.1 килог.30.23 мм16.00"
2560x1600
189 PPI
IPS
2.
90.2%
Lenovo ThinkPad P16 G2 21FA000FGE
Intel Core i7-13700HX ⎘
NVIDIA RTX 2000 Ada Generation Laptop GPU ⎘
32 Гбайт ОЗУ, 1024 Гбайт SSD
Listenpreis 2750 Euro3 килог.30.23 мм16.00"
2560x1600
189 PPI
IPS LED
3.
88.6%
Lenovo ThinkPad P16s G2 21K9000CGE
AMD Ryzen 7 PRO 7840U ⎘
AMD Radeon 780M ⎘
32 Гбайт ОЗУ, 1024 Гбайт SSD
Listenpreis 2150€1.8 килог.24.4 мм16.00"
3840x2400
283 PPI
OLED
4.
91%
Lenovo ThinkPad P16 G1 RTX A5500
Intel Core i9-12950HX ⎘
NVIDIA RTX A5500 Laptop GPU ⎘
64 Гбайт ОЗУ, 2048 Гбайт SSD
Listenpreis 9000 USD3 килог.30.23 мм16.00"
3840x2400
283 PPI
IPS
5.
85.4%
HP ZBook Power 16 G11 A
AMD Ryzen 7 8845HS ⎘
NVIDIA RTX 2000 Ada Generation Laptop GPU ⎘
64 Гбайт ОЗУ, 2048 Гбайт SSD
Listenpreis 2100 USD2.2 килог.22.9 мм16.00"
2560x1600
189 PPI
IPS
6.
88.3%
Dell Precision 5690
Dell Precision 5690
Intel Core Ultra 9 185H ⎘
NVIDIA RTX 5000 Ada Generation Laptop GPU ⎘
32 Гбайт ОЗУ, 2048 Гбайт SSD
Bestpreis 2626€ CNW IT-Systeme
2. 2626.14€ Klarsicht IT
3. 2627.14€ MetaComp
2.3 килог.22.17 мм16.00"
3840x2400
283 PPI
OLED

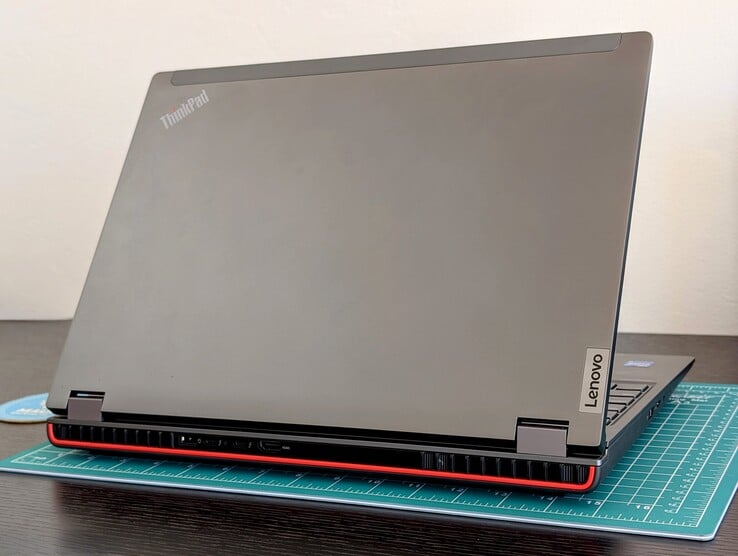
Компания Lenovo обновляет свою премиальную линейку ThinkPad P16 Gen 2 новыми процессорами Raptor Lake-HX Refresh в 4 квартале 2024 года, чтобы заменить оригинальные варианты Raptor Lake-HX, выпущенные ранее в этом году. В остальном дизайн корпуса остался неизменным, поэтому все наши впечатления от оригинальном обзоре ThinkPad P16 Gen 2 применимы и здесь, включая порты.

Наше тестовое устройство оснащено процессором Core i7-14700HX и графическим процессором Nvidia RTX 4000 Ada мощностью 130 Вт по сравнению с Core i7-13700HX и 80 Вт RTX 2000 в нашем первом обзоре ThinkPad P16 Gen 2. Прирост производительности значителен, как покажут наши данные ниже.

Конкурентами ThinkPad P16 Gen 2 являются другие высокопроизводительные 16-дюймовые мобильные рабочие станции, такие как HP ZBook Power 16 G11 A или Dell Precision 5690.

Больше обзоров Lenovo:

Оснащение

Lenovo ThinkPad P16 Gen 2 (ThinkPad P16 Серия)
Процессор
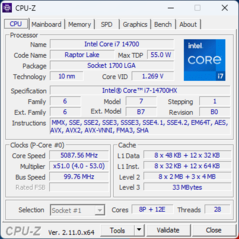
Intel Core i7-14700HX 20 x 3.9 - 5.5 GHz, 144 W PL2 / Short Burst, 67 W PL1 / Sustained, Raptor Lake-HX Refresh
Графический адаптер
NVIDIA RTX 4000 Ada Generation Laptop GPU - 12 Гбайт VRAM, Видеопр-р: 2115 МГц, Память: 2250 МГц, 130 W TDP, GDDR6, 538.78, Optimus
ОЗУ
32 Гбайт 
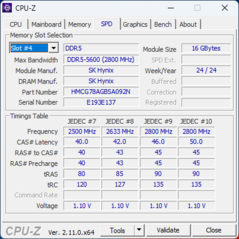
, SK Hynix, DDR5-5600, Dual-Channel, 36-36-36-70
Дисплей
16.00 дюйм. 16:10, 2560 x 1600 пикс. 189 точек/дюйм, NE160QDM-NY1, IPS, глянцевое покрытие: Нет, 165 Hz
Материнская плата
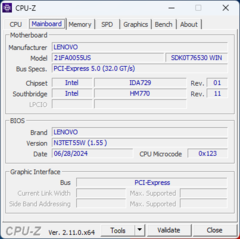
Intel HM770 (Raptor Lake-S PCH)
Хранение данных
SK hynix PC801 HFS001TEJ9X162N, 1024 Гбайт 
Звуковая плата
Intel Raptor Lake-S PCH - cAVS
Интерфейсы
3 USB 3.0 / 3.1 Gen 1, 2 USB 4.0 40 Gbps, 2 Thunderbolt, USB-C Power Delivery (PD), 1 HDMI, 3 DisplayPort, 1 слот замка Kensington, Аудиоразъёмы: 3.5 mm combo, картридер: SD, 1 сканер подушечки пальца
Коммуникации
Intel Wi-Fi 6E AX211 (a/b/g/h/n = Wi-Fi 4/ac = Wi-Fi 5/ax = Wi-Fi 6/ Wi-Fi 6E 6 GHz), Bluetooth 5.3
Габариты
толщина х ширина х глубина (мм): 30.23 x 364 x 266
Аккумулятор
94 Вт⋅ч литий-полимерн.
Операционная система
Microsoft Windows 11 Pro
Камера
Фронтальная камера: 1080p w/IR & ThinkShutter
осн. камера: 2.1 МП
Дополнительно
акустическая система: 2 W Stereo, клавиатура: 6 row full size chiclet w/numpad, 1.5 mm travel, 230 W Slim tip charger, Lenovo Commercial Vantage, 36 мес. гарантии в Европе
Вес
3.072 килогр., адаптер питания: 848 г
Стоимость
3500 USD
Внимание: Разные образцы одной и той же модели часто используют неодинаковые компоненты! (Матрица AUO вместо BOE, память Hynix вместо Samsung, накопитель SATA вместо PCIe, ...)


Дизайн и особенности

Сравнение размеров

364 mm 266 mm 30.23 mm 3.1 kg364 mm 266 mm 30.23 mm 3 kg364 mm 266 mm 30.23 mm 3 kg362 mm 256 mm 24.4 mm 1.8 kg359.4 mm 251 mm 22.9 mm 2.2 kg353.68 mm 240.33 mm 22.17 mm 2.3 kg297 mm 210 mm 1 mm 5.7 g

Картридер

SD Card Reader
average JPG Copy Test (av. of 3 runs)
HP ZBook Power 16 G11 A
AMD Ryzen 7 8845HS (Toshiba Exceria Pro SDXC 64 GB UHS-II)
174.2 MB/s +104%
Lenovo ThinkPad P16 Gen 2
Intel Core i7-14700HX (Toshiba Exceria Pro SDXC 64 GB UHS-II)
85.2 MB/s
Lenovo ThinkPad P16 G1 RTX A5500
Intel Core i9-12950HX (Toshiba Exceria Pro SDXC 64 GB UHS-II)
73.3 MB/s -14%
Lenovo ThinkPad P16 G2 21FA000FGE
Intel Core i7-13700HX
54.8 MB/s -36%
maximum AS SSD Seq Read Test (1GB)
HP ZBook Power 16 G11 A
AMD Ryzen 7 8845HS (Toshiba Exceria Pro SDXC 64 GB UHS-II)
227.2 MB/s +159%
Lenovo ThinkPad P16 Gen 2
Intel Core i7-14700HX (Toshiba Exceria Pro SDXC 64 GB UHS-II)
87.6 MB/s
Lenovo ThinkPad P16 G2 21FA000FGE
Intel Core i7-13700HX
85.1 MB/s -3%
Lenovo ThinkPad P16 G1 RTX A5500
Intel Core i9-12950HX (Toshiba Exceria Pro SDXC 64 GB UHS-II)
81.2 MB/s -7%

Связь

Networking
iperf3 transmit AXE11000
Lenovo ThinkPad P16 Gen 2
Intel Wi-Fi 6E AX211
1467 (734min - 1535max) MBit/s
Lenovo ThinkPad P16 G1 RTX A5500
Intel Wi-Fi 6E AX211
1343 (420min - 1479max) MBit/s -8%
Dell Precision 5690
 
1143 (813min - 1407max) MBit/s -22%
HP ZBook Power 16 G11 A
MediaTek Wi-Fi 6E MT7922 160MHz Wireless LAN Card
901 (860min - 938max) MBit/s -39%
Lenovo ThinkPad P16 G2 21FA000FGE
Intel Wi-Fi 6E AX211
565 (508min - 662max) MBit/s -61%
Lenovo ThinkPad P16s G2 21K9000CGE
Qualcomm WCN685x
521 (408min - 583max) MBit/s -64%
iperf3 receive AXE11000
Lenovo ThinkPad P16s G2 21K9000CGE
Qualcomm WCN685x
1590 (1465min - 1635max) MBit/s +12%
Lenovo ThinkPad P16 G2 21FA000FGE
Intel Wi-Fi 6E AX211
1583 (1445min - 1648max) MBit/s +11%
Dell Precision 5690
 
1459 (1375min - 1525max) MBit/s +2%
Lenovo ThinkPad P16 Gen 2
Intel Wi-Fi 6E AX211
1426 (1240min - 1487max) MBit/s
Lenovo ThinkPad P16 G1 RTX A5500
Intel Wi-Fi 6E AX211
1180 (1109min - 1284max) MBit/s -17%
HP ZBook Power 16 G11 A
MediaTek Wi-Fi 6E MT7922 160MHz Wireless LAN Card
896 (826min - 936max) MBit/s -37%
iperf3 transmit AXE11000 6GHz
Lenovo ThinkPad P16 G1 RTX A5500
Intel Wi-Fi 6E AX211
1502 (1142min - 1573max) MBit/s +11%
Lenovo ThinkPad P16 Gen 2
Intel Wi-Fi 6E AX211
1351 (702min - 1420max) MBit/s
Dell Precision 5690
 
1228 (666min - 1448max) MBit/s -9%
HP ZBook Power 16 G11 A
MediaTek Wi-Fi 6E MT7922 160MHz Wireless LAN Card
1073 (889min - 1300max) MBit/s -21%
Lenovo ThinkPad P16s G2 21K9000CGE
Qualcomm WCN685x
639 (603min - 681max) MBit/s -53%
Lenovo ThinkPad P16 G2 21FA000FGE
Intel Wi-Fi 6E AX211
632 (556min - 717max) MBit/s -53%
iperf3 receive AXE11000 6GHz
Lenovo ThinkPad P16s G2 21K9000CGE
Qualcomm WCN685x
1712 (1661min - 1745max) MBit/s +4%
Lenovo ThinkPad P16 G2 21FA000FGE
Intel Wi-Fi 6E AX211
1696 (1632min - 1734max) MBit/s +3%
Lenovo ThinkPad P16 Gen 2
Intel Wi-Fi 6E AX211
1642 (1609min - 1675max) MBit/s
Dell Precision 5690
 
1523 (1429min - 1570max) MBit/s -7%
HP ZBook Power 16 G11 A
MediaTek Wi-Fi 6E MT7922 160MHz Wireless LAN Card
1444 (1425min - 1464max) MBit/s -12%
Lenovo ThinkPad P16 G1 RTX A5500
Intel Wi-Fi 6E AX211
1414 (1355min - 1439max) MBit/s -14%
05010015020025030035040045050055060065070075080085090095010001050110011501200125013001350140014501500155016001650Tooltip
Lenovo ThinkPad P16 Gen 2; iperf3 transmit AXE11000 6GHz; iperf 3.1.3: Ø1328 (702-1420)
Lenovo ThinkPad P16 Gen 2; iperf3 receive AXE11000 6GHz; iperf 3.1.3: Ø1642 (1609-1675)

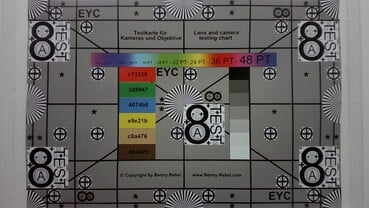
Веб-камера

ColorChecker
5.1 ∆E
3.7 ∆E
11.2 ∆E
10.2 ∆E
10.4 ∆E
7.4 ∆E
3.4 ∆E
9.1 ∆E
13.3 ∆E
5.1 ∆E
5.3 ∆E
4.5 ∆E
3.4 ∆E
5.5 ∆E
13.6 ∆E
5.7 ∆E
6.8 ∆E
6.8 ∆E
5.9 ∆E
1.5 ∆E
5 ∆E
6 ∆E
1.7 ∆E
8.8 ∆E
ColorChecker Lenovo ThinkPad P16 Gen 2: 6.64 ∆E min: 1.45 - max: 13.63 ∆E

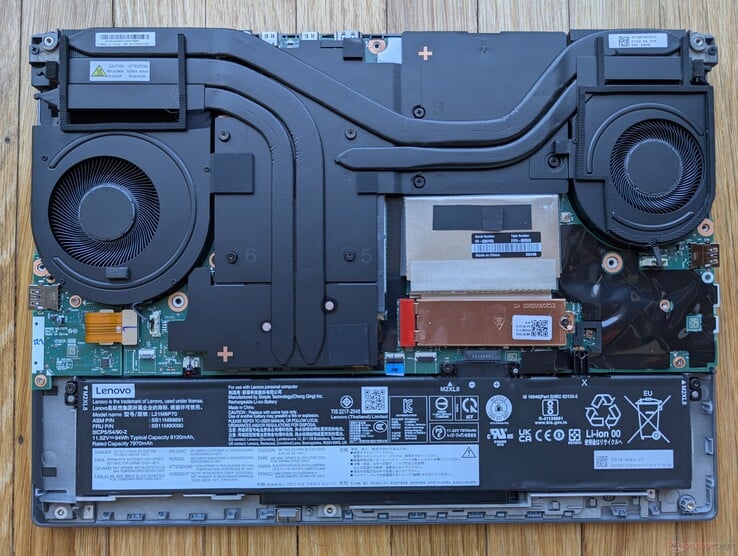
Обслуживание

ThinkPad P16 Gen 2 RTX 4000

Экологичность

В процессе производства Lenovo использует значительное количество переработанных материалов, включая 50% переработанного алюминия для внешней крышки (A cover), 90% магния для клавиатурной панели (C cover) и >85% пластика, полученного из отходов потребления, для крышек клавиш, батарейного блока и динамиков.

Упаковка не содержит пластика и полностью подлежит переработке.

Аксессуары и гарантия

В коробке нет никаких дополнений, кроме адаптера переменного тока и документов. Однако следует отметить, что наше устройство поставляется с более мощным адаптером переменного тока 230 Вт вместо 170 Вт, установленного на нашем первом ThinkPad P16 Gen 2, из-за более требовательного графического процессора RTX 4000 Ada.

В стандартной комплектации действует трехлетняя гарантия производителя.

Дисплей

Интересно, что наша IPS-панель 1600p165 от другого производителя по сравнению с IPS-панелью 1600p165 на нашем первом устройстве ThinkPad P16 Gen 2 (NE160QDM-NY1 против MNG007DA1-9). В остальном основные характеристики и яркость практически идентичны. Доступны и другие варианты дисплеев, включая 2400p OLED и 1200p IPS.

Умеренное неравномерное выделение подсветки по углам и краям
Матовая панель слегка зернистая
479.5
cd/m²
512.5
cd/m²
494.4
cd/m²
478.1
cd/m²
531.5
cd/m²
506.9
cd/m²
474.9
cd/m²
509.9
cd/m²
505.7
cd/m²
Равномерность подсветки экрана
NE160QDM-NY1 замерено через: X-Rite i1Pro 2
Максимум: 531.5 cd/m² (Nits) В среднем: 499.3 cd/m² Minimum: 4.94 cd/m²
Равномерность подсветки: 89 %
От батареи: 531.5 cd/m²
Контрастность: 1399:1 (Уровень чёрного: 0.38 cd/m²)
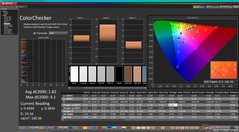
ΔE Color 1.82 | 0.5-29.43 Ø4.93, calibrated: 0.63
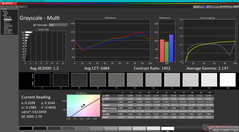
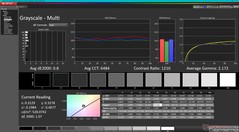
ΔE Greyscale 1.2 | 0.5-98 Ø5.2
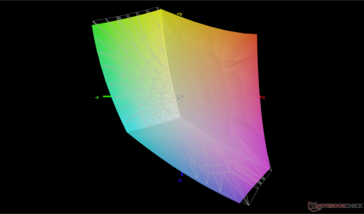
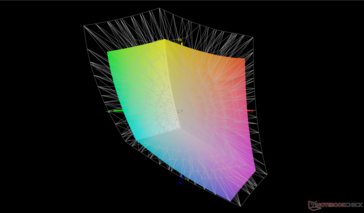
70.6% AdobeRGB 1998 (Argyll 2.2.0 3D)
96.9% sRGB (Argyll 2.2.0 3D)
68.4% Display P3 (Argyll 2.2.0 3D)
Gamma: 2.15
Lenovo ThinkPad P16 Gen 2
NE160QDM-NY1, IPS, 2560x1600, 16", 165 Hz
Lenovo ThinkPad P16 G2 21FA000FGE
MNG007DA1-9, IPS LED, 2560x1600, 16", 165 Hz
Lenovo ThinkPad P16s G2 21K9000CGE
ATNA60YV04-0, OLED, 3840x2400, 16", 60 Hz
Lenovo ThinkPad P16 G1 RTX A5500
LP160UQ1-SPB1, IPS, 3840x2400, 16", 60 Hz
HP ZBook Power 16 G11 A
AUOA0A9, IPS, 2560x1600, 16", 120 Hz
Dell Precision 5690
Samsung 160YV03, OLED, 3840x2400, 16", 60 Hz
Display
3%
29%
20%
1%
29%
Display P3 Coverage
68.4
71
4%
99.9
46%
82.9
21%
69.1
1%
99.8
46%
sRGB Coverage
96.9
99.2
2%
100
3%
98.9
2%
97.7
1%
100
3%
AdobeRGB 1998 Coverage
70.6
73.2
4%
96.9
37%
95.9
36%
71
1%
96.6
37%
Response Times
4%
88%
-248%
10%
86%
Response Time Grey 50% / Grey 80% *
14.1 ?(6.7, 7.4)
12.8 ?(61, 6.8)
9%
1.5 ?(0.8, 0.7)
89%
45.6 ?(21.2, 24.4)
-223%
13.6 ?(7.2, 6.4)
4%
1.7 ?(0.88, 0.82)
88%
Response Time Black / White *
9.9 ?(5, 4.9)
10.1 ?(5.8, 4.3)
-2%
1.3 ?(0.7, 0.6)
87%
36.8 ?(19.6, 17.2)
-272%
8.4 ?(4.5, 3.9)
15%
1.7 ?(0.74, 0.96)
83%
PWM Frequency
60
60 ?(100)
Параметры экрана
-59%
-54%
-22%
-52%
-49%
Яркость в центре
531.5
510
-4%
416
-22%
601.9
13%
470.7
-11%
348.1
-35%
Brightness
499
517
4%
421
-16%
569
14%
431
-14%
351
-30%
Brightness Distribution
89
89
0%
98
10%
77
-13%
88
-1%
97
9%
Уровень чёрного *
0.38
0.37
3%
0.47
-24%
0.57
-50%
Контрастность
1399
1378
-2%
1281
-8%
826
-41%
Colorchecker Delta E *
1.82
2.6
-43%
1.3
29%
2.45
-35%
2.16
-19%
4.18
-130%
Colorchecker dE 2000 max. *
4.1
5.2
-27%
2.8
32%
4.46
-9%
4.39
-7%
6.68
-63%
Colorchecker dE 2000 calibrated *
0.63
2.3
-265%
2.9
-360%
1.37
-117%
0.97
-54%
Delta E для серого *
1.2
3.6
-200%
1.8
-50%
2.6
-117%
3.7
-208%
1.7
-42%
Гамма
2.15 102%
2.26 97%
2.25 98%
2.3 96%
2.38 92%
2.2 100%
CCT
6484 100%
5969 109%
6574 99%
6805 96%
6765 96%
6198 105%
Среднее значение
-17% / -37%
21% / -10%
-83% / -47%
-14% / -32%
22% / -7%

* ... меньше = лучше

по сравнению с sRGB
по сравнению с sRGB
против P3
против P3

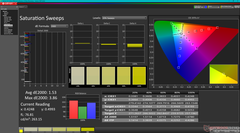
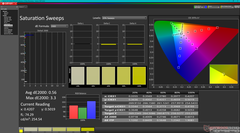
Дисплей поставляется предварительно откалиброванным по стандарту sRGB со средними значениями дельтаЕ полутонов всего 1,2 и 1,82, соответственно. Поэтому калибровка для конечного пользователя в большинстве случаев не требуется.

Градации серого до калибровки
Насыщенные звуковые сигналы перед калибровкой
ColorChecker перед калибровкой
Градации серого после калибровки
Насыщенные звуковые сигналы после калибровки
ColorChecker после калибровки

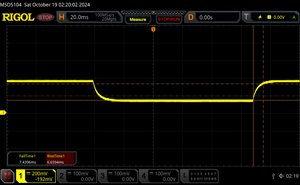
Дисплей: тест на время отклика

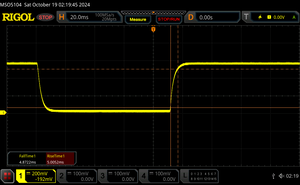
Время отклика показывает, как быстро дисплей устройства способен сменить цвет изображения с одного на другой. Недостаточно быстрый отклик может привести к деформации подвижных фрагментов изображения, появлении теней и размытости. Отсутствие таких проблем особенно важно для просмотра фильмов и для игр.
       Перемена цвета пикселей, чёрный - белый (1) и белый - чёрный (2)
9.9 ms ... стадия 1 ↗ и стадия 2 ↘ в сумме↗ 5 ms стадия 1
↘ 4.9 ms стадия 2
Это хорошее время отклика. Экран полностью подходит для игр и подобных применений.
Для сравнения, самый лучший результат среди всех известных нам устройств равен 0.1 миллисек., самый худший - 240 миллисек. » 23% экранов из нашей базы данных показали более хороший результат.
Таким образом, тестируемое устройство находится в верхней половине рейтинга (оно опережает средний результат, равный 21 миллисек.)
       Перемена цвета пикселей, серый 50% - серый 80% (1) и серый 80% - серый 50% (2)
14.1 ms ... стадия 1 ↗ и стадия 2 ↘ в сумме↗ 6.7 ms стадия 1
↘ 7.4 ms стадия 2
Это неплохое время отклика. Оно подходит для игр и подобных применений, хоть и не идеально.
Для сравнения, самый лучший результат среди всех известных нам устройств равен 0.165 миллисек., самый худший - 636 миллисек. » 24% экранов из нашей базы данных показали более хороший результат.
Таким образом, тестируемое устройство находится в верхней половине рейтинга (оно опережает средний результат, равный 32.9 миллисек.)

Тест на мерцание

Некоторые устройства устанавливают яркость экрана при помощи быстрого включения-выключения светодиодов вместо простого понижения напряжения их питания. Такой метод обозначается аббревиатурой ШИМ (или PWM). Он часто приводит к полоскам или ряби на изображении, а также к быстрой усталости глаз и головной боли. Мы проверяем, используется ли PWM в тестируемом устройстве, и если да, то при каких условиях.
Ура! ШИМ не обнаружено

Для сравнения, 53 % известных нам устройств не применяют PWM для изменения яркости, а среди тех, где PWM используется, типичная частота модуляции составляет 8774 Гц (мин. 5 Гц, макс. 343500 Гц).

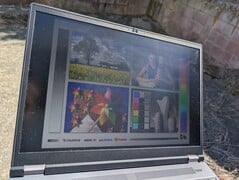
На открытом воздухе под солнечными лучами
На открытом воздухе в тени
На открытом воздухе под солнечными лучами
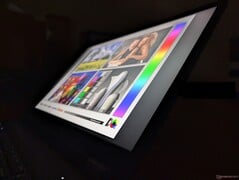
Широкие углы обзора IPS

Производительность


Условия тестирования

Мы установили Windows в режим производительности, а GPU - в дискретный режим перед выполнением приведенных ниже бенчмарков. Система не поддерживает Advanced Optimus, согласно данным Nvidia Control Panel.

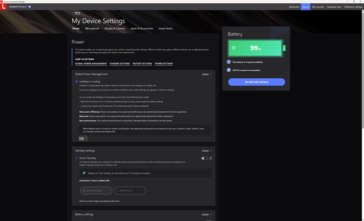
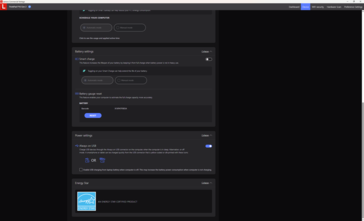
Настройки питания Lenovo Vantage
Дополнительные настройки мощности и режима зарядки

Процессор

 Core i7-14700HX это значительный прирост по сравнению с Core i7-13700HX с приростом многопоточной производительности на 20-25%. SKU с Core i9-13980HX все еще доступны, и они могут обеспечить еще более высокую производительность, чем наш Core I7-14700HX, несмотря на то, что это более старый процессор.

Устойчивость производительности хорошая, но могла бы быть и лучше. Например, при циклическом выполнении CineBench R15 xT наш первоначальный результат в 3930 баллов снижался на 10% уже после нескольких циклов.

Многопоточный тест Cinebench R15

0200400600800100012001400160018002000220024002600280030003200340036003800Tooltip
Lenovo ThinkPad P16 Gen 2 Intel Core i7-14700HX: Ø3368 (2675.23-3930.05)
Lenovo ThinkPad P16 G2 21FA000FGE Intel Core i7-13700HX: Ø2785 (2533.57-3082.38)
Lenovo ThinkPad P16s G2 21K9000CGE AMD Ryzen 7 PRO 7840U: Ø2317 (2288.98-2418.09)
Lenovo ThinkPad P16 G1 RTX A5500 Intel Core i9-12950HX: Ø2811 (2643.23-3141.69)
HP ZBook Power 16 G11 A AMD Ryzen 7 8845HS: Ø2285 (2083.77-2574.67)
Dell Precision 5690 Intel Core Ultra 9 185H: Ø2340 (2218.28-3164.56)
CPU Performance Rating: Percent
Cinebench R23: Multi Core | Single Core
Cinebench R20: CPU (Multi Core) | CPU (Single Core)
Cinebench R15: CPU Multi 64Bit | CPU Single 64Bit
Blender: v2.79 BMW27 CPU
7-Zip 18.03: 7z b 4 | 7z b 4 -mmt1
Geekbench 6.3: Multi-Core | Single-Core
Geekbench 5.5: Multi-Core | Single-Core
HWBOT x265 Benchmark v2.2: 4k Preset
LibreOffice : 20 Documents To PDF
R Benchmark 2.5: Overall mean
CPU Performance Rating
HP ZBook Fury 16 G11
Intel Core i9-14900HX
88.2 pt
Lenovo ThinkPad P16 Gen 2
Intel Core i7-14700HX
85.9 pt
Усредн. модель с Intel Core i7-14700HX
 
83.3 pt
Lenovo ThinkPad P16 G1 RTX A5500 -2!
Intel Core i9-12950HX
74.6 pt
Lenovo ThinkPad P1 G6 21FV001KUS
Intel Core i7-13800H
73 pt
Lenovo ThinkPad P16 G2 21FA000FGE -2!
Intel Core i7-13700HX
72.8 pt
Dell Precision 5690
Intel Core Ultra 9 185H
72.2 pt
Lenovo ThinkPad P1 G6-21FV000DGE
Intel Core i9-13900H
72.1 pt
Lenovo ThinkPad P1 Gen 7 21KV001SGE
Intel Core Ultra 7 155H
69.8 pt
HP ZBook Fury 16 G9 -2!
Intel Core i9-12950HX
69.2 pt
Усредн. модель класса Workstation
 
69 pt
HP ZBook Power 16 G11 A
AMD Ryzen 7 8845HS
67.8 pt
MSI CreatorPro Z16P B12UKST -2!
Intel Core i7-12700H
65.2 pt
Lenovo ThinkPad P16v G1 AMD
AMD Ryzen 7 PRO 7840HS
64.2 pt
Lenovo ThinkPad P16s G2 21K9000CGE
AMD Ryzen 7 PRO 7840U
63.7 pt
HP ZBook Firefly 16 G9-6B897EA -2!
Intel Core i7-1265U
33.1 pt
Cinebench R23 / Multi Core
HP ZBook Fury 16 G11
Intel Core i9-14900HX
27130 (20747.4min - 27130max) Points +9%
Lenovo ThinkPad P16 Gen 2
Intel Core i7-14700HX
24963 (19796.3min - 24962.7max) Points
Усредн. модель с Intel Core i7-14700HX
  (22313 - 28122, n=7)
24631 Points -1%
Lenovo ThinkPad P16 G2 21FA000FGE
Intel Core i7-13700HX
20479 Points -18%
Lenovo ThinkPad P16 G1 RTX A5500
Intel Core i9-12950HX
20351 (13965.7min - 20351.1max) Points -18%
Dell Precision 5690
Intel Core Ultra 9 185H
19158 (13886.3min - 19158.4max) Points -23%
HP ZBook Fury 16 G9
Intel Core i9-12950HX
19153 (17138min - 19152.9max) Points -23%
Lenovo ThinkPad P1 Gen 7 21KV001SGE
Intel Core Ultra 7 155H
18762 Points -25%
Lenovo ThinkPad P1 G6-21FV000DGE
Intel Core i9-13900H
18556 Points -26%
Lenovo ThinkPad P1 G6 21FV001KUS
Intel Core i7-13800H
17591 (15401.5min - 17590.8max) Points -30%
Усредн. модель класса Workstation
  (11026 - 27130, n=29, посл. 2 года)
17419 Points -30%
MSI CreatorPro Z16P B12UKST
Intel Core i7-12700H
17228 Points -31%
HP ZBook Power 16 G11 A
AMD Ryzen 7 8845HS
16093 (15617.2min - 16093.5max) Points -36%
Lenovo ThinkPad P16s G2 21K9000CGE
AMD Ryzen 7 PRO 7840U
15142 Points -39%
Lenovo ThinkPad P16v G1 AMD
AMD Ryzen 7 PRO 7840HS
14240 Points -43%
HP ZBook Firefly 16 G9-6B897EA
Intel Core i7-1265U
4340 Points -83%
Cinebench R23 / Single Core
HP ZBook Fury 16 G11
Intel Core i9-14900HX
2178 Points +5%
Lenovo ThinkPad P16 Gen 2
Intel Core i7-14700HX
2069 Points
Lenovo ThinkPad P1 G6-21FV000DGE
Intel Core i9-13900H
2033 Points -2%
Lenovo ThinkPad P1 G6 21FV001KUS
Intel Core i7-13800H
2017 Points -3%
Усредн. модель с Intel Core i7-14700HX
  (1702 - 2144, n=7)
2000 Points -3%
HP ZBook Fury 16 G9
Intel Core i9-12950HX
1922 Points -7%
Lenovo ThinkPad P16 G2 21FA000FGE
Intel Core i7-13700HX
1889 Points -9%
Lenovo ThinkPad P16 G1 RTX A5500
Intel Core i9-12950HX
1884 Points -9%
Dell Precision 5690
Intel Core Ultra 9 185H
1858 Points -10%
Усредн. модель класса Workstation
  (1465 - 2178, n=29, посл. 2 года)
1825 Points -12%
Lenovo ThinkPad P1 Gen 7 21KV001SGE
Intel Core Ultra 7 155H
1815 Points -12%
HP ZBook Power 16 G11 A
AMD Ryzen 7 8845HS
1755 Points -15%
MSI CreatorPro Z16P B12UKST
Intel Core i7-12700H
1738 Points -16%
Lenovo ThinkPad P16s G2 21K9000CGE
AMD Ryzen 7 PRO 7840U
1716 Points -17%
Lenovo ThinkPad P16v G1 AMD
AMD Ryzen 7 PRO 7840HS
1691 Points -18%
HP ZBook Firefly 16 G9-6B897EA
Intel Core i7-1265U
1144 Points -45%
Cinebench R20 / CPU (Multi Core)
HP ZBook Fury 16 G11
Intel Core i9-14900HX
10069 Points +5%
Lenovo ThinkPad P16 Gen 2
Intel Core i7-14700HX
9565 Points
Усредн. модель с Intel Core i7-14700HX
  (8361 - 10498, n=7)
9231 Points -3%
Lenovo ThinkPad P16 G2 21FA000FGE
Intel Core i7-13700HX
7870 Points -18%
Lenovo ThinkPad P16 G1 RTX A5500
Intel Core i9-12950HX
7744 Points -19%
Dell Precision 5690
Intel Core Ultra 9 185H
7387 Points -23%
HP ZBook Fury 16 G9
Intel Core i9-12950HX
7364 Points -23%
Lenovo ThinkPad P1 Gen 7 21KV001SGE
Intel Core Ultra 7 155H
7234 Points -24%
Lenovo ThinkPad P1 G6-21FV000DGE
Intel Core i9-13900H
6995 Points -27%
MSI CreatorPro Z16P B12UKST
Intel Core i7-12700H
6742 Points -30%
Lenovo ThinkPad P1 G6 21FV001KUS
Intel Core i7-13800H
6714 Points -30%
Усредн. модель класса Workstation
  (2990 - 10069, n=30, посл. 2 года)
6593 Points -31%
HP ZBook Power 16 G11 A
AMD Ryzen 7 8845HS
6342 Points -34%
Lenovo ThinkPad P16s G2 21K9000CGE
AMD Ryzen 7 PRO 7840U
5981 Points -37%
Lenovo ThinkPad P16v G1 AMD
AMD Ryzen 7 PRO 7840HS
5327 Points -44%
HP ZBook Firefly 16 G9-6B897EA
Intel Core i7-1265U
1669 Points -83%
Cinebench R20 / CPU (Single Core)
HP ZBook Fury 16 G11
Intel Core i9-14900HX
827 Points +5%
Lenovo ThinkPad P16 Gen 2
Intel Core i7-14700HX
790 Points
Lenovo ThinkPad P1 G6-21FV000DGE
Intel Core i9-13900H
782 Points -1%
Lenovo ThinkPad P1 G6 21FV001KUS
Intel Core i7-13800H
776 Points -2%
Усредн. модель с Intel Core i7-14700HX
  (651 - 821, n=7)
765 Points -3%
HP ZBook Fury 16 G9
Intel Core i9-12950HX
739 Points -6%
Lenovo ThinkPad P16 G2 21FA000FGE
Intel Core i7-13700HX
727 Points -8%
Lenovo ThinkPad P16 G1 RTX A5500
Intel Core i9-12950HX
723 Points -8%
Dell Precision 5690
Intel Core Ultra 9 185H
708 Points -10%
Усредн. модель класса Workstation
  (564 - 827, n=30, посл. 2 года)
703 Points -11%
Lenovo ThinkPad P1 Gen 7 21KV001SGE
Intel Core Ultra 7 155H
689 Points -13%
HP ZBook Power 16 G11 A
AMD Ryzen 7 8845HS
683 Points -14%
MSI CreatorPro Z16P B12UKST
Intel Core i7-12700H
675 Points -15%
Lenovo ThinkPad P16s G2 21K9000CGE
AMD Ryzen 7 PRO 7840U
671 Points -15%
Lenovo ThinkPad P16v G1 AMD
AMD Ryzen 7 PRO 7840HS
651 Points -18%
HP ZBook Firefly 16 G9-6B897EA
Intel Core i7-1265U
542 Points -31%
Cinebench R15 / CPU Multi 64Bit
HP ZBook Fury 16 G11
Intel Core i9-14900HX
4173 (2849.61min - 4173.19max) Points +6%
Lenovo ThinkPad P16 Gen 2
Intel Core i7-14700HX
3930 (2675.23min - 3930.05max) Points
Усредн. модель с Intel Core i7-14700HX
  (3328 - 4137, n=7)
3752 Points -5%
Dell Precision 5690
Intel Core Ultra 9 185H
3165 (2218.28min - 3164.56max) Points -19%
Lenovo ThinkPad P16 G1 RTX A5500
Intel Core i9-12950HX
3142 (2643.23min - 3141.69max) Points -20%
Lenovo ThinkPad P16 G2 21FA000FGE
Intel Core i7-13700HX
3082 (2533.57min - 3082.38max) Points -22%
Lenovo ThinkPad P1 Gen 7 21KV001SGE
Intel Core Ultra 7 155H
2880 (2699.24min - 2880.39max) Points -27%
Lenovo ThinkPad P1 G6 21FV001KUS
Intel Core i7-13800H
2765 (2398.94min - 2765.3max) Points -30%
Усредн. модель класса Workstation
  (1863 - 4173, n=29, посл. 2 года)
2711 Points -31%
Lenovo ThinkPad P1 G6-21FV000DGE
Intel Core i9-13900H
2627 (2237.64min - 2626.57max) Points -33%
HP ZBook Power 16 G11 A
AMD Ryzen 7 8845HS
2575 (2083.77min - 2574.67max) Points -34%
HP ZBook Fury 16 G9
Intel Core i9-12950HX
2464 (1905.94min - 2464.42max) Points -37%
Lenovo ThinkPad P16s G2 21K9000CGE
AMD Ryzen 7 PRO 7840U
2418 (2288.98min - 2418.09max) Points -38%
Lenovo ThinkPad P16v G1 AMD
AMD Ryzen 7 PRO 7840HS
2361 (2257.08min - 2361.28max) Points -40%
MSI CreatorPro Z16P B12UKST
Intel Core i7-12700H
2211 (2130.95min, 2137.41P1 - 2274.54max) Points -44%
HP ZBook Firefly 16 G9-6B897EA
Intel Core i7-1265U
723 (658.25min - 723.46max) Points -82%
Cinebench R15 / CPU Single 64Bit
HP ZBook Fury 16 G11
Intel Core i9-14900HX
297 Points +2%
Lenovo ThinkPad P16 Gen 2
Intel Core i7-14700HX
290 Points
Lenovo ThinkPad P1 G6-21FV000DGE
Intel Core i9-13900H
287 Points -1%
Lenovo ThinkPad P1 G6 21FV001KUS
Intel Core i7-13800H
287 Points -1%
Усредн. модель с Intel Core i7-14700HX
  (238 - 304, n=7)
281 Points -3%
Lenovo ThinkPad P16 G2 21FA000FGE
Intel Core i7-13700HX
279 Points -4%
HP ZBook Power 16 G11 A
AMD Ryzen 7 8845HS
275 Points -5%
Lenovo ThinkPad P16 G1 RTX A5500
Intel Core i9-12950HX
274 Points -6%
Dell Precision 5690
Intel Core Ultra 9 185H
270 Points -7%
Lenovo ThinkPad P1 Gen 7 21KV001SGE
Intel Core Ultra 7 155H
266 Points -8%
Lenovo ThinkPad P16s G2 21K9000CGE
AMD Ryzen 7 PRO 7840U
265 Points -9%
Усредн. модель класса Workstation
  (166.2 - 301, n=29, посл. 2 года)
263 Points -9%
Lenovo ThinkPad P16v G1 AMD
AMD Ryzen 7 PRO 7840HS
262 Points -10%
MSI CreatorPro Z16P B12UKST
Intel Core i7-12700H
238 Points -18%
HP ZBook Firefly 16 G9-6B897EA
Intel Core i7-1265U
206 Points -29%
HP ZBook Fury 16 G9
Intel Core i9-12950HX
167 Points -42%
Blender / v2.79 BMW27 CPU
HP ZBook Firefly 16 G9-6B897EA
Intel Core i7-1265U
684 Seconds * -403%
Lenovo ThinkPad P16s G2 21K9000CGE
AMD Ryzen 7 PRO 7840U
217 Seconds * -60%
Dell Precision 5690
Intel Core Ultra 9 185H
208 Seconds * -53%
HP ZBook Power 16 G11 A
AMD Ryzen 7 8845HS
206 Seconds * -51%
Lenovo ThinkPad P16v G1 AMD
AMD Ryzen 7 PRO 7840HS
205 Seconds * -51%
Усредн. модель класса Workstation
  (134 - 295, n=29, посл. 2 года)
202 Seconds * -49%
MSI CreatorPro Z16P B12UKST
Intel Core i7-12700H
201 Seconds * -48%
Lenovo ThinkPad P1 G6-21FV000DGE
Intel Core i9-13900H
193 Seconds * -42%
Lenovo ThinkPad P1 G6 21FV001KUS
Intel Core i7-13800H
191 Seconds * -40%
HP ZBook Fury 16 G9
Intel Core i9-12950HX
176 Seconds * -29%
Lenovo ThinkPad P1 Gen 7 21KV001SGE
Intel Core Ultra 7 155H
175 Seconds * -29%
Lenovo ThinkPad P16 G2 21FA000FGE
Intel Core i7-13700HX
161 Seconds * -18%
Lenovo ThinkPad P16 G1 RTX A5500
Intel Core i9-12950HX
160 Seconds * -18%
Усредн. модель с Intel Core i7-14700HX
  (126 - 184, n=7)
148.7 Seconds * -9%
Lenovo ThinkPad P16 Gen 2
Intel Core i7-14700HX
136 Seconds *
HP ZBook Fury 16 G11
Intel Core i9-14900HX
134 Seconds * +1%
7-Zip 18.03 / 7z b 4
HP ZBook Fury 16 G11
Intel Core i9-14900HX
101027 MIPS +2%
Lenovo ThinkPad P16 Gen 2
Intel Core i7-14700HX
98848 MIPS
Усредн. модель с Intel Core i7-14700HX
  (84799 - 104730, n=7)
95840 MIPS -3%
Lenovo ThinkPad P16 G1 RTX A5500
Intel Core i9-12950HX
80204 MIPS -19%
Lenovo ThinkPad P16 G2 21FA000FGE
Intel Core i7-13700HX
78900 MIPS -20%
HP ZBook Fury 16 G9
Intel Core i9-12950HX
76646 MIPS -22%
Dell Precision 5690
Intel Core Ultra 9 185H
74187 MIPS -25%
Lenovo ThinkPad P1 G6-21FV000DGE
Intel Core i9-13900H
70581 MIPS -29%
Lenovo ThinkPad P1 G6 21FV001KUS
Intel Core i7-13800H
70500 MIPS -29%
Lenovo ThinkPad P1 Gen 7 21KV001SGE
Intel Core Ultra 7 155H
70254 MIPS -29%
Усредн. модель класса Workstation
  (47244 - 101027, n=29, посл. 2 года)
69189 MIPS -30%
HP ZBook Power 16 G11 A
AMD Ryzen 7 8845HS
66960 MIPS -32%
MSI CreatorPro Z16P B12UKST
Intel Core i7-12700H
66768 MIPS -32%
Lenovo ThinkPad P16v G1 AMD
AMD Ryzen 7 PRO 7840HS
62497 MIPS -37%
Lenovo ThinkPad P16s G2 21K9000CGE
AMD Ryzen 7 PRO 7840U
62320 MIPS -37%
HP ZBook Firefly 16 G9-6B897EA
Intel Core i7-1265U
20087 MIPS -80%
7-Zip 18.03 / 7z b 4 -mmt1
HP ZBook Fury 16 G11
Intel Core i9-14900HX
6960 MIPS +1%
Lenovo ThinkPad P16 Gen 2
Intel Core i7-14700HX
6895 MIPS
Усредн. модель с Intel Core i7-14700HX
  (5641 - 7041, n=7)
6595 MIPS -4%
Lenovo ThinkPad P1 G6-21FV000DGE
Intel Core i9-13900H
6570 MIPS -5%
Lenovo ThinkPad P16v G1 AMD
AMD Ryzen 7 PRO 7840HS
6498 MIPS -6%
Lenovo ThinkPad P16 G2 21FA000FGE
Intel Core i7-13700HX
6355 MIPS -8%
Lenovo ThinkPad P1 G6 21FV001KUS
Intel Core i7-13800H
6310 MIPS -8%
HP ZBook Power 16 G11 A
AMD Ryzen 7 8845HS
6305 MIPS -9%
Lenovo ThinkPad P16 G1 RTX A5500
Intel Core i9-12950HX
6168 MIPS -11%
HP ZBook Fury 16 G9
Intel Core i9-12950HX
6050 MIPS -12%
Усредн. модель класса Workstation
  (4981 - 6960, n=29, посл. 2 года)
6025 MIPS -13%
Lenovo ThinkPad P16s G2 21K9000CGE
AMD Ryzen 7 PRO 7840U
5900 MIPS -14%
MSI CreatorPro Z16P B12UKST
Intel Core i7-12700H
5765 MIPS -16%
Lenovo ThinkPad P1 Gen 7 21KV001SGE
Intel Core Ultra 7 155H
5556 MIPS -19%
Dell Precision 5690
Intel Core Ultra 9 185H
4981 MIPS -28%
HP ZBook Firefly 16 G9-6B897EA
Intel Core i7-1265U
4979 MIPS -28%
Geekbench 6.3 / Multi-Core
Lenovo ThinkPad P16 Gen 2
Intel Core i7-14700HX
16326 Points
Усредн. модель с Intel Core i7-14700HX
  (14807 - 17562, n=7)
16228 Points -1%
HP ZBook Fury 16 G11
Intel Core i9-14900HX
15279 Points -6%
Dell Precision 5690
Intel Core Ultra 9 185H
14160 Points -13%
Усредн. модель класса Workstation
  (10200 - 16326, n=19, посл. 2 года)
13159 Points -19%
Lenovo ThinkPad P1 Gen 7 21KV001SGE
Intel Core Ultra 7 155H
12952 Points -21%
Lenovo ThinkPad P1 G6 21FV001KUS
Intel Core i7-13800H
12876 Points -21%
HP ZBook Power 16 G11 A
AMD Ryzen 7 8845HS
12721 Points -22%
Lenovo ThinkPad P1 G6-21FV000DGE
Intel Core i9-13900H
12578 Points -23%
Lenovo ThinkPad P16s G2 21K9000CGE
AMD Ryzen 7 PRO 7840U
11820 Points -28%
Lenovo ThinkPad P16v G1 AMD
AMD Ryzen 7 PRO 7840HS
10518 Points -36%
Geekbench 6.3 / Single-Core
HP ZBook Fury 16 G11
Intel Core i9-14900HX
2924 Points +1%
Lenovo ThinkPad P16 Gen 2
Intel Core i7-14700HX
2892 Points
Lenovo ThinkPad P1 G6 21FV001KUS
Intel Core i7-13800H
2766 Points -4%
Усредн. модель с Intel Core i7-14700HX
  (2378 - 2975, n=7)
2764 Points -4%
Lenovo ThinkPad P1 G6-21FV000DGE
Intel Core i9-13900H
2728 Points -6%
HP ZBook Power 16 G11 A
AMD Ryzen 7 8845HS
2616 Points -10%
Усредн. модель класса Workstation
  (2352 - 2949, n=19, посл. 2 года)
2602 Points -10%
Lenovo ThinkPad P16v G1 AMD
AMD Ryzen 7 PRO 7840HS
2581 Points -11%
Dell Precision 5690
Intel Core Ultra 9 185H
2531 Points -12%
Lenovo ThinkPad P16s G2 21K9000CGE
AMD Ryzen 7 PRO 7840U
2455 Points -15%
Lenovo ThinkPad P1 Gen 7 21KV001SGE
Intel Core Ultra 7 155H
2389 Points -17%
Geekbench 5.5 / Multi-Core
HP ZBook Fury 16 G11
Intel Core i9-14900HX
18407 Points +4%
Lenovo ThinkPad P16 Gen 2
Intel Core i7-14700HX
17691 Points
Усредн. модель с Intel Core i7-14700HX
  (15705 - 19597, n=7)
17679 Points 0%
Lenovo ThinkPad P16 G1 RTX A5500
Intel Core i9-12950HX
15234 Points -14%
Lenovo ThinkPad P16 G2 21FA000FGE
Intel Core i7-13700HX
14422 Points -18%
Dell Precision 5690
Intel Core Ultra 9 185H
14230 Points -20%
HP ZBook Fury 16 G9
Intel Core i9-12950HX
14028 Points -21%
Lenovo ThinkPad P1 Gen 7 21KV001SGE
Intel Core Ultra 7 155H
12982 Points -27%
Lenovo ThinkPad P1 G6 21FV001KUS
Intel Core i7-13800H
12880 Points -27%
Усредн. модель класса Workstation
  (8050 - 18407, n=29, посл. 2 года)
12873 Points -27%
MSI CreatorPro Z16P B12UKST
Intel Core i7-12700H
12125 Points -31%
HP ZBook Power 16 G11 A
AMD Ryzen 7 8845HS
11836 Points -33%
Lenovo ThinkPad P1 G6-21FV000DGE
Intel Core i9-13900H
11611 Points -34%
Lenovo ThinkPad P16s G2 21K9000CGE
AMD Ryzen 7 PRO 7840U
10907 Points -38%
Lenovo ThinkPad P16v G1 AMD
AMD Ryzen 7 PRO 7840HS
10034 Points -43%
HP ZBook Firefly 16 G9-6B897EA
Intel Core i7-1265U
5022 Points -72%
Geekbench 5.5 / Single-Core
HP ZBook Fury 16 G11
Intel Core i9-14900HX
2030 Points +1%
Lenovo ThinkPad P16 Gen 2
Intel Core i7-14700HX
2013 Points
Усредн. модель с Intel Core i7-14700HX
  (1700 - 2133, n=7)
1982 Points -2%
Lenovo ThinkPad P1 G6 21FV001KUS
Intel Core i7-13800H
1972 Points -2%
Lenovo ThinkPad P1 G6-21FV000DGE
Intel Core i9-13900H
1960 Points -3%
HP ZBook Fury 16 G9
Intel Core i9-12950HX
1945 Points -3%
Lenovo ThinkPad P16 G1 RTX A5500
Intel Core i9-12950HX
1924 Points -4%
HP ZBook Power 16 G11 A
AMD Ryzen 7 8845HS
1921 Points -5%
Lenovo ThinkPad P16 G2 21FA000FGE
Intel Core i7-13700HX
1873 Points -7%
Dell Precision 5690
Intel Core Ultra 9 185H
1864 Points -7%
Усредн. модель класса Workstation
  (1474 - 2095, n=29, посл. 2 года)
1849 Points -8%
Lenovo ThinkPad P16v G1 AMD
AMD Ryzen 7 PRO 7840HS
1822 Points -9%
HP ZBook Firefly 16 G9-6B897EA
Intel Core i7-1265U
1791 Points -11%
MSI CreatorPro Z16P B12UKST
Intel Core i7-12700H
1788 Points -11%
Lenovo ThinkPad P1 Gen 7 21KV001SGE
Intel Core Ultra 7 155H
1783 Points -11%
Lenovo ThinkPad P16s G2 21K9000CGE
AMD Ryzen 7 PRO 7840U
1749 Points -13%
HWBOT x265 Benchmark v2.2 / 4k Preset
HP ZBook Fury 16 G11
Intel Core i9-14900HX
27 fps +7%
Lenovo ThinkPad P16 Gen 2
Intel Core i7-14700HX
25.2 fps
Усредн. модель с Intel Core i7-14700HX
  (22 - 27.4, n=7)
25.1 fps 0%
Lenovo ThinkPad P16 G1 RTX A5500
Intel Core i9-12950HX
23.5 fps -7%
Lenovo ThinkPad P16 G2 21FA000FGE
Intel Core i7-13700HX
22.2 fps -12%
Dell Precision 5690
Intel Core Ultra 9 185H
22 fps -13%
Lenovo ThinkPad P1 Gen 7 21KV001SGE
Intel Core Ultra 7 155H
21.1 fps -16%
Lenovo ThinkPad P1 G6 21FV001KUS
Intel Core i7-13800H
20 fps -21%
HP ZBook Fury 16 G9
Intel Core i9-12950HX
19.6 fps -22%
HP ZBook Power 16 G11 A
AMD Ryzen 7 8845HS
19.6 fps -22%
MSI CreatorPro Z16P B12UKST
Intel Core i7-12700H
19.4 fps -23%
Усредн. модель класса Workstation
  (12.7 - 27, n=29, посл. 2 года)
19.2 fps -24%
Lenovo ThinkPad P1 G6-21FV000DGE
Intel Core i9-13900H
19.1 fps -24%
Lenovo ThinkPad P16v G1 AMD
AMD Ryzen 7 PRO 7840HS
18.1 fps -28%
Lenovo ThinkPad P16s G2 21K9000CGE
AMD Ryzen 7 PRO 7840U
17.8 fps -29%
HP ZBook Firefly 16 G9-6B897EA
Intel Core i7-1265U
5.09 fps -80%
LibreOffice / 20 Documents To PDF
HP ZBook Firefly 16 G9-6B897EA
Intel Core i7-1265U
52 s * -15%
Lenovo ThinkPad P16s G2 21K9000CGE
AMD Ryzen 7 PRO 7840U
52 s * -15%
HP ZBook Power 16 G11 A
AMD Ryzen 7 8845HS
51.5 s * -13%
Lenovo ThinkPad P16 G2 21FA000FGE
Intel Core i7-13700HX
49 s * -8%
HP ZBook Fury 16 G11
Intel Core i9-14900HX
48 s * -6%
Усредн. модель класса Workstation
  (36.5 - 95.2, n=29, посл. 2 года)
48 s * -6%
Lenovo ThinkPad P1 G6-21FV000DGE
Intel Core i9-13900H
47.4 s * -4%
Усредн. модель с Intel Core i7-14700HX
  (41.9 - 55.3, n=7)
46.5 s * -2%
Lenovo ThinkPad P16v G1 AMD
AMD Ryzen 7 PRO 7840HS
45.9 s * -1%
Lenovo ThinkPad P16 Gen 2
Intel Core i7-14700HX
45.4 s *
Lenovo ThinkPad P1 G6 21FV001KUS
Intel Core i7-13800H
44.3 s * +2%
Lenovo ThinkPad P1 Gen 7 21KV001SGE
Intel Core Ultra 7 155H
44.1 s * +3%
Dell Precision 5690
Intel Core Ultra 9 185H
41.9 s * +8%
Lenovo ThinkPad P16 G1 RTX A5500
Intel Core i9-12950HX
39.7 s * +13%
MSI CreatorPro Z16P B12UKST
Intel Core i7-12700H
38.2 s * +16%
HP ZBook Fury 16 G9
Intel Core i9-12950HX
36.5 s * +20%
R Benchmark 2.5 / Overall mean
HP ZBook Firefly 16 G9-6B897EA
Intel Core i7-1265U
0.544 sec * -38%
Lenovo ThinkPad P16s G2 21K9000CGE
AMD Ryzen 7 PRO 7840U
0.4658 sec * -18%
Lenovo ThinkPad P1 Gen 7 21KV001SGE
Intel Core Ultra 7 155H
0.4636 sec * -17%
Dell Precision 5690
Intel Core Ultra 9 185H
0.4601 sec * -16%
MSI CreatorPro Z16P B12UKST
Intel Core i7-12700H
0.4541 sec * -15%
Усредн. модель класса Workstation
  (0.3825 - 0.54, n=29, посл. 2 года)
0.4497 sec * -14%
HP ZBook Power 16 G11 A
AMD Ryzen 7 8845HS
0.447 sec * -13%
Lenovo ThinkPad P16 G1 RTX A5500
Intel Core i9-12950HX
0.4416 sec * -12%
Lenovo ThinkPad P16 G2 21FA000FGE
Intel Core i7-13700HX
0.4407 sec * -12%
Lenovo ThinkPad P16v G1 AMD
AMD Ryzen 7 PRO 7840HS
0.44 sec * -11%
HP ZBook Fury 16 G9
Intel Core i9-12950HX
0.4328 sec * -10%
Усредн. модель с Intel Core i7-14700HX
  (0.3821 - 0.4896, n=7)
0.4182 sec * -6%
Lenovo ThinkPad P1 G6-21FV000DGE
Intel Core i9-13900H
0.4173 sec * -6%
Lenovo ThinkPad P1 G6 21FV001KUS
Intel Core i7-13800H
0.4103 sec * -4%
Lenovo ThinkPad P16 Gen 2
Intel Core i7-14700HX
0.395 sec *
HP ZBook Fury 16 G11
Intel Core i9-14900HX
0.3825 sec * +3%
CPU Performance Rating: Percent
Cinebench R23: Multi Core | Single Core
Cinebench R20: CPU (Multi Core) | CPU (Single Core)
Cinebench R15: CPU Multi 64Bit | CPU Single 64Bit
Blender: v2.79 BMW27 CPU
7-Zip 18.03: 7z b 4 | 7z b 4 -mmt1
Geekbench 6.3: Multi-Core | Single-Core
Geekbench 5.5: Multi-Core | Single-Core
HWBOT x265 Benchmark v2.2: 4k Preset
LibreOffice : 20 Documents To PDF
R Benchmark 2.5: Overall mean

* ... меньше = лучше

Cinebench R15 CPU Multi 64Bit
3930 Points
Cinebench R15 OpenGL 64Bit
327 fps
Cinebench R15 Ref. Match 64Bit
99.6 %
Cinebench R15 CPU Single 64Bit
290 Points
?
Performance Rating
Lenovo ThinkPad P16 Gen 2
Intel Core i7-14700HX, NVIDIA RTX 4000 Ada Generation Laptop GPU
93.1 pt
Усредн. модель с Intel Core i7-14700HX
 
93 pt
HP ZBook Power 16 G11 A
AMD Ryzen 7 8845HS, NVIDIA RTX 2000 Ada Generation Laptop GPU
90.3 pt
Lenovo ThinkPad P16s G2 21K9000CGE
AMD Ryzen 7 PRO 7840U, Radeon 780M
84.4 pt
Dell Precision 5690
Intel Core Ultra 9 185H, NVIDIA RTX 5000 Ada Generation Laptop GPU
81.8 pt
Lenovo ThinkPad P16 G1 RTX A5500
Intel Core i9-12950HX, RTX A5500 Laptop GPU
79.8 pt
Lenovo ThinkPad P16 G2 21FA000FGE
Intel Core i7-13700HX, NVIDIA RTX 2000 Ada Generation Laptop GPU
78.3 pt
AIDA64 / FP32 Ray-Trace
HP ZBook Power 16 G11 A
AMD Ryzen 7 8845HS, NVIDIA RTX 2000 Ada Generation Laptop GPU
24941 KRay/s +18%
Lenovo ThinkPad P16s G2 21K9000CGE
AMD Ryzen 7 PRO 7840U, Radeon 780M
23889 KRay/s +13%
Усредн. модель с Intel Core i7-14700HX
  (16932 - 23676, n=7)
21253 KRay/s 0%
Lenovo ThinkPad P16 Gen 2
Intel Core i7-14700HX, NVIDIA RTX 4000 Ada Generation Laptop GPU
21152 KRay/s
Dell Precision 5690
Intel Core Ultra 9 185H, NVIDIA RTX 5000 Ada Generation Laptop GPU
18502 KRay/s -13%
Lenovo ThinkPad P16 G2 21FA000FGE
Intel Core i7-13700HX, NVIDIA RTX 2000 Ada Generation Laptop GPU
18420 KRay/s -13%
Lenovo ThinkPad P16 G1 RTX A5500
Intel Core i9-12950HX, RTX A5500 Laptop GPU
18395 KRay/s -13%
AIDA64 / FPU Julia
HP ZBook Power 16 G11 A
AMD Ryzen 7 8845HS, NVIDIA RTX 2000 Ada Generation Laptop GPU
109949 Points 0%
Lenovo ThinkPad P16 Gen 2
Intel Core i7-14700HX, NVIDIA RTX 4000 Ada Generation Laptop GPU
109518 Points
Усредн. модель с Intel Core i7-14700HX
  (86338 - 116556, n=7)
107655 Points -2%
Lenovo ThinkPad P16s G2 21K9000CGE
AMD Ryzen 7 PRO 7840U, Radeon 780M
100087 Points -9%
Dell Precision 5690
Intel Core Ultra 9 185H, NVIDIA RTX 5000 Ada Generation Laptop GPU
94737 Points -13%
Lenovo ThinkPad P16 G2 21FA000FGE
Intel Core i7-13700HX, NVIDIA RTX 2000 Ada Generation Laptop GPU
94499 Points -14%
Lenovo ThinkPad P16 G1 RTX A5500
Intel Core i9-12950HX, RTX A5500 Laptop GPU
93999 Points -14%
AIDA64 / CPU SHA3
Lenovo ThinkPad P16 Gen 2
Intel Core i7-14700HX, NVIDIA RTX 4000 Ada Generation Laptop GPU
5134 MB/s
Усредн. модель с Intel Core i7-14700HX
  (4008 - 5567, n=7)
5065 MB/s -1%
HP ZBook Power 16 G11 A
AMD Ryzen 7 8845HS, NVIDIA RTX 2000 Ada Generation Laptop GPU
4717 MB/s -8%
Lenovo ThinkPad P16s G2 21K9000CGE
AMD Ryzen 7 PRO 7840U, Radeon 780M
4394 MB/s -14%
Dell Precision 5690
Intel Core Ultra 9 185H, NVIDIA RTX 5000 Ada Generation Laptop GPU
4382 MB/s -15%
Lenovo ThinkPad P16 G2 21FA000FGE
Intel Core i7-13700HX, NVIDIA RTX 2000 Ada Generation Laptop GPU
4265 MB/s -17%
Lenovo ThinkPad P16 G1 RTX A5500
Intel Core i9-12950HX, RTX A5500 Laptop GPU
4254 MB/s -17%
AIDA64 / CPU Queen
Lenovo ThinkPad P16 Gen 2
Intel Core i7-14700HX, NVIDIA RTX 4000 Ada Generation Laptop GPU
144411 Points
Усредн. модель с Intel Core i7-14700HX
  (129836 - 152200, n=7)
141316 Points -2%
HP ZBook Power 16 G11 A
AMD Ryzen 7 8845HS, NVIDIA RTX 2000 Ada Generation Laptop GPU
117147 Points -19%
Lenovo ThinkPad P16 G2 21FA000FGE
Intel Core i7-13700HX, NVIDIA RTX 2000 Ada Generation Laptop GPU
109246 Points -24%
Lenovo ThinkPad P16 G1 RTX A5500
Intel Core i9-12950HX, RTX A5500 Laptop GPU
103733 Points -28%
Lenovo ThinkPad P16s G2 21K9000CGE
AMD Ryzen 7 PRO 7840U, Radeon 780M
97790 Points -32%
Dell Precision 5690
Intel Core Ultra 9 185H, NVIDIA RTX 5000 Ada Generation Laptop GPU
94433 Points -35%
AIDA64 / FPU SinJulia
HP ZBook Power 16 G11 A
AMD Ryzen 7 8845HS, NVIDIA RTX 2000 Ada Generation Laptop GPU
14611 Points +9%
Lenovo ThinkPad P16s G2 21K9000CGE
AMD Ryzen 7 PRO 7840U, Radeon 780M
14151 Points +6%
Lenovo ThinkPad P16 Gen 2
Intel Core i7-14700HX, NVIDIA RTX 4000 Ada Generation Laptop GPU
13359 Points
Усредн. модель с Intel Core i7-14700HX
  (11704 - 14434, n=7)
13322 Points 0%
Lenovo ThinkPad P16 G1 RTX A5500
Intel Core i9-12950HX, RTX A5500 Laptop GPU
12364 Points -7%
Lenovo ThinkPad P16 G2 21FA000FGE
Intel Core i7-13700HX, NVIDIA RTX 2000 Ada Generation Laptop GPU
12013 Points -10%
Dell Precision 5690
Intel Core Ultra 9 185H, NVIDIA RTX 5000 Ada Generation Laptop GPU
11351 Points -15%
AIDA64 / FPU Mandel
HP ZBook Power 16 G11 A
AMD Ryzen 7 8845HS, NVIDIA RTX 2000 Ada Generation Laptop GPU
57964 Points +10%
Lenovo ThinkPad P16s G2 21K9000CGE
AMD Ryzen 7 PRO 7840U, Radeon 780M
53280 Points +1%
Lenovo ThinkPad P16 Gen 2
Intel Core i7-14700HX, NVIDIA RTX 4000 Ada Generation Laptop GPU
52884 Points
Усредн. модель с Intel Core i7-14700HX
  (42125 - 58380, n=7)
52861 Points 0%
Dell Precision 5690
Intel Core Ultra 9 185H, NVIDIA RTX 5000 Ada Generation Laptop GPU
46868 Points -11%
Lenovo ThinkPad P16 G1 RTX A5500
Intel Core i9-12950HX, RTX A5500 Laptop GPU
46310 Points -12%
Lenovo ThinkPad P16 G2 21FA000FGE
Intel Core i7-13700HX, NVIDIA RTX 2000 Ada Generation Laptop GPU
45667 Points -14%
AIDA64 / CPU AES
Lenovo ThinkPad P16 Gen 2
Intel Core i7-14700HX, NVIDIA RTX 4000 Ada Generation Laptop GPU
101561 MB/s
Усредн. модель с Intel Core i7-14700HX
  (82161 - 113157, n=7)
101130 MB/s 0%
Dell Precision 5690
Intel Core Ultra 9 185H, NVIDIA RTX 5000 Ada Generation Laptop GPU
88875 MB/s -12%
Lenovo ThinkPad P16 G2 21FA000FGE
Intel Core i7-13700HX, NVIDIA RTX 2000 Ada Generation Laptop GPU
88115 MB/s -13%
Lenovo ThinkPad P16 G1 RTX A5500
Intel Core i9-12950HX, RTX A5500 Laptop GPU
87460 MB/s -14%
HP ZBook Power 16 G11 A
AMD Ryzen 7 8845HS, NVIDIA RTX 2000 Ada Generation Laptop GPU
83557 MB/s -18%
Lenovo ThinkPad P16s G2 21K9000CGE
AMD Ryzen 7 PRO 7840U, Radeon 780M
82707 MB/s -19%
AIDA64 / CPU ZLib
Lenovo ThinkPad P16 Gen 2
Intel Core i7-14700HX, NVIDIA RTX 4000 Ada Generation Laptop GPU
1535 MB/s
Усредн. модель с Intel Core i7-14700HX
  (1177 - 1682, n=7)
1502 MB/s -2%
Dell Precision 5690
Intel Core Ultra 9 185H, NVIDIA RTX 5000 Ada Generation Laptop GPU
1341 MB/s -13%
Lenovo ThinkPad P16 G1 RTX A5500
Intel Core i9-12950HX, RTX A5500 Laptop GPU
1217 MB/s -21%
Lenovo ThinkPad P16 G2 21FA000FGE
Intel Core i7-13700HX, NVIDIA RTX 2000 Ada Generation Laptop GPU
1126 MB/s -27%
HP ZBook Power 16 G11 A
AMD Ryzen 7 8845HS, NVIDIA RTX 2000 Ada Generation Laptop GPU
1069 MB/s -30%
Lenovo ThinkPad P16s G2 21K9000CGE
AMD Ryzen 7 PRO 7840U, Radeon 780M
1004 MB/s -35%
AIDA64 / FP64 Ray-Trace
HP ZBook Power 16 G11 A
AMD Ryzen 7 8845HS, NVIDIA RTX 2000 Ada Generation Laptop GPU
13155 KRay/s +16%
Lenovo ThinkPad P16s G2 21K9000CGE
AMD Ryzen 7 PRO 7840U, Radeon 780M
12540 KRay/s +10%
Усредн. модель с Intel Core i7-14700HX
  (9029 - 12928, n=7)
11393 KRay/s 0%
Lenovo ThinkPad P16 Gen 2
Intel Core i7-14700HX, NVIDIA RTX 4000 Ada Generation Laptop GPU
11372 KRay/s
Lenovo ThinkPad P16 G1 RTX A5500
Intel Core i9-12950HX, RTX A5500 Laptop GPU
9925 KRay/s -13%
Lenovo ThinkPad P16 G2 21FA000FGE
Intel Core i7-13700HX, NVIDIA RTX 2000 Ada Generation Laptop GPU
9876 KRay/s -13%
Dell Precision 5690
Intel Core Ultra 9 185H, NVIDIA RTX 5000 Ada Generation Laptop GPU
9707 KRay/s -15%
AIDA64 / CPU PhotoWorxx
Dell Precision 5690
Intel Core Ultra 9 185H, NVIDIA RTX 5000 Ada Generation Laptop GPU
51647 MPixel/s +29%
Усредн. модель с Intel Core i7-14700HX
  (39151 - 49671, n=7)
43200 MPixel/s +8%
Lenovo ThinkPad P16 G1 RTX A5500
Intel Core i9-12950HX, RTX A5500 Laptop GPU
40688 MPixel/s +2%
HP ZBook Power 16 G11 A
AMD Ryzen 7 8845HS, NVIDIA RTX 2000 Ada Generation Laptop GPU
40286 MPixel/s +1%
Lenovo ThinkPad P16 Gen 2
Intel Core i7-14700HX, NVIDIA RTX 4000 Ada Generation Laptop GPU
40057 MPixel/s
Lenovo ThinkPad P16s G2 21K9000CGE
AMD Ryzen 7 PRO 7840U, Radeon 780M
37894 MPixel/s -5%
Lenovo ThinkPad P16 G2 21FA000FGE
Intel Core i7-13700HX, NVIDIA RTX 2000 Ada Generation Laptop GPU
35176 MPixel/s -12%

Стресс-тест

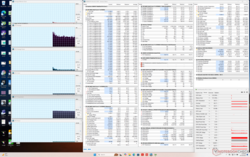
Система простаивает
Система простаивает

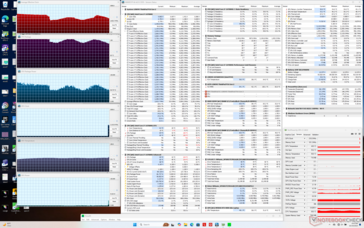
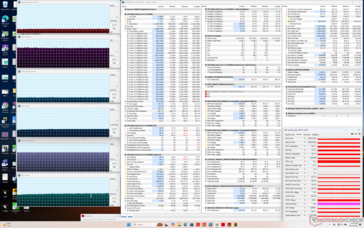
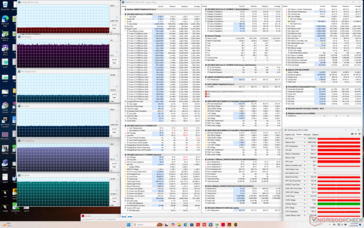
Температура ядра довольно высока, когда система находится под нагрузкой, что приводит к очень высокой температуре поверхности, как указано в разделе "Температура" ниже. Например, при запуске Prime95 или Cyberpunk 2077 температура процессора может превышать 80 C, а иногда и 100 C. Потребляемая мощность и, соответственно, тактовая частота колеблются между 66 и 90 Вт, чтобы поддерживать температуру, как показано на наших скриншотах ниже.

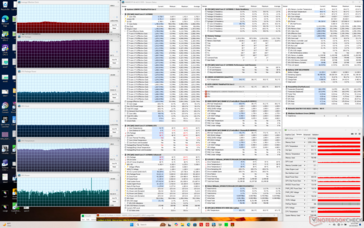
Потребляемая мощность платы GPU может достигать заявленных 130 Вт при запуске Cyberpunk 2077 в режиме Performance. Однако температура GPU будет относительно высокой - более 85 C, поэтому частота кадров в итоге упадет, как уже говорилось в разделе "Производительность GPU". Тактовая частота ядра, тактовая частота памяти и энергопотребление платы снизятся еще больше, если вместо этого играть в сбалансированном режиме.

Prime95
Prime95
Prime95+FurMark
Prime95+FurMark
Cyberpunk 2077 (режим balanced)
Cyberpunk 2077 (режим Performance)
Тактовая частота CPU (ГГц) Тактовая частота GPU (МГц) Средняя температура CPU (°C) Средняя температура GPU (°C)
Простой системы -- -- 49 36
Prime95 Stress 2.6 - 3.1 -- 85 - 100 49
Prime95 + FurMark Stress 1.8 2115 98 83
Cyberpunk 2077 Stress (сбалансированный режим) 0.8 1425 69 67
Cyberpunk 2077 Stress (режим Performance) 1.0 1995 82 85

Производительность системы

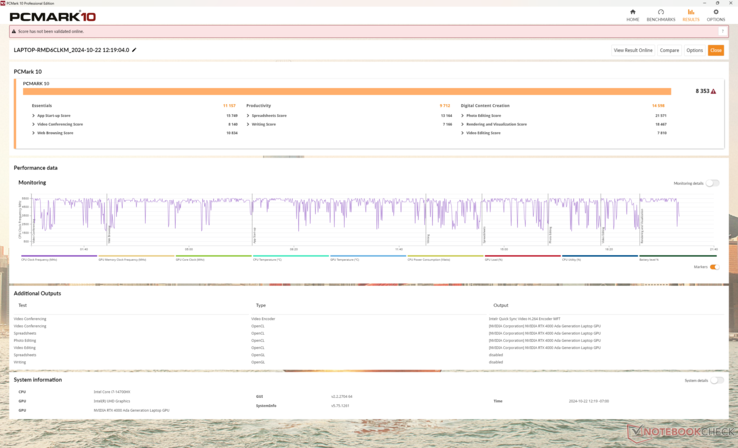
Показатели PCMark 10 - одни из самых высоких среди всех 16-дюймовых рабочих станций благодаря сочетанию быстрого процессора Raptor Lake-HX Refresh и 130-ваттного GPU RTX 4000 Ada
PCMark 10 / Score
Lenovo ThinkPad P16 Gen 2
NVIDIA RTX 4000 Ada Generation Laptop GPU, i7-14700HX, SK hynix PC801 HFS001TEJ9X162N
8353 Points
Усредн. модель с Intel Core i7-14700HX, NVIDIA RTX 4000 Ada Generation Laptop GPU
  ()
8353 Points 0%
Dell Precision 5690
NVIDIA RTX 5000 Ada Generation Laptop GPU, Ultra 9 185H, 2x Samsung PM9A1 1TB (RAID 0)
8065 Points -3%
HP ZBook Power 16 G11 A
NVIDIA RTX 2000 Ada Generation Laptop GPU, R7 8845HS, Samsung PM9A1 MZVL22T0HBLB
7376 Points -12%
Lenovo ThinkPad P16 G1 RTX A5500
RTX A5500 Laptop GPU, i9-12950HX, WDC PC SN810 2TB
7236 Points -13%
Lenovo ThinkPad P16 G2 21FA000FGE
NVIDIA RTX 2000 Ada Generation Laptop GPU, i7-13700HX, SK hynix PC801 HFS001TEJ9X162N
7154 Points -14%
Lenovo ThinkPad P16s G2 21K9000CGE
Radeon 780M, R7 PRO 7840U, SK hynix PC801 HFS001TEJ9X162N
6628 Points -21%
PCMark 10 / Essentials
Lenovo ThinkPad P16 Gen 2
NVIDIA RTX 4000 Ada Generation Laptop GPU, i7-14700HX, SK hynix PC801 HFS001TEJ9X162N
11157 Points
Усредн. модель с Intel Core i7-14700HX, NVIDIA RTX 4000 Ada Generation Laptop GPU
  ()
11157 Points 0%
Dell Precision 5690
NVIDIA RTX 5000 Ada Generation Laptop GPU, Ultra 9 185H, 2x Samsung PM9A1 1TB (RAID 0)
11011 Points -1%
Lenovo ThinkPad P16 G2 21FA000FGE
NVIDIA RTX 2000 Ada Generation Laptop GPU, i7-13700HX, SK hynix PC801 HFS001TEJ9X162N
10987 Points -2%
Lenovo ThinkPad P16 G1 RTX A5500
RTX A5500 Laptop GPU, i9-12950HX, WDC PC SN810 2TB
10898 Points -2%
HP ZBook Power 16 G11 A
NVIDIA RTX 2000 Ada Generation Laptop GPU, R7 8845HS, Samsung PM9A1 MZVL22T0HBLB
10463 Points -6%
Lenovo ThinkPad P16s G2 21K9000CGE
Radeon 780M, R7 PRO 7840U, SK hynix PC801 HFS001TEJ9X162N
10098 Points -9%
PCMark 10 / Productivity
Dell Precision 5690
NVIDIA RTX 5000 Ada Generation Laptop GPU, Ultra 9 185H, 2x Samsung PM9A1 1TB (RAID 0)
10548 Points +9%
Lenovo ThinkPad P16 Gen 2
NVIDIA RTX 4000 Ada Generation Laptop GPU, i7-14700HX, SK hynix PC801 HFS001TEJ9X162N
9712 Points
Усредн. модель с Intel Core i7-14700HX, NVIDIA RTX 4000 Ada Generation Laptop GPU
  ()
9712 Points 0%
HP ZBook Power 16 G11 A
NVIDIA RTX 2000 Ada Generation Laptop GPU, R7 8845HS, Samsung PM9A1 MZVL22T0HBLB
9631 Points -1%
Lenovo ThinkPad P16 G1 RTX A5500
RTX A5500 Laptop GPU, i9-12950HX, WDC PC SN810 2TB
9489 Points -2%
Lenovo ThinkPad P16 G2 21FA000FGE
NVIDIA RTX 2000 Ada Generation Laptop GPU, i7-13700HX, SK hynix PC801 HFS001TEJ9X162N
9388 Points -3%
Lenovo ThinkPad P16s G2 21K9000CGE
Radeon 780M, R7 PRO 7840U, SK hynix PC801 HFS001TEJ9X162N
8921 Points -8%
PCMark 10 / Digital Content Creation
Lenovo ThinkPad P16 Gen 2
NVIDIA RTX 4000 Ada Generation Laptop GPU, i7-14700HX, SK hynix PC801 HFS001TEJ9X162N
14598 Points
Усредн. модель с Intel Core i7-14700HX, NVIDIA RTX 4000 Ada Generation Laptop GPU
  ()
14598 Points 0%
Dell Precision 5690
NVIDIA RTX 5000 Ada Generation Laptop GPU, Ultra 9 185H, 2x Samsung PM9A1 1TB (RAID 0)
12259 Points -16%
HP ZBook Power 16 G11 A
NVIDIA RTX 2000 Ada Generation Laptop GPU, R7 8845HS, Samsung PM9A1 MZVL22T0HBLB
10807 Points -26%
Lenovo ThinkPad P16 G1 RTX A5500
RTX A5500 Laptop GPU, i9-12950HX, WDC PC SN810 2TB
9944 Points -32%
Lenovo ThinkPad P16 G2 21FA000FGE
NVIDIA RTX 2000 Ada Generation Laptop GPU, i7-13700HX, SK hynix PC801 HFS001TEJ9X162N
9633 Points -34%
Lenovo ThinkPad P16s G2 21K9000CGE
Radeon 780M, R7 PRO 7840U, SK hynix PC801 HFS001TEJ9X162N
8773 Points -40%
CrossMark / Overall
Lenovo ThinkPad P16 Gen 2
NVIDIA RTX 4000 Ada Generation Laptop GPU, i7-14700HX, SK hynix PC801 HFS001TEJ9X162N
2011 Points
Усредн. модель с Intel Core i7-14700HX, NVIDIA RTX 4000 Ada Generation Laptop GPU
  ()
2011 Points 0%
Lenovo ThinkPad P16 G1 RTX A5500
RTX A5500 Laptop GPU, i9-12950HX, WDC PC SN810 2TB
1887 Points -6%
Lenovo ThinkPad P16 G2 21FA000FGE
NVIDIA RTX 2000 Ada Generation Laptop GPU, i7-13700HX, SK hynix PC801 HFS001TEJ9X162N
1831 Points -9%
Dell Precision 5690
NVIDIA RTX 5000 Ada Generation Laptop GPU, Ultra 9 185H, 2x Samsung PM9A1 1TB (RAID 0)
1823 Points -9%
HP ZBook Power 16 G11 A
NVIDIA RTX 2000 Ada Generation Laptop GPU, R7 8845HS, Samsung PM9A1 MZVL22T0HBLB
1801 Points -10%
Lenovo ThinkPad P16s G2 21K9000CGE
Radeon 780M, R7 PRO 7840U, SK hynix PC801 HFS001TEJ9X162N
1595 Points -21%
CrossMark / Productivity
Lenovo ThinkPad P16 Gen 2
NVIDIA RTX 4000 Ada Generation Laptop GPU, i7-14700HX, SK hynix PC801 HFS001TEJ9X162N
1862 Points
Усредн. модель с Intel Core i7-14700HX, NVIDIA RTX 4000 Ada Generation Laptop GPU
  ()
1862 Points 0%
Lenovo ThinkPad P16 G1 RTX A5500
RTX A5500 Laptop GPU, i9-12950HX, WDC PC SN810 2TB
1753 Points -6%
Dell Precision 5690
NVIDIA RTX 5000 Ada Generation Laptop GPU, Ultra 9 185H, 2x Samsung PM9A1 1TB (RAID 0)
1739 Points -7%
Lenovo ThinkPad P16 G2 21FA000FGE
NVIDIA RTX 2000 Ada Generation Laptop GPU, i7-13700HX, SK hynix PC801 HFS001TEJ9X162N
1704 Points -8%
HP ZBook Power 16 G11 A
NVIDIA RTX 2000 Ada Generation Laptop GPU, R7 8845HS, Samsung PM9A1 MZVL22T0HBLB
1703 Points -9%
Lenovo ThinkPad P16s G2 21K9000CGE
Radeon 780M, R7 PRO 7840U, SK hynix PC801 HFS001TEJ9X162N
1547 Points -17%
CrossMark / Creativity
Lenovo ThinkPad P16 Gen 2
NVIDIA RTX 4000 Ada Generation Laptop GPU, i7-14700HX, SK hynix PC801 HFS001TEJ9X162N
2311 Points
Усредн. модель с Intel Core i7-14700HX, NVIDIA RTX 4000 Ada Generation Laptop GPU
  ()
2311 Points 0%
Lenovo ThinkPad P16 G1 RTX A5500
RTX A5500 Laptop GPU, i9-12950HX, WDC PC SN810 2TB
2192 Points -5%
Lenovo ThinkPad P16 G2 21FA000FGE
NVIDIA RTX 2000 Ada Generation Laptop GPU, i7-13700HX, SK hynix PC801 HFS001TEJ9X162N
2123 Points -8%
HP ZBook Power 16 G11 A
NVIDIA RTX 2000 Ada Generation Laptop GPU, R7 8845HS, Samsung PM9A1 MZVL22T0HBLB
2056 Points -11%
Dell Precision 5690
NVIDIA RTX 5000 Ada Generation Laptop GPU, Ultra 9 185H, 2x Samsung PM9A1 1TB (RAID 0)
2025 Points -12%
Lenovo ThinkPad P16s G2 21K9000CGE
Radeon 780M, R7 PRO 7840U, SK hynix PC801 HFS001TEJ9X162N
1738 Points -25%
CrossMark / Responsiveness
Lenovo ThinkPad P16 Gen 2
NVIDIA RTX 4000 Ada Generation Laptop GPU, i7-14700HX, SK hynix PC801 HFS001TEJ9X162N
1666 Points
Усредн. модель с Intel Core i7-14700HX, NVIDIA RTX 4000 Ada Generation Laptop GPU
  ()
1666 Points 0%
Dell Precision 5690
NVIDIA RTX 5000 Ada Generation Laptop GPU, Ultra 9 185H, 2x Samsung PM9A1 1TB (RAID 0)
1533 Points -8%
Lenovo ThinkPad P16 G1 RTX A5500
RTX A5500 Laptop GPU, i9-12950HX, WDC PC SN810 2TB
1501 Points -10%
Lenovo ThinkPad P16 G2 21FA000FGE
NVIDIA RTX 2000 Ada Generation Laptop GPU, i7-13700HX, SK hynix PC801 HFS001TEJ9X162N
1457 Points -13%
HP ZBook Power 16 G11 A
NVIDIA RTX 2000 Ada Generation Laptop GPU, R7 8845HS, Samsung PM9A1 MZVL22T0HBLB
1434 Points -14%
Lenovo ThinkPad P16s G2 21K9000CGE
Radeon 780M, R7 PRO 7840U, SK hynix PC801 HFS001TEJ9X162N
1353 Points -19%
WebXPRT 3 / Overall
Lenovo ThinkPad P16 Gen 2
NVIDIA RTX 4000 Ada Generation Laptop GPU, i7-14700HX, SK hynix PC801 HFS001TEJ9X162N
338 Points
Усредн. модель с Intel Core i7-14700HX, NVIDIA RTX 4000 Ada Generation Laptop GPU
  ()
338 Points 0%
Lenovo ThinkPad P16 G2 21FA000FGE
NVIDIA RTX 2000 Ada Generation Laptop GPU, i7-13700HX, SK hynix PC801 HFS001TEJ9X162N
324 Points -4%
Lenovo ThinkPad P16 G1 RTX A5500
RTX A5500 Laptop GPU, i9-12950HX, WDC PC SN810 2TB
314 Points -7%
HP ZBook Power 16 G11 A
NVIDIA RTX 2000 Ada Generation Laptop GPU, R7 8845HS, Samsung PM9A1 MZVL22T0HBLB
306 Points -9%
Dell Precision 5690
NVIDIA RTX 5000 Ada Generation Laptop GPU, Ultra 9 185H, 2x Samsung PM9A1 1TB (RAID 0)
293 Points -13%
Lenovo ThinkPad P16s G2 21K9000CGE
Radeon 780M, R7 PRO 7840U, SK hynix PC801 HFS001TEJ9X162N
259 Points -23%
WebXPRT 4 / Overall
Lenovo ThinkPad P16 Gen 2
NVIDIA RTX 4000 Ada Generation Laptop GPU, i7-14700HX, SK hynix PC801 HFS001TEJ9X162N
302 Points
Усредн. модель с Intel Core i7-14700HX, NVIDIA RTX 4000 Ada Generation Laptop GPU
  ()
302 Points 0%
Lenovo ThinkPad P16 G1 RTX A5500
RTX A5500 Laptop GPU, i9-12950HX, WDC PC SN810 2TB
275 Points -9%
Dell Precision 5690
NVIDIA RTX 5000 Ada Generation Laptop GPU, Ultra 9 185H, 2x Samsung PM9A1 1TB (RAID 0)
269 Points -11%
HP ZBook Power 16 G11 A
NVIDIA RTX 2000 Ada Generation Laptop GPU, R7 8845HS, Samsung PM9A1 MZVL22T0HBLB
250 Points -17%
Mozilla Kraken 1.1 / Total
Lenovo ThinkPad P16s G2 21K9000CGE
Radeon 780M, R7 PRO 7840U, SK hynix PC801 HFS001TEJ9X162N
562 ms * -24%
HP ZBook Power 16 G11 A
NVIDIA RTX 2000 Ada Generation Laptop GPU, R7 8845HS, Samsung PM9A1 MZVL22T0HBLB
538 ms * -19%
Dell Precision 5690
NVIDIA RTX 5000 Ada Generation Laptop GPU, Ultra 9 185H, 2x Samsung PM9A1 1TB (RAID 0)
506 ms * -11%
Lenovo ThinkPad P16 G1 RTX A5500
RTX A5500 Laptop GPU, i9-12950HX, WDC PC SN810 2TB
505 ms * -11%
Lenovo ThinkPad P16 G2 21FA000FGE
NVIDIA RTX 2000 Ada Generation Laptop GPU, i7-13700HX, SK hynix PC801 HFS001TEJ9X162N
489 ms * -8%
Lenovo ThinkPad P16 Gen 2
NVIDIA RTX 4000 Ada Generation Laptop GPU, i7-14700HX, SK hynix PC801 HFS001TEJ9X162N
454 ms *
Усредн. модель с Intel Core i7-14700HX, NVIDIA RTX 4000 Ada Generation Laptop GPU
  ()
454 ms * -0%

* ... меньше = лучше

PCMark 10 Score
8353 баллов
?
AIDA64 / Memory Copy
Dell Precision 5690
Intel Core Ultra 9 185H, NVIDIA RTX 5000 Ada Generation Laptop GPU
91273 MB/s +43%
Усредн. модель с Intel Core i7-14700HX
  (63949 - 78742, n=7)
71165 MB/s +11%
Lenovo ThinkPad P16s G2 21K9000CGE
AMD Ryzen 7 PRO 7840U, Radeon 780M
67037 MB/s +5%
Lenovo ThinkPad P16 Gen 2
Intel Core i7-14700HX, NVIDIA RTX 4000 Ada Generation Laptop GPU
63949 MB/s
Lenovo ThinkPad P16 G1 RTX A5500
Intel Core i9-12950HX, RTX A5500 Laptop GPU
62989 MB/s -2%
HP ZBook Power 16 G11 A
AMD Ryzen 7 8845HS, NVIDIA RTX 2000 Ada Generation Laptop GPU
61459 MB/s -4%
Lenovo ThinkPad P16 G2 21FA000FGE
Intel Core i7-13700HX, NVIDIA RTX 2000 Ada Generation Laptop GPU
56335 MB/s -12%
AIDA64 / Memory Read
Dell Precision 5690
Intel Core Ultra 9 185H, NVIDIA RTX 5000 Ada Generation Laptop GPU
86584 MB/s +26%
Усредн. модель с Intel Core i7-14700HX
  (68593 - 86175, n=7)
81347 MB/s +19%
Lenovo ThinkPad P16 Gen 2
Intel Core i7-14700HX, NVIDIA RTX 4000 Ada Generation Laptop GPU
68593 MB/s
Lenovo ThinkPad P16 G1 RTX A5500
Intel Core i9-12950HX, RTX A5500 Laptop GPU
63098 MB/s -8%
HP ZBook Power 16 G11 A
AMD Ryzen 7 8845HS, NVIDIA RTX 2000 Ada Generation Laptop GPU
60846 MB/s -11%
Lenovo ThinkPad P16 G2 21FA000FGE
Intel Core i7-13700HX, NVIDIA RTX 2000 Ada Generation Laptop GPU
57623 MB/s -16%
Lenovo ThinkPad P16s G2 21K9000CGE
AMD Ryzen 7 PRO 7840U, Radeon 780M
50376 MB/s -27%
AIDA64 / Memory Write
Lenovo ThinkPad P16s G2 21K9000CGE
AMD Ryzen 7 PRO 7840U, Radeon 780M
89477 MB/s +40%
HP ZBook Power 16 G11 A
AMD Ryzen 7 8845HS, NVIDIA RTX 2000 Ada Generation Laptop GPU
82796 MB/s +29%
Dell Precision 5690
Intel Core Ultra 9 185H, NVIDIA RTX 5000 Ada Generation Laptop GPU
73682 MB/s +15%
Усредн. модель с Intel Core i7-14700HX
  (64033 - 76689, n=7)
68661 MB/s +7%
Lenovo ThinkPad P16 Gen 2
Intel Core i7-14700HX, NVIDIA RTX 4000 Ada Generation Laptop GPU
64057 MB/s
Lenovo ThinkPad P16 G1 RTX A5500
Intel Core i9-12950HX, RTX A5500 Laptop GPU
60448 MB/s -6%
Lenovo ThinkPad P16 G2 21FA000FGE
Intel Core i7-13700HX, NVIDIA RTX 2000 Ada Generation Laptop GPU
57477 MB/s -10%
AIDA64 / Memory Latency
Dell Precision 5690
Intel Core Ultra 9 185H, NVIDIA RTX 5000 Ada Generation Laptop GPU
140.8 ns * -52%
Lenovo ThinkPad P16s G2 21K9000CGE
AMD Ryzen 7 PRO 7840U, Radeon 780M
133.4 ns * -44%
Lenovo ThinkPad P16 G2 21FA000FGE
Intel Core i7-13700HX, NVIDIA RTX 2000 Ada Generation Laptop GPU
97.9 ns * -5%
HP ZBook Power 16 G11 A
AMD Ryzen 7 8845HS, NVIDIA RTX 2000 Ada Generation Laptop GPU
97.8 ns * -5%
Lenovo ThinkPad P16 Gen 2
Intel Core i7-14700HX, NVIDIA RTX 4000 Ada Generation Laptop GPU
92.9 ns *
Lenovo ThinkPad P16 G1 RTX A5500
Intel Core i9-12950HX, RTX A5500 Laptop GPU
91.1 ns * +2%
Усредн. модель с Intel Core i7-14700HX
  (82.7 - 96.4, n=7)
89.3 ns * +4%

* ... меньше = лучше

Задержка DPC

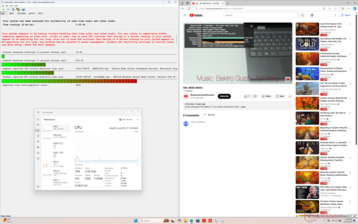
LatencyMon выявляет небольшие проблемы с DPC при запуске открытия нескольких вкладок браузера на нашей домашней странице. воспроизведение 4K-видео при 60 FPS в остальном идеально, не зафиксировано ни одного выпавшего кадра.

LatencyMon
LatencyMon
Список драйверов
Список драйверов
DPC Latencies / LatencyMon - interrupt to process latency (max), Web, Youtube, Prime95
HP ZBook Power 16 G11 A
NVIDIA RTX 2000 Ada Generation Laptop GPU, R7 8845HS, Samsung PM9A1 MZVL22T0HBLB
6934.9 μs * -696%
Lenovo ThinkPad P16 G1 RTX A5500
RTX A5500 Laptop GPU, i9-12950HX, WDC PC SN810 2TB
1557.2 μs * -79%
Lenovo ThinkPad P16s G2 21K9000CGE
Radeon 780M, R7 PRO 7840U, SK hynix PC801 HFS001TEJ9X162N
1512 μs * -74%
Lenovo ThinkPad P16 G2 21FA000FGE
NVIDIA RTX 2000 Ada Generation Laptop GPU, i7-13700HX, SK hynix PC801 HFS001TEJ9X162N
1004.2 μs * -15%
Lenovo ThinkPad P16 Gen 2
NVIDIA RTX 4000 Ada Generation Laptop GPU, i7-14700HX, SK hynix PC801 HFS001TEJ9X162N
871.3 μs *
Dell Precision 5690
NVIDIA RTX 5000 Ada Generation Laptop GPU, Ultra 9 185H, 2x Samsung PM9A1 1TB (RAID 0)
505.5 μs * +42%

* ... меньше = лучше

Накопитель

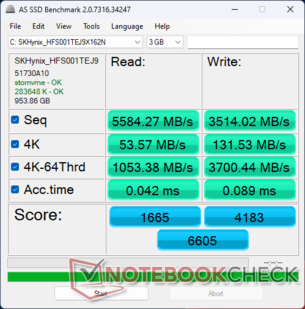
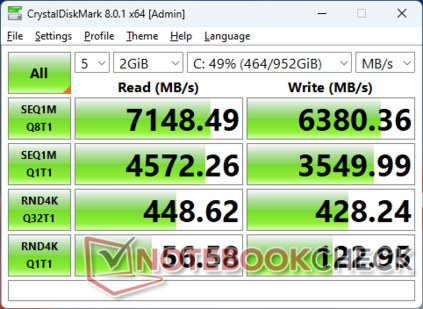
Между двумя нашими тестовыми устройствами ThinkPad P16 Gen 2 не было замечено никаких изменений в вариантах хранения данных или производительности SSD.

AS SSD
AS SSD
CDM 8
CDM 8
SK hynix PC801 HFS001TEJ9X162N
CDM 5/6 Read Seq Q32T1: 7042 MB/s
CDM 5/6 Write Seq Q32T1: 6026 MB/s
CDM 5/6 Read 4K Q32T1: 447.8 MB/s
CDM 5/6 Write 4K Q32T1: 411.8 MB/s
CDM 5 Read Seq: 4479 MB/s
CDM 5 Write Seq: 3539 MB/s
CDM 5/6 Read 4K: 56.84 MB/s
CDM 5/6 Write 4K: 123.5 MB/s
Drive Performance Rating - Percent
Dell Precision 5690
2x Samsung PM9A1 1TB (RAID 0)
79.9 pt
Lenovo ThinkPad P16 Gen 2
SK hynix PC801 HFS001TEJ9X162N
73.5 pt
Lenovo ThinkPad P16s G2 21K9000CGE
SK hynix PC801 HFS001TEJ9X162N
69 pt
Lenovo ThinkPad P16 G2 21FA000FGE
SK hynix PC801 HFS001TEJ9X162N
68.1 pt
Lenovo ThinkPad P16 G1 RTX A5500
WDC PC SN810 2TB
63.9 pt
HP ZBook Power 16 G11 A
Samsung PM9A1 MZVL22T0HBLB
62.4 pt
DiskSpd
seq read
Dell Precision 5690
2x Samsung PM9A1 1TB (RAID 0)
5715 (5635.1min - 5715.37max) MB/s +21%
Lenovo ThinkPad P16 Gen 2
SK hynix PC801 HFS001TEJ9X162N
4711 (4656.22min - 4710.62max) MB/s
Lenovo ThinkPad P16 G2 21FA000FGE
SK hynix PC801 HFS001TEJ9X162N
4658 (4604.53min - 4657.77max) MB/s -1%
HP ZBook Power 16 G11 A
Samsung PM9A1 MZVL22T0HBLB
3644 (3570.81min - 3643.75max) MB/s -23%
Lenovo ThinkPad P16 G1 RTX A5500
WDC PC SN810 2TB
3246 (3140.9min - 3245.75max) MB/s -31%
Lenovo ThinkPad P16s G2 21K9000CGE
SK hynix PC801 HFS001TEJ9X162N
2924 (2891.55min - 2924.29max) MB/s -38%
seq write
Dell Precision 5690
2x Samsung PM9A1 1TB (RAID 0)
7289 (7243.34min - 7289.49max) MB/s +99%
Lenovo ThinkPad P16 G1 RTX A5500
WDC PC SN810 2TB
3699 (3633.03min - 3698.96max) MB/s +1%
Lenovo ThinkPad P16 Gen 2
SK hynix PC801 HFS001TEJ9X162N
3656 (3577.09min - 3655.76max) MB/s
Lenovo ThinkPad P16 G2 21FA000FGE
SK hynix PC801 HFS001TEJ9X162N
3564 (3288.75min - 3564.11max) MB/s -3%
Lenovo ThinkPad P16s G2 21K9000CGE
SK hynix PC801 HFS001TEJ9X162N
3534 (3429.26min - 3534.33max) MB/s -3%
HP ZBook Power 16 G11 A
Samsung PM9A1 MZVL22T0HBLB
3175 (3093.4min - 3174.82max) MB/s -13%
seq q8 t1 read
Dell Precision 5690
2x Samsung PM9A1 1TB (RAID 0)
12631 (9772.1min - 12631.4max) MB/s +77%
Lenovo ThinkPad P16 G2 21FA000FGE
SK hynix PC801 HFS001TEJ9X162N
7157 (6238.19min - 7156.53max) MB/s 0%
Lenovo ThinkPad P16 Gen 2
SK hynix PC801 HFS001TEJ9X162N
7128 (6247min - 7128.22max) MB/s
Lenovo ThinkPad P16 G1 RTX A5500
WDC PC SN810 2TB
6937 (6186.81min - 6937.14max) MB/s -3%
Lenovo ThinkPad P16s G2 21K9000CGE
SK hynix PC801 HFS001TEJ9X162N
6832 (5516.98min - 6832.31max) MB/s -4%
HP ZBook Power 16 G11 A
Samsung PM9A1 MZVL22T0HBLB
6678 (5488.25min - 6677.75max) MB/s -6%
seq q8 t1 write
Dell Precision 5690
2x Samsung PM9A1 1TB (RAID 0)
9890 (9840.5min - 9889.75max) MB/s +61%
Lenovo ThinkPad P16 Gen 2
SK hynix PC801 HFS001TEJ9X162N
6142 (6116.97min - 6142.14max) MB/s
Lenovo ThinkPad P16 G2 21FA000FGE
SK hynix PC801 HFS001TEJ9X162N
6125 (6104.39min - 6125.07max) MB/s 0%
Lenovo ThinkPad P16s G2 21K9000CGE
SK hynix PC801 HFS001TEJ9X162N
6044 (6015.89min - 6043.71max) MB/s -2%
HP ZBook Power 16 G11 A
Samsung PM9A1 MZVL22T0HBLB
4934 (4919.71min - 4933.54max) MB/s -20%
Lenovo ThinkPad P16 G1 RTX A5500
WDC PC SN810 2TB
4698 (4612.9min - 4698.46max) MB/s -24%
4k q1 t1 read
Dell Precision 5690
2x Samsung PM9A1 1TB (RAID 0)
73.6 (72.71min - 73.64max) MB/s +28%
Lenovo ThinkPad P16s G2 21K9000CGE
SK hynix PC801 HFS001TEJ9X162N
61.4 (59.78min - 61.38max) MB/s +7%
HP ZBook Power 16 G11 A
Samsung PM9A1 MZVL22T0HBLB
61.2 (60.7min - 61.15max) MB/s +7%
Lenovo ThinkPad P16 Gen 2
SK hynix PC801 HFS001TEJ9X162N
57.4 (55.8min - 57.43max) MB/s
Lenovo ThinkPad P16 G2 21FA000FGE
SK hynix PC801 HFS001TEJ9X162N
55.2 (54.95min - 55.23max) MB/s -4%
Lenovo ThinkPad P16 G1 RTX A5500
WDC PC SN810 2TB
52.4 (50.01min - 52.36max) MB/s -9%
4k q1 t1 write
Lenovo ThinkPad P16s G2 21K9000CGE
SK hynix PC801 HFS001TEJ9X162N
154.3 (148.14min - 154.33max) MB/s +17%
Dell Precision 5690
2x Samsung PM9A1 1TB (RAID 0)
152.4 (152.02min - 152.36max) MB/s +15%
Lenovo ThinkPad P16 Gen 2
SK hynix PC801 HFS001TEJ9X162N
132.1 (131.13min - 132.07max) MB/s
Lenovo ThinkPad P16 G2 21FA000FGE
SK hynix PC801 HFS001TEJ9X162N
122.2 (121.67min - 122.17max) MB/s -7%
HP ZBook Power 16 G11 A
Samsung PM9A1 MZVL22T0HBLB
121.7 (119min - 121.74max) MB/s -8%
Lenovo ThinkPad P16 G1 RTX A5500
WDC PC SN810 2TB
120.2 (118.57min - 120.21max) MB/s -9%
4k q32 t16 read
Dell Precision 5690
2x Samsung PM9A1 1TB (RAID 0)
1184 (1095.52min - 1183.72max) MB/s +15%
Lenovo ThinkPad P16 Gen 2
SK hynix PC801 HFS001TEJ9X162N
1031 (989.65min - 1031.49max) MB/s
Lenovo ThinkPad P16s G2 21K9000CGE
SK hynix PC801 HFS001TEJ9X162N
994 (942.37min - 993.94max) MB/s -4%
HP ZBook Power 16 G11 A
Samsung PM9A1 MZVL22T0HBLB
979 (948.82min - 979.35max) MB/s -5%
Lenovo ThinkPad P16 G1 RTX A5500
WDC PC SN810 2TB
974 (906.61min - 973.6max) MB/s -6%
Lenovo ThinkPad P16 G2 21FA000FGE
SK hynix PC801 HFS001TEJ9X162N
909 (877.94min - 908.91max) MB/s -12%
4k q32 t16 write
Dell Precision 5690
2x Samsung PM9A1 1TB (RAID 0)
1146 (1126.09min - 1146.07max) MB/s +141%
Lenovo ThinkPad P16 Gen 2
SK hynix PC801 HFS001TEJ9X162N
476 (469.39min - 476.35max) MB/s
Lenovo ThinkPad P16s G2 21K9000CGE
SK hynix PC801 HFS001TEJ9X162N
462 (369.87min - 462.23max) MB/s -3%
Lenovo ThinkPad P16 G2 21FA000FGE
SK hynix PC801 HFS001TEJ9X162N
457 (451.72min - 456.57max) MB/s -4%
HP ZBook Power 16 G11 A
Samsung PM9A1 MZVL22T0HBLB
416 (395.93min - 415.86max) MB/s -13%
Lenovo ThinkPad P16 G1 RTX A5500
WDC PC SN810 2TB
404 (395.96min - 403.78max) MB/s -15%
AS SSD
Score Total
Lenovo ThinkPad P16 Gen 2
SK hynix PC801 HFS001TEJ9X162N
6605 Points
Lenovo ThinkPad P16 G2 21FA000FGE
SK hynix PC801 HFS001TEJ9X162N
5943 Points -10%
Lenovo ThinkPad P16s G2 21K9000CGE
SK hynix PC801 HFS001TEJ9X162N
5604 Points -15%
Lenovo ThinkPad P16 G1 RTX A5500
WDC PC SN810 2TB
5363 Points -19%
HP ZBook Power 16 G11 A
Samsung PM9A1 MZVL22T0HBLB
5091 Points -23%
Dell Precision 5690
2x Samsung PM9A1 1TB (RAID 0)
4034 Points -39%
Score Read
Lenovo ThinkPad P16 Gen 2
SK hynix PC801 HFS001TEJ9X162N
1665 Points
Dell Precision 5690
2x Samsung PM9A1 1TB (RAID 0)
1643 Points -1%
Lenovo ThinkPad P16 G1 RTX A5500
WDC PC SN810 2TB
1635 Points -2%
Lenovo ThinkPad P16 G2 21FA000FGE
SK hynix PC801 HFS001TEJ9X162N
1490 Points -11%
HP ZBook Power 16 G11 A
Samsung PM9A1 MZVL22T0HBLB
1270 Points -24%
Lenovo ThinkPad P16s G2 21K9000CGE
SK hynix PC801 HFS001TEJ9X162N
1162 Points -30%
Score Write
Lenovo ThinkPad P16 Gen 2
SK hynix PC801 HFS001TEJ9X162N
4183 Points
Lenovo ThinkPad P16s G2 21K9000CGE
SK hynix PC801 HFS001TEJ9X162N
3969 Points -5%
Lenovo ThinkPad P16 G2 21FA000FGE
SK hynix PC801 HFS001TEJ9X162N
3831 Points -8%
HP ZBook Power 16 G11 A
Samsung PM9A1 MZVL22T0HBLB
3265 Points -22%
Lenovo ThinkPad P16 G1 RTX A5500
WDC PC SN810 2TB
3012 Points -28%
Dell Precision 5690
2x Samsung PM9A1 1TB (RAID 0)
1606 Points -62%
Seq Read
Dell Precision 5690
2x Samsung PM9A1 1TB (RAID 0)
7244.14 MB/s +30%
Lenovo ThinkPad P16 Gen 2
SK hynix PC801 HFS001TEJ9X162N
5584.27 MB/s
Lenovo ThinkPad P16 G1 RTX A5500
WDC PC SN810 2TB
5466.21 MB/s -2%
Lenovo ThinkPad P16 G2 21FA000FGE
SK hynix PC801 HFS001TEJ9X162N
4939 MB/s -12%
Lenovo ThinkPad P16s G2 21K9000CGE
SK hynix PC801 HFS001TEJ9X162N
4618 MB/s -17%
HP ZBook Power 16 G11 A
Samsung PM9A1 MZVL22T0HBLB
4129.7 MB/s -26%
Seq Write
Dell Precision 5690
2x Samsung PM9A1 1TB (RAID 0)
5881.98 MB/s +67%
Lenovo ThinkPad P16 Gen 2
SK hynix PC801 HFS001TEJ9X162N
3514.02 MB/s
Lenovo ThinkPad P16 G1 RTX A5500
WDC PC SN810 2TB
2923.75 MB/s -17%
Lenovo ThinkPad P16 G2 21FA000FGE
SK hynix PC801 HFS001TEJ9X162N
2028 MB/s -42%
Lenovo ThinkPad P16s G2 21K9000CGE
SK hynix PC801 HFS001TEJ9X162N
1972 MB/s -44%
HP ZBook Power 16 G11 A
Samsung PM9A1 MZVL22T0HBLB
1963.71 MB/s -44%
4K Read
Dell Precision 5690
2x Samsung PM9A1 1TB (RAID 0)
63.22 MB/s +18%
HP ZBook Power 16 G11 A
Samsung PM9A1 MZVL22T0HBLB
58.68 MB/s +10%
Lenovo ThinkPad P16 Gen 2
SK hynix PC801 HFS001TEJ9X162N
53.57 MB/s
Lenovo ThinkPad P16 G1 RTX A5500
WDC PC SN810 2TB
51.25 MB/s -4%
Lenovo ThinkPad P16s G2 21K9000CGE
SK hynix PC801 HFS001TEJ9X162N
50.4 MB/s -6%
Lenovo ThinkPad P16 G2 21FA000FGE
SK hynix PC801 HFS001TEJ9X162N
46.6 MB/s -13%
4K Write
Lenovo ThinkPad P16s G2 21K9000CGE
SK hynix PC801 HFS001TEJ9X162N
145.8 MB/s +11%
Dell Precision 5690
2x Samsung PM9A1 1TB (RAID 0)
138.37 MB/s +5%
HP ZBook Power 16 G11 A
Samsung PM9A1 MZVL22T0HBLB
131.67 MB/s 0%
Lenovo ThinkPad P16 Gen 2
SK hynix PC801 HFS001TEJ9X162N
131.53 MB/s
Lenovo ThinkPad P16 G1 RTX A5500
WDC PC SN810 2TB
128 MB/s -3%
Lenovo ThinkPad P16 G2 21FA000FGE
SK hynix PC801 HFS001TEJ9X162N
113.7 MB/s -14%
4K-64 Read
Lenovo ThinkPad P16 Gen 2
SK hynix PC801 HFS001TEJ9X162N
1053.38 MB/s
Lenovo ThinkPad P16 G1 RTX A5500
WDC PC SN810 2TB
1037.42 MB/s -2%
Lenovo ThinkPad P16 G2 21FA000FGE
SK hynix PC801 HFS001TEJ9X162N
949 MB/s -10%
Dell Precision 5690
2x Samsung PM9A1 1TB (RAID 0)
855.44 MB/s -19%
HP ZBook Power 16 G11 A
Samsung PM9A1 MZVL22T0HBLB
798.48 MB/s -24%
Lenovo ThinkPad P16s G2 21K9000CGE
SK hynix PC801 HFS001TEJ9X162N
649 MB/s -38%
4K-64 Write
Lenovo ThinkPad P16 Gen 2
SK hynix PC801 HFS001TEJ9X162N
3700.44 MB/s
Lenovo ThinkPad P16s G2 21K9000CGE
SK hynix PC801 HFS001TEJ9X162N
3626 MB/s -2%
Lenovo ThinkPad P16 G2 21FA000FGE
SK hynix PC801 HFS001TEJ9X162N
3514 MB/s -5%
HP ZBook Power 16 G11 A
Samsung PM9A1 MZVL22T0HBLB
2936.77 MB/s -21%
Lenovo ThinkPad P16 G1 RTX A5500
WDC PC SN810 2TB
2591.53 MB/s -30%
Dell Precision 5690
2x Samsung PM9A1 1TB (RAID 0)
879.16 MB/s -76%
Access Time Read
Lenovo ThinkPad P16 G2 21FA000FGE
SK hynix PC801 HFS001TEJ9X162N
0.067 ms * -60%
Dell Precision 5690
2x Samsung PM9A1 1TB (RAID 0)
0.055 ms * -31%
Lenovo ThinkPad P16 G1 RTX A5500
WDC PC SN810 2TB
0.051 ms * -21%
Lenovo ThinkPad P16s G2 21K9000CGE
SK hynix PC801 HFS001TEJ9X162N
0.05 ms * -19%
HP ZBook Power 16 G11 A
Samsung PM9A1 MZVL22T0HBLB
0.044 ms * -5%
Lenovo ThinkPad P16 Gen 2
SK hynix PC801 HFS001TEJ9X162N
0.042 ms *
Access Time Write
Lenovo ThinkPad P16 G1 RTX A5500
WDC PC SN810 2TB
0.092 ms * -3%
HP ZBook Power 16 G11 A
Samsung PM9A1 MZVL22T0HBLB
0.092 ms * -3%
Lenovo ThinkPad P16 Gen 2
SK hynix PC801 HFS001TEJ9X162N
0.089 ms *
Dell Precision 5690
2x Samsung PM9A1 1TB (RAID 0)
0.088 ms * +1%
Lenovo ThinkPad P16 G2 21FA000FGE
SK hynix PC801 HFS001TEJ9X162N
0.034 ms * +62%
Lenovo ThinkPad P16s G2 21K9000CGE
SK hynix PC801 HFS001TEJ9X162N
0.021 ms * +76%

* ... меньше = лучше

Чтение в DiskSpd, Глубина запроса 8

036072010801440180021602520288032403600396043204680504054005760612064806840Tooltip
Lenovo ThinkPad P16 Gen 2 SK hynix PC801 HFS001TEJ9X162N; diskspd 2.0.17 f: Ø7107 (6556.84-7133.25)
Lenovo ThinkPad P16 G2 21FA000FGE SK hynix PC801 HFS001TEJ9X162N; diskspd 2.0.17 f: Ø7136 (6304.27-7156.11)

Видеокарта

130 Вт RTX 4000 Ada в нашем Lenovo очень мощная для мобильного GPU, опережающая даже 95 Вт RTX 5000 Ada в Precision 5690 со значительным отрывом. результаты 3DMark, например, выше от 10 до 40 процентов, и аналогичные результаты можно получить при выполнении SpecViewPerf.

Профиль мощностиГрафический баллФизический профильКомбинированный балл
Режим производительности401793053414840
Сбалансированный режим32889 (-18%)29923 (-2%)13007 (-12%)
Батарейный режим23401 (-42%)27793 (-9%)8510 (-42%)

Переход в режим "Сбалансированный" из режима "Производительность" несколько сильнее влияет на производительность графики, как показано в нашей таблице результатов Fire Strike выше.

3DMark 11
3DMark 11
Fire Strike
Fire Strike
Time Spy
Time Spy
Порт-Ройал
Порт-Ройал
Скоростной путь
Скоростной путь
Стальной кочевник
Стальной кочевник
3DMark Performance Rating - Percent
Lenovo ThinkPad P16 Gen 2 -3!
NVIDIA RTX 4000 Ada Generation Laptop GPU, Intel Core i7-14700HX
97.9 pt
Усредн. модель с NVIDIA RTX 4000 Ada Generation Laptop GPU -3!
 
97.9 pt
Dell Precision 5690 -3!
NVIDIA RTX 5000 Ada Generation Laptop GPU, Intel Core Ultra 9 185H
85.5 pt
HP ZBook Fury 16 G11
NVIDIA RTX 3500 Ada Generation Laptop GPU, Intel Core i9-14900HX
81.7 pt
HP ZBook Fury 16 G9 -3!
NVIDIA RTX A5500 Laptop GPU, Intel Core i9-12950HX
62 pt
Dell Precision 5000 5490 -3!
NVIDIA RTX 3000 Ada Generation Laptop GPU, Intel Core Ultra 9 185H
56.2 pt
MSI CreatorPro Z16P B12UKST -19!
NVIDIA RTX A3000 Laptop GPU, Intel Core i7-12700H
52.3 pt
HP ZBook Power 15 G10 -11!
NVIDIA RTX 2000 Ada Generation Laptop GPU, AMD Ryzen 7 PRO 7840HS
49.5 pt
Asus ExpertBook B6 Flip B6602FC2 -19!
NVIDIA RTX A2000 Laptop GPU, Intel Core i9-12950HX
44.2 pt
Lenovo ThinkPad P16v G1 AMD -18!
NVIDIA RTX A1000 Laptop GPU, AMD Ryzen 7 PRO 7840HS
37.5 pt
Lenovo ThinkPad P1 G4-20Y4Z9DVUS -19!
NVIDIA T1200 Laptop GPU, Intel Core i7-11800H
29.7 pt
Lenovo ThinkPad P16s G2 21K9000CGE -19!
AMD Radeon 780M, AMD Ryzen 7 PRO 7840U
24 pt
HP ZBook Firefly 16 G9-6B897EA -19!
NVIDIA T550 Laptop GPU, Intel Core i7-1265U
18.2 pt
3DMark 11 - 1280x720 Performance GPU
Lenovo ThinkPad P16 Gen 2
NVIDIA RTX 4000 Ada Generation Laptop GPU, Intel Core i7-14700HX
54921 Points
Усредн. модель с NVIDIA RTX 4000 Ada Generation Laptop GPU
  ()
54921 Points 0%
Dell Precision 5690
NVIDIA RTX 5000 Ada Generation Laptop GPU, Intel Core Ultra 9 185H
49833 Points -9%
HP ZBook Fury 16 G11
NVIDIA RTX 3500 Ada Generation Laptop GPU, Intel Core i9-14900HX
41630 Points -24%
HP ZBook Fury 16 G9
NVIDIA RTX A5500 Laptop GPU, Intel Core i9-12950HX
33715 Points -39%
Dell Precision 5000 5490
NVIDIA RTX 3000 Ada Generation Laptop GPU, Intel Core Ultra 9 185H
28283 Points -49%
HP ZBook Power 15 G10
NVIDIA RTX 2000 Ada Generation Laptop GPU, AMD Ryzen 7 PRO 7840HS
26968 Points -51%
MSI CreatorPro Z16P B12UKST
NVIDIA RTX A3000 Laptop GPU, Intel Core i7-12700H
25990 Points -53%
Asus ExpertBook B6 Flip B6602FC2
NVIDIA RTX A2000 Laptop GPU, Intel Core i9-12950HX
19823 Points -64%
Lenovo ThinkPad P16v G1 AMD
NVIDIA RTX A1000 Laptop GPU, AMD Ryzen 7 PRO 7840HS
15867 Points -71%
Lenovo ThinkPad P1 G4-20Y4Z9DVUS
NVIDIA T1200 Laptop GPU, Intel Core i7-11800H
14387 Points -74%
Lenovo ThinkPad P16s G2 21K9000CGE
AMD Radeon 780M, AMD Ryzen 7 PRO 7840U
12885 Points -77%
HP ZBook Firefly 16 G9-6B897EA
NVIDIA T550 Laptop GPU, Intel Core i7-1265U
7432 Points -86%
3DMark
1920x1080 Fire Strike Graphics
Lenovo ThinkPad P16 Gen 2
NVIDIA RTX 4000 Ada Generation Laptop GPU, Intel Core i7-14700HX
40179 Points
Усредн. модель с NVIDIA RTX 4000 Ada Generation Laptop GPU
  ()
40179 Points 0%
Dell Precision 5690
NVIDIA RTX 5000 Ada Generation Laptop GPU, Intel Core Ultra 9 185H
29664 Points -26%
HP ZBook Fury 16 G11
NVIDIA RTX 3500 Ada Generation Laptop GPU, Intel Core i9-14900HX
29248 Points -27%
HP ZBook Fury 16 G9
NVIDIA RTX A5500 Laptop GPU, Intel Core i9-12950HX
25713 Points -36%
HP ZBook Power 15 G10
NVIDIA RTX 2000 Ada Generation Laptop GPU, AMD Ryzen 7 PRO 7840HS
20340 Points -49%
Dell Precision 5000 5490
NVIDIA RTX 3000 Ada Generation Laptop GPU, Intel Core Ultra 9 185H
20233 Points -50%
MSI CreatorPro Z16P B12UKST
NVIDIA RTX A3000 Laptop GPU, Intel Core i7-12700H
19710 Points -51%
Asus ExpertBook B6 Flip B6602FC2
NVIDIA RTX A2000 Laptop GPU, Intel Core i9-12950HX
15988 Points -60%
Lenovo ThinkPad P16v G1 AMD
NVIDIA RTX A1000 Laptop GPU, AMD Ryzen 7 PRO 7840HS
11728 Points -71%
Lenovo ThinkPad P1 G4-20Y4Z9DVUS
NVIDIA T1200 Laptop GPU, Intel Core i7-11800H
10134 Points -75%
Lenovo ThinkPad P16s G2 21K9000CGE
AMD Radeon 780M, AMD Ryzen 7 PRO 7840U
8142 Points -80%
HP ZBook Firefly 16 G9-6B897EA
NVIDIA T550 Laptop GPU, Intel Core i7-1265U
4890 Points -88%
2560x1440 Time Spy Graphics
Lenovo ThinkPad P16 Gen 2
NVIDIA RTX 4000 Ada Generation Laptop GPU, Intel Core i7-14700HX
16308 Points
Усредн. модель с NVIDIA RTX 4000 Ada Generation Laptop GPU
  ()
16308 Points 0%
Dell Precision 5690
NVIDIA RTX 5000 Ada Generation Laptop GPU, Intel Core Ultra 9 185H
14472 Points -11%
HP ZBook Fury 16 G11
NVIDIA RTX 3500 Ada Generation Laptop GPU, Intel Core i9-14900HX
12806 Points -21%
HP ZBook Fury 16 G9
NVIDIA RTX A5500 Laptop GPU, Intel Core i9-12950HX
8940 Points -45%
Dell Precision 5000 5490
NVIDIA RTX 3000 Ada Generation Laptop GPU, Intel Core Ultra 9 185H
7959 Points -51%
HP ZBook Power 15 G10
NVIDIA RTX 2000 Ada Generation Laptop GPU, AMD Ryzen 7 PRO 7840HS
7410 Points -55%
MSI CreatorPro Z16P B12UKST
NVIDIA RTX A3000 Laptop GPU, Intel Core i7-12700H
7320 Points -55%
Asus ExpertBook B6 Flip B6602FC2
NVIDIA RTX A2000 Laptop GPU, Intel Core i9-12950HX
6108 Points -63%
Lenovo ThinkPad P16v G1 AMD
NVIDIA RTX A1000 Laptop GPU, AMD Ryzen 7 PRO 7840HS
4410 Points -73%
Lenovo ThinkPad P1 G4-20Y4Z9DVUS
NVIDIA T1200 Laptop GPU, Intel Core i7-11800H
3595 Points -78%
Lenovo ThinkPad P16s G2 21K9000CGE
AMD Radeon 780M, AMD Ryzen 7 PRO 7840U
2813 Points -83%
HP ZBook Firefly 16 G9-6B897EA
NVIDIA T550 Laptop GPU, Intel Core i7-1265U
1928 Points -88%
2560x1440 Time Spy Score
Lenovo ThinkPad P16 Gen 2
NVIDIA RTX 4000 Ada Generation Laptop GPU, Intel Core i7-14700HX
16013 Points
Усредн. модель с NVIDIA RTX 4000 Ada Generation Laptop GPU
  ()
16013 Points 0%
Dell Precision 5690
NVIDIA RTX 5000 Ada Generation Laptop GPU, Intel Core Ultra 9 185H
14048 Points -12%
HP ZBook Fury 16 G11
NVIDIA RTX 3500 Ada Generation Laptop GPU, Intel Core i9-14900HX
13191 Points -18%
HP ZBook Fury 16 G9
NVIDIA RTX A5500 Laptop GPU, Intel Core i9-12950HX
9402 Points -41%
Dell Precision 5000 5490
NVIDIA RTX 3000 Ada Generation Laptop GPU, Intel Core Ultra 9 185H
8254 Points -48%
HP ZBook Power 15 G10
NVIDIA RTX 2000 Ada Generation Laptop GPU, AMD Ryzen 7 PRO 7840HS
7813 Points -51%
MSI CreatorPro Z16P B12UKST
NVIDIA RTX A3000 Laptop GPU, Intel Core i7-12700H
7703 Points -52%
Asus ExpertBook B6 Flip B6602FC2
NVIDIA RTX A2000 Laptop GPU, Intel Core i9-12950HX
6692 Points -58%
Lenovo ThinkPad P16v G1 AMD
NVIDIA RTX A1000 Laptop GPU, AMD Ryzen 7 PRO 7840HS
4835 Points -70%
Lenovo ThinkPad P1 G4-20Y4Z9DVUS
NVIDIA T1200 Laptop GPU, Intel Core i7-11800H
3937 Points -75%
Lenovo ThinkPad P16s G2 21K9000CGE
AMD Radeon 780M, AMD Ryzen 7 PRO 7840U
3126 Points -80%
HP ZBook Firefly 16 G9-6B897EA
NVIDIA T550 Laptop GPU, Intel Core i7-1265U
2066 Points -87%
2560x1440 Speed Way Score
Lenovo ThinkPad P16 Gen 2
NVIDIA RTX 4000 Ada Generation Laptop GPU, Intel Core i7-14700HX
4034 Points
Усредн. модель с NVIDIA RTX 4000 Ada Generation Laptop GPU
  ()
4034 Points 0%
Dell Precision 5690
NVIDIA RTX 5000 Ada Generation Laptop GPU, Intel Core Ultra 9 185H
3866 Points -4%
HP ZBook Fury 16 G11
NVIDIA RTX 3500 Ada Generation Laptop GPU, Intel Core i9-14900HX
3154 Points -22%
HP ZBook Fury 16 G9
NVIDIA RTX A5500 Laptop GPU, Intel Core i9-12950HX
2068 Points -49%
Dell Precision 5000 5490
NVIDIA RTX 3000 Ada Generation Laptop GPU, Intel Core Ultra 9 185H
1977 Points -51%
HP ZBook Power 15 G10
NVIDIA RTX 2000 Ada Generation Laptop GPU, AMD Ryzen 7 PRO 7840HS
1849 Points -54%
Lenovo ThinkPad P16v G1 AMD
NVIDIA RTX A1000 Laptop GPU, AMD Ryzen 7 PRO 7840HS
973 Points -76%
Steel Nomad Score
Lenovo ThinkPad P16 Gen 2
NVIDIA RTX 4000 Ada Generation Laptop GPU, Intel Core i7-14700HX
3624 Points
Усредн. модель с NVIDIA RTX 4000 Ada Generation Laptop GPU
  ()
3624 Points 0%
HP ZBook Fury 16 G11
NVIDIA RTX 3500 Ada Generation Laptop GPU, Intel Core i9-14900HX
2793 Points -23%
SPECviewperf 12
1900x1060 Catia (catia-04)
Усредн. модель с NVIDIA RTX 4000 Ada Generation Laptop GPU
  ()
270 fps 0%
Lenovo ThinkPad P16 Gen 2
NVIDIA RTX 4000 Ada Generation Laptop GPU, Intel Core i7-14700HX
269.84 fps
HP ZBook Fury 16 G11
NVIDIA RTX 3500 Ada Generation Laptop GPU, Intel Core i9-14900HX
247.83 fps -8%
Dell Precision 5690
NVIDIA RTX 5000 Ada Generation Laptop GPU, Intel Core Ultra 9 185H
221.81 fps -18%
HP ZBook Fury 16 G9
NVIDIA RTX A5500 Laptop GPU, Intel Core i9-12950HX
189.79 fps -30%
Dell Precision 5000 5490
NVIDIA RTX 3000 Ada Generation Laptop GPU, Intel Core Ultra 9 185H
174.33 fps -35%
1900x1060 Creo (creo-01)
Усредн. модель с NVIDIA RTX 4000 Ada Generation Laptop GPU
  ()
206 fps 0%
Lenovo ThinkPad P16 Gen 2
NVIDIA RTX 4000 Ada Generation Laptop GPU, Intel Core i7-14700HX
205.82 fps
HP ZBook Fury 16 G11
NVIDIA RTX 3500 Ada Generation Laptop GPU, Intel Core i9-14900HX
192.32 fps -7%
Dell Precision 5690
NVIDIA RTX 5000 Ada Generation Laptop GPU, Intel Core Ultra 9 185H
178.71 fps -13%
HP ZBook Fury 16 G9
NVIDIA RTX A5500 Laptop GPU, Intel Core i9-12950HX
165.88 fps -19%
Dell Precision 5000 5490
NVIDIA RTX 3000 Ada Generation Laptop GPU, Intel Core Ultra 9 185H
123.21 fps -40%
1900x1060 Energy (energy-01)
HP ZBook Fury 16 G11
NVIDIA RTX 3500 Ada Generation Laptop GPU, Intel Core i9-14900HX
23.74 fps
HP ZBook Fury 16 G9
NVIDIA RTX A5500 Laptop GPU, Intel Core i9-12950HX
16.41 fps
1900x1060 Maya (maya-04)
Lenovo ThinkPad P16 Gen 2
NVIDIA RTX 4000 Ada Generation Laptop GPU, Intel Core i7-14700HX
180.93 fps
Усредн. модель с NVIDIA RTX 4000 Ada Generation Laptop GPU
  ()
180.9 fps 0%
HP ZBook Fury 16 G11
NVIDIA RTX 3500 Ada Generation Laptop GPU, Intel Core i9-14900HX
179.06 fps -1%
Dell Precision 5690
NVIDIA RTX 5000 Ada Generation Laptop GPU, Intel Core Ultra 9 185H
170.7 fps -6%
Dell Precision 5000 5490
NVIDIA RTX 3000 Ada Generation Laptop GPU, Intel Core Ultra 9 185H
133.1 fps -26%
HP ZBook Fury 16 G9
NVIDIA RTX A5500 Laptop GPU, Intel Core i9-12950HX
121.02 fps -33%
1900x1060 Medical (medical-01)
HP ZBook Fury 16 G11
NVIDIA RTX 3500 Ada Generation Laptop GPU, Intel Core i9-14900HX
103.14 fps
HP ZBook Fury 16 G9
NVIDIA RTX A5500 Laptop GPU, Intel Core i9-12950HX
84.87 fps
1900x1060 Showcase (showcase-01)
Усредн. модель с NVIDIA RTX 4000 Ada Generation Laptop GPU
  ()
156.7 fps 0%
Lenovo ThinkPad P16 Gen 2
NVIDIA RTX 4000 Ada Generation Laptop GPU, Intel Core i7-14700HX
156.66 fps
Dell Precision 5690
NVIDIA RTX 5000 Ada Generation Laptop GPU, Intel Core Ultra 9 185H
150.65 fps -4%
HP ZBook Fury 16 G11
NVIDIA RTX 3500 Ada Generation Laptop GPU, Intel Core i9-14900HX
145.77 fps -7%
HP ZBook Fury 16 G9
NVIDIA RTX A5500 Laptop GPU, Intel Core i9-12950HX
131.53 fps -16%
Dell Precision 5000 5490
NVIDIA RTX 3000 Ada Generation Laptop GPU, Intel Core Ultra 9 185H
91.96 fps -41%
1900x1060 Siemens NX (snx-02)
Усредн. модель с NVIDIA RTX 4000 Ada Generation Laptop GPU
  ()
309 fps 0%
Lenovo ThinkPad P16 Gen 2
NVIDIA RTX 4000 Ada Generation Laptop GPU, Intel Core i7-14700HX
308.52 fps
Dell Precision 5690
NVIDIA RTX 5000 Ada Generation Laptop GPU, Intel Core Ultra 9 185H
292 fps -5%
HP ZBook Fury 16 G11
NVIDIA RTX 3500 Ada Generation Laptop GPU, Intel Core i9-14900HX
239.13 fps -22%
HP ZBook Fury 16 G9
NVIDIA RTX A5500 Laptop GPU, Intel Core i9-12950HX
176.66 fps -43%
Dell Precision 5000 5490
NVIDIA RTX 3000 Ada Generation Laptop GPU, Intel Core Ultra 9 185H
174.85 fps -43%
1900x1060 Solidworks (sw-03)
Усредн. модель с NVIDIA RTX 4000 Ada Generation Laptop GPU
  ()
226 fps 0%
Lenovo ThinkPad P16 Gen 2
NVIDIA RTX 4000 Ada Generation Laptop GPU, Intel Core i7-14700HX
225.74 fps
HP ZBook Fury 16 G11
NVIDIA RTX 3500 Ada Generation Laptop GPU, Intel Core i9-14900HX
210.7 fps -7%
Dell Precision 5690
NVIDIA RTX 5000 Ada Generation Laptop GPU, Intel Core Ultra 9 185H
189.92 fps -16%
HP ZBook Fury 16 G9
NVIDIA RTX A5500 Laptop GPU, Intel Core i9-12950HX
167.74 fps -26%
Dell Precision 5000 5490
NVIDIA RTX 3000 Ada Generation Laptop GPU, Intel Core Ultra 9 185H
159.9 fps -29%
SPECviewperf 13
3ds Max (3dsmax-06)
Усредн. модель с NVIDIA RTX 4000 Ada Generation Laptop GPU
  ()
288 fps 0%
Lenovo ThinkPad P16 Gen 2
NVIDIA RTX 4000 Ada Generation Laptop GPU, Intel Core i7-14700HX
287.6 fps
Dell Precision 5690
NVIDIA RTX 5000 Ada Generation Laptop GPU, Intel Core Ultra 9 185H
258.63 fps -10%
HP ZBook Fury 16 G11
NVIDIA RTX 3500 Ada Generation Laptop GPU, Intel Core i9-14900HX
233.81 fps -19%
HP ZBook Fury 16 G9
NVIDIA RTX A5500 Laptop GPU, Intel Core i9-12950HX
223.61 fps -22%
Dell Precision 5000 5490
NVIDIA RTX 3000 Ada Generation Laptop GPU, Intel Core Ultra 9 185H
189.32 fps -34%
HP ZBook Power 15 G10
NVIDIA RTX 2000 Ada Generation Laptop GPU, AMD Ryzen 7 PRO 7840HS
182.53 fps -37%
MSI CreatorPro Z16P B12UKST
NVIDIA RTX A3000 Laptop GPU, Intel Core i7-12700H
181.04 fps -37%
Asus ExpertBook B6 Flip B6602FC2
NVIDIA RTX A2000 Laptop GPU, Intel Core i9-12950HX
165 fps -43%
Lenovo ThinkPad P16v G1 AMD
NVIDIA RTX A1000 Laptop GPU, AMD Ryzen 7 PRO 7840HS
127.82 fps -56%
Lenovo ThinkPad P1 G4-20Y4Z9DVUS
NVIDIA T1200 Laptop GPU, Intel Core i7-11800H
105.4 fps -63%
Lenovo ThinkPad P16s G2 21K9000CGE
AMD Radeon 780M, AMD Ryzen 7 PRO 7840U
80.9 fps -72%
HP ZBook Firefly 16 G9-6B897EA
NVIDIA T550 Laptop GPU, Intel Core i7-1265U
63 fps -78%
Catia (catia-05)
Усредн. модель с NVIDIA RTX 4000 Ada Generation Laptop GPU
  ()
418 fps 0%
Lenovo ThinkPad P16 Gen 2
NVIDIA RTX 4000 Ada Generation Laptop GPU, Intel Core i7-14700HX
417.57 fps
HP ZBook Fury 16 G11
NVIDIA RTX 3500 Ada Generation Laptop GPU, Intel Core i9-14900HX
382.79 fps -8%
Dell Precision 5690
NVIDIA RTX 5000 Ada Generation Laptop GPU, Intel Core Ultra 9 185H
352.35 fps -16%
HP ZBook Fury 16 G9
NVIDIA RTX A5500 Laptop GPU, Intel Core i9-12950HX
302.32 fps -28%
Dell Precision 5000 5490
NVIDIA RTX 3000 Ada Generation Laptop GPU, Intel Core Ultra 9 185H
273.29 fps -35%
HP ZBook Power 15 G10
NVIDIA RTX 2000 Ada Generation Laptop GPU, AMD Ryzen 7 PRO 7840HS
257.86 fps -38%
MSI CreatorPro Z16P B12UKST
NVIDIA RTX A3000 Laptop GPU, Intel Core i7-12700H
252.25 fps -40%
Asus ExpertBook B6 Flip B6602FC2
NVIDIA RTX A2000 Laptop GPU, Intel Core i9-12950HX
233 fps -44%
Lenovo ThinkPad P16v G1 AMD
NVIDIA RTX A1000 Laptop GPU, AMD Ryzen 7 PRO 7840HS
218.18 fps -48%
Lenovo ThinkPad P1 G4-20Y4Z9DVUS
NVIDIA T1200 Laptop GPU, Intel Core i7-11800H
169.4 fps -59%
Lenovo ThinkPad P16s G2 21K9000CGE
AMD Radeon 780M, AMD Ryzen 7 PRO 7840U
113.2 fps -73%
HP ZBook Firefly 16 G9-6B897EA
NVIDIA T550 Laptop GPU, Intel Core i7-1265U
109 fps -74%
Creo (creo-02)
Усредн. модель с NVIDIA RTX 4000 Ada Generation Laptop GPU
  ()
425 fps 0%
Lenovo ThinkPad P16 Gen 2
NVIDIA RTX 4000 Ada Generation Laptop GPU, Intel Core i7-14700HX
424.69 fps
HP ZBook Fury 16 G11
NVIDIA RTX 3500 Ada Generation Laptop GPU, Intel Core i9-14900HX
361.4 fps -15%
Dell Precision 5690
NVIDIA RTX 5000 Ada Generation Laptop GPU, Intel Core Ultra 9 185H
354.77 fps -16%
HP ZBook Power 15 G10
NVIDIA RTX 2000 Ada Generation Laptop GPU, AMD Ryzen 7 PRO 7840HS
249.3 fps -41%
Dell Precision 5000 5490
NVIDIA RTX 3000 Ada Generation Laptop GPU, Intel Core Ultra 9 185H
245.25 fps -42%
HP ZBook Fury 16 G9
NVIDIA RTX A5500 Laptop GPU, Intel Core i9-12950HX
243.69 fps -43%
MSI CreatorPro Z16P B12UKST
NVIDIA RTX A3000 Laptop GPU, Intel Core i7-12700H
235.49 fps -45%
Asus ExpertBook B6 Flip B6602FC2
NVIDIA RTX A2000 Laptop GPU, Intel Core i9-12950HX
189 fps -55%
Lenovo ThinkPad P16v G1 AMD
NVIDIA RTX A1000 Laptop GPU, AMD Ryzen 7 PRO 7840HS
164.76 fps -61%
Lenovo ThinkPad P1 G4-20Y4Z9DVUS
NVIDIA T1200 Laptop GPU, Intel Core i7-11800H
132.9 fps -69%
HP ZBook Firefly 16 G9-6B897EA
NVIDIA T550 Laptop GPU, Intel Core i7-1265U
85.5 fps -80%
Lenovo ThinkPad P16s G2 21K9000CGE
AMD Radeon 780M, AMD Ryzen 7 PRO 7840U
84.6 fps -80%
Energy (energy-02)
Dell Precision 5690
NVIDIA RTX 5000 Ada Generation Laptop GPU, Intel Core Ultra 9 185H
108.19 fps +1%
Усредн. модель с NVIDIA RTX 4000 Ada Generation Laptop GPU
  ()
106.8 fps 0%
Lenovo ThinkPad P16 Gen 2
NVIDIA RTX 4000 Ada Generation Laptop GPU, Intel Core i7-14700HX
106.79 fps
HP ZBook Fury 16 G11
NVIDIA RTX 3500 Ada Generation Laptop GPU, Intel Core i9-14900HX
76.83 fps -28%
HP ZBook Fury 16 G9
NVIDIA RTX A5500 Laptop GPU, Intel Core i9-12950HX
61.15 fps -43%
Dell Precision 5000 5490
NVIDIA RTX 3000 Ada Generation Laptop GPU, Intel Core Ultra 9 185H
56.97 fps -47%
HP ZBook Power 15 G10
NVIDIA RTX 2000 Ada Generation Laptop GPU, AMD Ryzen 7 PRO 7840HS
46.29 fps -57%
MSI CreatorPro Z16P B12UKST
NVIDIA RTX A3000 Laptop GPU, Intel Core i7-12700H
44.09 fps -59%
Asus ExpertBook B6 Flip B6602FC2
NVIDIA RTX A2000 Laptop GPU, Intel Core i9-12950HX
36.8 fps -66%
Lenovo ThinkPad P16v G1 AMD
NVIDIA RTX A1000 Laptop GPU, AMD Ryzen 7 PRO 7840HS
30.29 fps -72%
Lenovo ThinkPad P16s G2 21K9000CGE
AMD Radeon 780M, AMD Ryzen 7 PRO 7840U
20.7 fps -81%
Lenovo ThinkPad P1 G4-20Y4Z9DVUS
NVIDIA T1200 Laptop GPU, Intel Core i7-11800H
19.29 fps -82%
HP ZBook Firefly 16 G9-6B897EA
NVIDIA T550 Laptop GPU, Intel Core i7-1265U
12 fps -89%
Maya (maya-05)
Усредн. модель с NVIDIA RTX 4000 Ada Generation Laptop GPU
  ()
448 fps 0%
Lenovo ThinkPad P16 Gen 2
NVIDIA RTX 4000 Ada Generation Laptop GPU, Intel Core i7-14700HX
447.52 fps
Dell Precision 5690
NVIDIA RTX 5000 Ada Generation Laptop GPU, Intel Core Ultra 9 185H
385.99 fps -14%
HP ZBook Fury 16 G11
NVIDIA RTX 3500 Ada Generation Laptop GPU, Intel Core i9-14900HX
385.36 fps -14%
HP ZBook Power 15 G10
NVIDIA RTX 2000 Ada Generation Laptop GPU, AMD Ryzen 7 PRO 7840HS
271.86 fps -39%
HP ZBook Fury 16 G9
NVIDIA RTX A5500 Laptop GPU, Intel Core i9-12950HX
265.99 fps -41%
Dell Precision 5000 5490
NVIDIA RTX 3000 Ada Generation Laptop GPU, Intel Core Ultra 9 185H
260.1 fps -42%
MSI CreatorPro Z16P B12UKST
NVIDIA RTX A3000 Laptop GPU, Intel Core i7-12700H
228.37 fps -49%
Asus ExpertBook B6 Flip B6602FC2
NVIDIA RTX A2000 Laptop GPU, Intel Core i9-12950HX
195 fps -56%
Lenovo ThinkPad P16v G1 AMD
NVIDIA RTX A1000 Laptop GPU, AMD Ryzen 7 PRO 7840HS
169 fps -62%
Lenovo ThinkPad P1 G4-20Y4Z9DVUS
NVIDIA T1200 Laptop GPU, Intel Core i7-11800H
127.8 fps -71%
Lenovo ThinkPad P16s G2 21K9000CGE
AMD Radeon 780M, AMD Ryzen 7 PRO 7840U
103 fps -77%
HP ZBook Firefly 16 G9-6B897EA
NVIDIA T550 Laptop GPU, Intel Core i7-1265U
80.9 fps -82%
Medical (medical-02)
Lenovo ThinkPad P16 Gen 2
NVIDIA RTX 4000 Ada Generation Laptop GPU, Intel Core i7-14700HX
272.02 fps
Усредн. модель с NVIDIA RTX 4000 Ada Generation Laptop GPU
  ()
272 fps 0%
Dell Precision 5690
NVIDIA RTX 5000 Ada Generation Laptop GPU, Intel Core Ultra 9 185H
249.87 fps -8%
HP ZBook Fury 16 G11
NVIDIA RTX 3500 Ada Generation Laptop GPU, Intel Core i9-14900HX
215.19 fps -21%
Dell Precision 5000 5490
NVIDIA RTX 3000 Ada Generation Laptop GPU, Intel Core Ultra 9 185H
168.45 fps -38%
HP ZBook Fury 16 G9
NVIDIA RTX A5500 Laptop GPU, Intel Core i9-12950HX
116.87 fps -57%
Lenovo ThinkPad P16v G1 AMD
NVIDIA RTX A1000 Laptop GPU, AMD Ryzen 7 PRO 7840HS
105.45 fps -61%
HP ZBook Power 15 G10
NVIDIA RTX 2000 Ada Generation Laptop GPU, AMD Ryzen 7 PRO 7840HS
103.3 fps -62%
MSI CreatorPro Z16P B12UKST
NVIDIA RTX A3000 Laptop GPU, Intel Core i7-12700H
102.82 fps -62%
Asus ExpertBook B6 Flip B6602FC2
NVIDIA RTX A2000 Laptop GPU, Intel Core i9-12950HX
76.8 fps -72%
Lenovo ThinkPad P16s G2 21K9000CGE
AMD Radeon 780M, AMD Ryzen 7 PRO 7840U
66.1 fps -76%
Lenovo ThinkPad P1 G4-20Y4Z9DVUS
NVIDIA T1200 Laptop GPU, Intel Core i7-11800H
53.6 fps -80%
HP ZBook Firefly 16 G9-6B897EA
NVIDIA T550 Laptop GPU, Intel Core i7-1265U
36.2 fps -87%
Showcase (showcase-02)
Lenovo ThinkPad P16 Gen 2
NVIDIA RTX 4000 Ada Generation Laptop GPU, Intel Core i7-14700HX
155.82 fps
Усредн. модель с NVIDIA RTX 4000 Ada Generation Laptop GPU
  ()
155.8 fps 0%
Dell Precision 5690
NVIDIA RTX 5000 Ada Generation Laptop GPU, Intel Core Ultra 9 185H
150.88 fps -3%
HP ZBook Fury 16 G9
NVIDIA RTX A5500 Laptop GPU, Intel Core i9-12950HX
132.86 fps -15%
HP ZBook Fury 16 G11
NVIDIA RTX 3500 Ada Generation Laptop GPU, Intel Core i9-14900HX
131.45 fps -16%
MSI CreatorPro Z16P B12UKST
NVIDIA RTX A3000 Laptop GPU, Intel Core i7-12700H
99.91 fps -36%
Dell Precision 5000 5490
NVIDIA RTX 3000 Ada Generation Laptop GPU, Intel Core Ultra 9 185H
88.94 fps -43%
HP ZBook Power 15 G10
NVIDIA RTX 2000 Ada Generation Laptop GPU, AMD Ryzen 7 PRO 7840HS
82.79 fps -47%
Asus ExpertBook B6 Flip B6602FC2
NVIDIA RTX A2000 Laptop GPU, Intel Core i9-12950HX
79.2 fps -49%
Lenovo ThinkPad P16v G1 AMD
NVIDIA RTX A1000 Laptop GPU, AMD Ryzen 7 PRO 7840HS
55.66 fps -64%
Lenovo ThinkPad P1 G4-20Y4Z9DVUS
NVIDIA T1200 Laptop GPU, Intel Core i7-11800H
46.84 fps -70%
Lenovo ThinkPad P16s G2 21K9000CGE
AMD Radeon 780M, AMD Ryzen 7 PRO 7840U
28.6 fps -82%
HP ZBook Firefly 16 G9-6B897EA
NVIDIA T550 Laptop GPU, Intel Core i7-1265U
25.3 fps -84%
Siemens NX (snx-03)
Lenovo ThinkPad P16 Gen 2
NVIDIA RTX 4000 Ada Generation Laptop GPU, Intel Core i7-14700HX
555.09 fps
Усредн. модель с NVIDIA RTX 4000 Ada Generation Laptop GPU
  ()
555 fps 0%
Dell Precision 5690
NVIDIA RTX 5000 Ada Generation Laptop GPU, Intel Core Ultra 9 185H
524.73 fps -5%
HP ZBook Fury 16 G11
NVIDIA RTX 3500 Ada Generation Laptop GPU, Intel Core i9-14900HX
436.96 fps -21%
HP ZBook Fury 16 G9
NVIDIA RTX A5500 Laptop GPU, Intel Core i9-12950HX
334.23 fps -40%
HP ZBook Power 15 G10
NVIDIA RTX 2000 Ada Generation Laptop GPU, AMD Ryzen 7 PRO 7840HS
315.35 fps -43%
Dell Precision 5000 5490
NVIDIA RTX 3000 Ada Generation Laptop GPU, Intel Core Ultra 9 185H
312.07 fps -44%
MSI CreatorPro Z16P B12UKST
NVIDIA RTX A3000 Laptop GPU, Intel Core i7-12700H
279.21 fps -50%
Asus ExpertBook B6 Flip B6602FC2
NVIDIA RTX A2000 Laptop GPU, Intel Core i9-12950HX
214 fps -61%
Lenovo ThinkPad P16v G1 AMD
NVIDIA RTX A1000 Laptop GPU, AMD Ryzen 7 PRO 7840HS
195.81 fps -65%
Lenovo ThinkPad P1 G4-20Y4Z9DVUS
NVIDIA T1200 Laptop GPU, Intel Core i7-11800H
161.3 fps -71%
Lenovo ThinkPad P16s G2 21K9000CGE
AMD Radeon 780M, AMD Ryzen 7 PRO 7840U
136.1 fps -75%
HP ZBook Firefly 16 G9-6B897EA
NVIDIA T550 Laptop GPU, Intel Core i7-1265U
99.7 fps -82%
Solidworks (sw-04)
Lenovo ThinkPad P16 Gen 2
NVIDIA RTX 4000 Ada Generation Laptop GPU, Intel Core i7-14700HX
230.39 fps
Усредн. модель с NVIDIA RTX 4000 Ada Generation Laptop GPU
  ()
230 fps 0%
HP ZBook Fury 16 G11
NVIDIA RTX 3500 Ada Generation Laptop GPU, Intel Core i9-14900HX
215.39 fps -7%
Dell Precision 5690
NVIDIA RTX 5000 Ada Generation Laptop GPU, Intel Core Ultra 9 185H
195.09 fps -15%
HP ZBook Fury 16 G9
NVIDIA RTX A5500 Laptop GPU, Intel Core i9-12950HX
186.09 fps -19%
HP ZBook Power 15 G10
NVIDIA RTX 2000 Ada Generation Laptop GPU, AMD Ryzen 7 PRO 7840HS
173.89 fps -25%
Dell Precision 5000 5490
NVIDIA RTX 3000 Ada Generation Laptop GPU, Intel Core Ultra 9 185H
162.23 fps -30%
Asus ExpertBook B6 Flip B6602FC2
NVIDIA RTX A2000 Laptop GPU, Intel Core i9-12950HX
153 fps -34%
MSI CreatorPro Z16P B12UKST
NVIDIA RTX A3000 Laptop GPU, Intel Core i7-12700H
151.63 fps -34%
Lenovo ThinkPad P16v G1 AMD
NVIDIA RTX A1000 Laptop GPU, AMD Ryzen 7 PRO 7840HS
147.92 fps -36%
Lenovo ThinkPad P1 G4-20Y4Z9DVUS
NVIDIA T1200 Laptop GPU, Intel Core i7-11800H
128.5 fps -44%
HP ZBook Firefly 16 G9-6B897EA
NVIDIA T550 Laptop GPU, Intel Core i7-1265U
95.8 fps -58%
Lenovo ThinkPad P16s G2 21K9000CGE
AMD Radeon 780M, AMD Ryzen 7 PRO 7840U
91.8 fps -60%
SPECviewperf 2020
3840x2160 3ds Max (3dsmax-07)
Усредн. модель с NVIDIA RTX 4000 Ada Generation Laptop GPU
  ()
114.5 fps 0%
Lenovo ThinkPad P16 Gen 2
NVIDIA RTX 4000 Ada Generation Laptop GPU, Intel Core i7-14700HX
114.49 fps
Dell Precision 5690
NVIDIA RTX 5000 Ada Generation Laptop GPU, Intel Core Ultra 9 185H
94.56 fps -17%
HP ZBook Fury 16 G11
NVIDIA RTX 3500 Ada Generation Laptop GPU, Intel Core i9-14900HX
87.61 fps -23%
HP ZBook Fury 16 G9
NVIDIA RTX A5500 Laptop GPU, Intel Core i9-12950HX
73.53 fps -36%
Dell Precision 5000 5490
NVIDIA RTX 3000 Ada Generation Laptop GPU, Intel Core Ultra 9 185H
53 fps -54%
HP ZBook Power 15 G10
NVIDIA RTX 2000 Ada Generation Laptop GPU, AMD Ryzen 7 PRO 7840HS
46.84 fps -59%
3840x2160 CATIA (catia-06)
Усредн. модель с NVIDIA RTX 4000 Ada Generation Laptop GPU
  ()
80.9 fps 0%
Lenovo ThinkPad P16 Gen 2
NVIDIA RTX 4000 Ada Generation Laptop GPU, Intel Core i7-14700HX
80.89 fps
HP ZBook Fury 16 G11
NVIDIA RTX 3500 Ada Generation Laptop GPU, Intel Core i9-14900HX
68.58 fps -15%
Dell Precision 5690
NVIDIA RTX 5000 Ada Generation Laptop GPU, Intel Core Ultra 9 185H
67.17 fps -17%
HP ZBook Fury 16 G9
NVIDIA RTX A5500 Laptop GPU, Intel Core i9-12950HX
55.52 fps -31%
Dell Precision 5000 5490
NVIDIA RTX 3000 Ada Generation Laptop GPU, Intel Core Ultra 9 185H
45.26 fps -44%
HP ZBook Power 15 G10
NVIDIA RTX 2000 Ada Generation Laptop GPU, AMD Ryzen 7 PRO 7840HS
44.65 fps -45%
3840x2160 Creo (creo-03)
Lenovo ThinkPad P16 Gen 2
NVIDIA RTX 4000 Ada Generation Laptop GPU, Intel Core i7-14700HX
144.91 fps
Усредн. модель с NVIDIA RTX 4000 Ada Generation Laptop GPU
  ()
144.9 fps 0%
HP ZBook Fury 16 G11
NVIDIA RTX 3500 Ada Generation Laptop GPU, Intel Core i9-14900HX
123.79 fps -15%
Dell Precision 5690
NVIDIA RTX 5000 Ada Generation Laptop GPU, Intel Core Ultra 9 185H
100.9 fps -30%
HP ZBook Fury 16 G9
NVIDIA RTX A5500 Laptop GPU, Intel Core i9-12950HX
91.29 fps -37%
Dell Precision 5000 5490
NVIDIA RTX 3000 Ada Generation Laptop GPU, Intel Core Ultra 9 185H
74.79 fps -48%
HP ZBook Power 15 G10
NVIDIA RTX 2000 Ada Generation Laptop GPU, AMD Ryzen 7 PRO 7840HS
69.22 fps -52%
3840x2160 Energy (energy-03)
Усредн. модель с NVIDIA RTX 4000 Ada Generation Laptop GPU
  ()
709 fps 0%
Lenovo ThinkPad P16 Gen 2
NVIDIA RTX 4000 Ada Generation Laptop GPU, Intel Core i7-14700HX
708.83 fps
HP ZBook Fury 16 G11
NVIDIA RTX 3500 Ada Generation Laptop GPU, Intel Core i9-14900HX
74.26 fps -90%
Dell Precision 5690
NVIDIA RTX 5000 Ada Generation Laptop GPU, Intel Core Ultra 9 185H
38.09 fps -95%
HP ZBook Fury 16 G9
NVIDIA RTX A5500 Laptop GPU, Intel Core i9-12950HX
21.54 fps -97%
Dell Precision 5000 5490
NVIDIA RTX 3000 Ada Generation Laptop GPU, Intel Core Ultra 9 185H
20 fps -97%
HP ZBook Power 15 G10
NVIDIA RTX 2000 Ada Generation Laptop GPU, AMD Ryzen 7 PRO 7840HS
14.9 fps -98%
3840x2160 Maya (maya-06)
Lenovo ThinkPad P16 Gen 2
NVIDIA RTX 4000 Ada Generation Laptop GPU, Intel Core i7-14700HX
299.26 fps
Усредн. модель с NVIDIA RTX 4000 Ada Generation Laptop GPU
  ()
299 fps 0%
HP ZBook Fury 16 G11
NVIDIA RTX 3500 Ada Generation Laptop GPU, Intel Core i9-14900HX
218.02 fps -27%
Dell Precision 5690
NVIDIA RTX 5000 Ada Generation Laptop GPU, Intel Core Ultra 9 185H
184.05 fps -38%
Dell Precision 5000 5490
NVIDIA RTX 3000 Ada Generation Laptop GPU, Intel Core Ultra 9 185H
138.82 fps -54%
HP ZBook Fury 16 G9
NVIDIA RTX A5500 Laptop GPU, Intel Core i9-12950HX
132.18 fps -56%
HP ZBook Power 15 G10
NVIDIA RTX 2000 Ada Generation Laptop GPU, AMD Ryzen 7 PRO 7840HS
114.04 fps -62%
3840x2160 Medical (medical-03)
Lenovo ThinkPad P16 Gen 2
NVIDIA RTX 4000 Ada Generation Laptop GPU, Intel Core i7-14700HX
69.52 fps
Усредн. модель с NVIDIA RTX 4000 Ada Generation Laptop GPU
  ()
69.5 fps 0%
Dell Precision 5690
NVIDIA RTX 5000 Ada Generation Laptop GPU, Intel Core Ultra 9 185H
58.46 fps -16%
HP ZBook Fury 16 G11
NVIDIA RTX 3500 Ada Generation Laptop GPU, Intel Core i9-14900HX
50.24 fps -28%
Dell Precision 5000 5490
NVIDIA RTX 3000 Ada Generation Laptop GPU, Intel Core Ultra 9 185H
36.49 fps -48%
HP ZBook Fury 16 G9
NVIDIA RTX A5500 Laptop GPU, Intel Core i9-12950HX
23.31 fps -66%
HP ZBook Power 15 G10
NVIDIA RTX 2000 Ada Generation Laptop GPU, AMD Ryzen 7 PRO 7840HS
17 fps -76%
3840x2160 Siemens NX (snx-04)
HP ZBook Fury 16 G11
NVIDIA RTX 3500 Ada Generation Laptop GPU, Intel Core i9-14900HX
323.69 fps
Dell Precision 5690
NVIDIA RTX 5000 Ada Generation Laptop GPU, Intel Core Ultra 9 185H
214.15 fps
HP ZBook Fury 16 G9
NVIDIA RTX A5500 Laptop GPU, Intel Core i9-12950HX
195.95 fps
Dell Precision 5000 5490
NVIDIA RTX 3000 Ada Generation Laptop GPU, Intel Core Ultra 9 185H
191.49 fps
HP ZBook Power 15 G10
NVIDIA RTX 2000 Ada Generation Laptop GPU, AMD Ryzen 7 PRO 7840HS
148.12 fps
1920x1080 3ds Max (3dsmax-07)
Усредн. модель с NVIDIA RTX 4000 Ada Generation Laptop GPU
  ()
174.9 fps 0%
Lenovo ThinkPad P16 Gen 2
NVIDIA RTX 4000 Ada Generation Laptop GPU, Intel Core i7-14700HX
174.89 fps
Dell Precision 5690
NVIDIA RTX 5000 Ada Generation Laptop GPU, Intel Core Ultra 9 185H
161.08 fps -8%
HP ZBook Fury 16 G11
NVIDIA RTX 3500 Ada Generation Laptop GPU, Intel Core i9-14900HX
134.15 fps -23%
HP ZBook Fury 16 G9
NVIDIA RTX A5500 Laptop GPU, Intel Core i9-12950HX
125.82 fps -28%
MSI CreatorPro Z16P B12UKST
NVIDIA RTX A3000 Laptop GPU, Intel Core i7-12700H
103.02 fps -41%
Dell Precision 5000 5490
NVIDIA RTX 3000 Ada Generation Laptop GPU, Intel Core Ultra 9 185H
80.93 fps -54%
HP ZBook Power 15 G10
NVIDIA RTX 2000 Ada Generation Laptop GPU, AMD Ryzen 7 PRO 7840HS
73.7 fps -58%
Asus ExpertBook B6 Flip B6602FC2
NVIDIA RTX A2000 Laptop GPU, Intel Core i9-12950HX
72.9 fps -58%
Lenovo ThinkPad P16v G1 AMD
NVIDIA RTX A1000 Laptop GPU, AMD Ryzen 7 PRO 7840HS
55.43 fps -68%
Lenovo ThinkPad P1 G4-20Y4Z9DVUS
NVIDIA T1200 Laptop GPU, Intel Core i7-11800H
50.2 fps -71%
Lenovo ThinkPad P16s G2 21K9000CGE
AMD Radeon 780M, AMD Ryzen 7 PRO 7840U
36 fps -79%
HP ZBook Firefly 16 G9-6B897EA
NVIDIA T550 Laptop GPU, Intel Core i7-1265U
29.6 fps -83%
1920x1080 CATIA (catia-06)
Lenovo ThinkPad P16 Gen 2
NVIDIA RTX 4000 Ada Generation Laptop GPU, Intel Core i7-14700HX
131.44 fps
Усредн. модель с NVIDIA RTX 4000 Ada Generation Laptop GPU
  ()
131.4 fps 0%
Dell Precision 5690
NVIDIA RTX 5000 Ada Generation Laptop GPU, Intel Core Ultra 9 185H
121.41 fps -8%
HP ZBook Fury 16 G11
NVIDIA RTX 3500 Ada Generation Laptop GPU, Intel Core i9-14900HX
115.25 fps -12%
HP ZBook Fury 16 G9
NVIDIA RTX A5500 Laptop GPU, Intel Core i9-12950HX
96.23 fps -27%
HP ZBook Power 15 G10
NVIDIA RTX 2000 Ada Generation Laptop GPU, AMD Ryzen 7 PRO 7840HS
81.59 fps -38%
MSI CreatorPro Z16P B12UKST
NVIDIA RTX A3000 Laptop GPU, Intel Core i7-12700H
80.27 fps -39%
Dell Precision 5000 5490
NVIDIA RTX 3000 Ada Generation Laptop GPU, Intel Core Ultra 9 185H
78.93 fps -40%
Asus ExpertBook B6 Flip B6602FC2
NVIDIA RTX A2000 Laptop GPU, Intel Core i9-12950HX
67.9 fps -48%
Lenovo ThinkPad P16v G1 AMD
NVIDIA RTX A1000 Laptop GPU, AMD Ryzen 7 PRO 7840HS
52.17 fps -60%
Lenovo ThinkPad P1 G4-20Y4Z9DVUS
NVIDIA T1200 Laptop GPU, Intel Core i7-11800H
41.6 fps -68%
Lenovo ThinkPad P16s G2 21K9000CGE
AMD Radeon 780M, AMD Ryzen 7 PRO 7840U
35.9 fps -73%
HP ZBook Firefly 16 G9-6B897EA
NVIDIA T550 Laptop GPU, Intel Core i7-1265U
24.9 fps -81%
1920x1080 Creo (creo-03)
Dell Precision 5690
NVIDIA RTX 5000 Ada Generation Laptop GPU, Intel Core Ultra 9 185H
153.83 fps +11%
Lenovo ThinkPad P16 Gen 2
NVIDIA RTX 4000 Ada Generation Laptop GPU, Intel Core i7-14700HX
138.71 fps
Усредн. модель с NVIDIA RTX 4000 Ada Generation Laptop GPU
  ()
138.7 fps 0%
HP ZBook Power 15 G10
NVIDIA RTX 2000 Ada Generation Laptop GPU, AMD Ryzen 7 PRO 7840HS
121.66 fps -12%
Dell Precision 5000 5490
NVIDIA RTX 3000 Ada Generation Laptop GPU, Intel Core Ultra 9 185H
113.79 fps -18%
Asus ExpertBook B6 Flip B6602FC2
NVIDIA RTX A2000 Laptop GPU, Intel Core i9-12950HX
113 fps -19%
HP ZBook Fury 16 G11
NVIDIA RTX 3500 Ada Generation Laptop GPU, Intel Core i9-14900HX
105.43 fps -24%
HP ZBook Fury 16 G9
NVIDIA RTX A5500 Laptop GPU, Intel Core i9-12950HX
104.45 fps -25%
MSI CreatorPro Z16P B12UKST
NVIDIA RTX A3000 Laptop GPU, Intel Core i7-12700H
101.07 fps -27%
Lenovo ThinkPad P16v G1 AMD
NVIDIA RTX A1000 Laptop GPU, AMD Ryzen 7 PRO 7840HS
90.91 fps -34%
Lenovo ThinkPad P1 G4-20Y4Z9DVUS
NVIDIA T1200 Laptop GPU, Intel Core i7-11800H
78.7 fps -43%
Lenovo ThinkPad P16s G2 21K9000CGE
AMD Radeon 780M, AMD Ryzen 7 PRO 7840U
54.9 fps -60%
HP ZBook Firefly 16 G9-6B897EA
NVIDIA T550 Laptop GPU, Intel Core i7-1265U
48.5 fps -65%
1920x1080 Energy (energy-03)
Dell Precision 5690
NVIDIA RTX 5000 Ada Generation Laptop GPU, Intel Core Ultra 9 185H
108.18 fps +180%
HP ZBook Fury 16 G11
NVIDIA RTX 3500 Ada Generation Laptop GPU, Intel Core i9-14900HX
76.82 fps +99%
HP ZBook Fury 16 G9
NVIDIA RTX A5500 Laptop GPU, Intel Core i9-12950HX
62.08 fps +61%
Dell Precision 5000 5490
NVIDIA RTX 3000 Ada Generation Laptop GPU, Intel Core Ultra 9 185H
57.2 fps +48%
HP ZBook Power 15 G10
NVIDIA RTX 2000 Ada Generation Laptop GPU, AMD Ryzen 7 PRO 7840HS
46.5 fps +20%
MSI CreatorPro Z16P B12UKST
NVIDIA RTX A3000 Laptop GPU, Intel Core i7-12700H
44.7 fps +16%
Lenovo ThinkPad P16 Gen 2
NVIDIA RTX 4000 Ada Generation Laptop GPU, Intel Core i7-14700HX
38.6 fps
Усредн. модель с NVIDIA RTX 4000 Ada Generation Laptop GPU
  ()
38.6 fps 0%
Asus ExpertBook B6 Flip B6602FC2
NVIDIA RTX A2000 Laptop GPU, Intel Core i9-12950HX
36.9 fps -4%
Lenovo ThinkPad P16v G1 AMD
NVIDIA RTX A1000 Laptop GPU, AMD Ryzen 7 PRO 7840HS
30.27 fps -22%
Lenovo ThinkPad P16s G2 21K9000CGE
AMD Radeon 780M, AMD Ryzen 7 PRO 7840U
22.5 fps -42%
Lenovo ThinkPad P1 G4-20Y4Z9DVUS
NVIDIA T1200 Laptop GPU, Intel Core i7-11800H
19.3 fps -50%
HP ZBook Firefly 16 G9-6B897EA
NVIDIA T550 Laptop GPU, Intel Core i7-1265U
12 fps -69%
1920x1080 Maya (maya-06)
Усредн. модель с NVIDIA RTX 4000 Ada Generation Laptop GPU
  ()
479 fps 0%
Lenovo ThinkPad P16 Gen 2
NVIDIA RTX 4000 Ada Generation Laptop GPU, Intel Core i7-14700HX
478.6 fps
HP ZBook Fury 16 G11
NVIDIA RTX 3500 Ada Generation Laptop GPU, Intel Core i9-14900HX
446.29 fps -7%
Dell Precision 5690
NVIDIA RTX 5000 Ada Generation Laptop GPU, Intel Core Ultra 9 185H
433.58 fps -9%
Dell Precision 5000 5490
NVIDIA RTX 3000 Ada Generation Laptop GPU, Intel Core Ultra 9 185H
310.86 fps -35%
HP ZBook Power 15 G10
NVIDIA RTX 2000 Ada Generation Laptop GPU, AMD Ryzen 7 PRO 7840HS
309.59 fps -35%
HP ZBook Fury 16 G9
NVIDIA RTX A5500 Laptop GPU, Intel Core i9-12950HX
293.35 fps -39%
MSI CreatorPro Z16P B12UKST
NVIDIA RTX A3000 Laptop GPU, Intel Core i7-12700H
286.54 fps -40%
Asus ExpertBook B6 Flip B6602FC2
NVIDIA RTX A2000 Laptop GPU, Intel Core i9-12950HX
221 fps -54%
Lenovo ThinkPad P16v G1 AMD
NVIDIA RTX A1000 Laptop GPU, AMD Ryzen 7 PRO 7840HS
201.79 fps -58%
Lenovo ThinkPad P1 G4-20Y4Z9DVUS
NVIDIA T1200 Laptop GPU, Intel Core i7-11800H
144.9 fps -70%
Lenovo ThinkPad P16s G2 21K9000CGE
AMD Radeon 780M, AMD Ryzen 7 PRO 7840U
121.6 fps -75%
HP ZBook Firefly 16 G9-6B897EA
NVIDIA T550 Laptop GPU, Intel Core i7-1265U
98.1 fps -80%
1920x1080 Medical (medical-03)
Lenovo ThinkPad P16 Gen 2
NVIDIA RTX 4000 Ada Generation Laptop GPU, Intel Core i7-14700HX
152.04 fps
Усредн. модель с NVIDIA RTX 4000 Ada Generation Laptop GPU
  ()
152 fps 0%
Dell Precision 5690
NVIDIA RTX 5000 Ada Generation Laptop GPU, Intel Core Ultra 9 185H
140.89 fps -7%
HP ZBook Fury 16 G11
NVIDIA RTX 3500 Ada Generation Laptop GPU, Intel Core i9-14900HX
124.65 fps -18%
Dell Precision 5000 5490
NVIDIA RTX 3000 Ada Generation Laptop GPU, Intel Core Ultra 9 185H
96.95 fps -36%
HP ZBook Fury 16 G9
NVIDIA RTX A5500 Laptop GPU, Intel Core i9-12950HX
61.01 fps -60%
Lenovo ThinkPad P16v G1 AMD
NVIDIA RTX A1000 Laptop GPU, AMD Ryzen 7 PRO 7840HS
57.3 fps -62%
HP ZBook Power 15 G10
NVIDIA RTX 2000 Ada Generation Laptop GPU, AMD Ryzen 7 PRO 7840HS
50.48 fps -67%
MSI CreatorPro Z16P B12UKST
NVIDIA RTX A3000 Laptop GPU, Intel Core i7-12700H
46.59 fps -69%
Asus ExpertBook B6 Flip B6602FC2
NVIDIA RTX A2000 Laptop GPU, Intel Core i9-12950HX
35.9 fps -76%
Lenovo ThinkPad P16s G2 21K9000CGE
AMD Radeon 780M, AMD Ryzen 7 PRO 7840U
33.3 fps -78%
Lenovo ThinkPad P1 G4-20Y4Z9DVUS
NVIDIA T1200 Laptop GPU, Intel Core i7-11800H
24.85 fps -84%
HP ZBook Firefly 16 G9-6B897EA
NVIDIA T550 Laptop GPU, Intel Core i7-1265U
15.4 fps -90%
1920x1080 Siemens NX (snx-04)
Lenovo ThinkPad P16 Gen 2
NVIDIA RTX 4000 Ada Generation Laptop GPU, Intel Core i7-14700HX
550.21 fps
Усредн. модель с NVIDIA RTX 4000 Ada Generation Laptop GPU
  ()
550 fps 0%
Dell Precision 5690
NVIDIA RTX 5000 Ada Generation Laptop GPU, Intel Core Ultra 9 185H
525.61 fps -4%
HP ZBook Fury 16 G11
NVIDIA RTX 3500 Ada Generation Laptop GPU, Intel Core i9-14900HX
436.85 fps -21%
HP ZBook Power 15 G10
NVIDIA RTX 2000 Ada Generation Laptop GPU, AMD Ryzen 7 PRO 7840HS
315.31 fps -43%
Dell Precision 5000 5490
NVIDIA RTX 3000 Ada Generation Laptop GPU, Intel Core Ultra 9 185H
314.39 fps -43%
HP ZBook Fury 16 G9
NVIDIA RTX A5500 Laptop GPU, Intel Core i9-12950HX
308.7 fps -44%
MSI CreatorPro Z16P B12UKST
NVIDIA RTX A3000 Laptop GPU, Intel Core i7-12700H
284.49 fps -48%
Asus ExpertBook B6 Flip B6602FC2
NVIDIA RTX A2000 Laptop GPU, Intel Core i9-12950HX
215 fps -61%
Lenovo ThinkPad P16v G1 AMD
NVIDIA RTX A1000 Laptop GPU, AMD Ryzen 7 PRO 7840HS
194.8 fps -65%
Lenovo ThinkPad P1 G4-20Y4Z9DVUS
NVIDIA T1200 Laptop GPU, Intel Core i7-11800H
164.1 fps -70%
Lenovo ThinkPad P16s G2 21K9000CGE
AMD Radeon 780M, AMD Ryzen 7 PRO 7840U
129.3 fps -76%
HP ZBook Firefly 16 G9-6B897EA
NVIDIA T550 Laptop GPU, Intel Core i7-1265U
99.3 fps -82%
1920x1080 Solidworks (solidworks-07)
Усредн. модель с NVIDIA RTX 4000 Ada Generation Laptop GPU
  ()
341 fps 0%
Lenovo ThinkPad P16 Gen 2
NVIDIA RTX 4000 Ada Generation Laptop GPU, Intel Core i7-14700HX
340.81 fps
Dell Precision 5690
NVIDIA RTX 5000 Ada Generation Laptop GPU, Intel Core Ultra 9 185H
307.21 fps -10%
HP ZBook Fury 16 G11
NVIDIA RTX 3500 Ada Generation Laptop GPU, Intel Core i9-14900HX
289.07 fps -15%
Dell Precision 5000 5490
NVIDIA RTX 3000 Ada Generation Laptop GPU, Intel Core Ultra 9 185H
193.56 fps -43%
3840x2160 Solidworks (solidworks-07) 4k
Усредн. модель с NVIDIA RTX 4000 Ada Generation Laptop GPU
  ()
150.4 fps 0%
Lenovo ThinkPad P16 Gen 2
NVIDIA RTX 4000 Ada Generation Laptop GPU, Intel Core i7-14700HX
150.36 fps
Dell Precision 5690
NVIDIA RTX 5000 Ada Generation Laptop GPU, Intel Core Ultra 9 185H
128.1 fps -15%
HP ZBook Fury 16 G11
NVIDIA RTX 3500 Ada Generation Laptop GPU, Intel Core i9-14900HX
115.99 fps -23%
Dell Precision 5000 5490
NVIDIA RTX 3000 Ada Generation Laptop GPU, Intel Core Ultra 9 185H
77.86 fps -48%
3DMark 11 Performance
39943 баллов
3DMark Cloud Gate Standard Score
61459 баллов
3DMark Fire Strike Score
32984 баллов
3DMark Time Spy Score
16013 баллов
3DMark Steel Nomad Score
3624 баллов
?
Blender
v3.3 Classroom OPTIX/RTX
HP ZBook Firefly 16 G9-6B897EA
NVIDIA T550 Laptop GPU, Intel Core i7-1265U
269 Seconds * -1693%
Lenovo ThinkPad P16v G1 AMD
NVIDIA RTX A1000 Laptop GPU, AMD Ryzen 7 PRO 7840HS
65 Seconds * -333%
MSI CreatorPro Z16P B12UKST
NVIDIA RTX A3000 Laptop GPU, Intel Core i7-12700H
34 Seconds * -127%
HP ZBook Power 16 G11 A
NVIDIA RTX 2000 Ada Generation Laptop GPU, AMD Ryzen 7 8845HS
31 Seconds * -107%
Lenovo ThinkPad P1 G6-21FV000DGE
NVIDIA RTX 2000 Ada Generation Laptop GPU, Intel Core i9-13900H
28 Seconds * -87%
HP ZBook Fury 16 G9
NVIDIA RTX A5500 Laptop GPU, Intel Core i9-12950HX
25 Seconds * -67%
Lenovo ThinkPad P16 G2 21FA000FGE
NVIDIA RTX 2000 Ada Generation Laptop GPU, Intel Core i7-13700HX
25 Seconds * -67%
Lenovo ThinkPad P1 Gen 7 21KV001SGE
NVIDIA GeForce RTX 4060 Laptop GPU, Intel Core Ultra 7 155H
24 Seconds * -60%
Lenovo ThinkPad P16 G1 RTX A5500
NVIDIA RTX A5500 Laptop GPU, Intel Core i9-12950HX
21 Seconds * -40%
HP ZBook Fury 16 G11
NVIDIA RTX 3500 Ada Generation Laptop GPU, Intel Core i9-14900HX
21 Seconds * -40%
Lenovo ThinkPad P1 G6 21FV001KUS
NVIDIA GeForce RTX 4080 Laptop GPU, Intel Core i7-13800H
16 Seconds * -7%
Lenovo ThinkPad P16 Gen 2
NVIDIA RTX 4000 Ada Generation Laptop GPU, Intel Core i7-14700HX
15 Seconds *
Усредн. модель с NVIDIA RTX 4000 Ada Generation Laptop GPU
  ()
15 Seconds * -0%
Dell Precision 5690
NVIDIA RTX 5000 Ada Generation Laptop GPU, Intel Core Ultra 9 185H
14 Seconds * +7%
v3.3 Classroom CUDA
HP ZBook Firefly 16 G9-6B897EA
NVIDIA T550 Laptop GPU, Intel Core i7-1265U
285 Seconds * -1195%
Lenovo ThinkPad P16 G2 21FA000FGE
NVIDIA RTX 2000 Ada Generation Laptop GPU, Intel Core i7-13700HX
155 Seconds * -605%
Lenovo ThinkPad P16v G1 AMD
NVIDIA RTX A1000 Laptop GPU, AMD Ryzen 7 PRO 7840HS
108 Seconds * -391%
MSI CreatorPro Z16P B12UKST
NVIDIA RTX A3000 Laptop GPU, Intel Core i7-12700H
60 Seconds * -173%
HP ZBook Power 16 G11 A
NVIDIA RTX 2000 Ada Generation Laptop GPU, AMD Ryzen 7 8845HS
56 Seconds * -155%
Lenovo ThinkPad P1 G6-21FV000DGE
NVIDIA RTX 2000 Ada Generation Laptop GPU, Intel Core i9-13900H
51 Seconds * -132%
Lenovo ThinkPad P1 Gen 7 21KV001SGE
NVIDIA GeForce RTX 4060 Laptop GPU, Intel Core Ultra 7 155H
42 Seconds * -91%
HP ZBook Fury 16 G9
NVIDIA RTX A5500 Laptop GPU, Intel Core i9-12950HX
40 Seconds * -82%
Lenovo ThinkPad P16 G1 RTX A5500
NVIDIA RTX A5500 Laptop GPU, Intel Core i9-12950HX
35 Seconds * -59%
HP ZBook Fury 16 G11
NVIDIA RTX 3500 Ada Generation Laptop GPU, Intel Core i9-14900HX
33 Seconds * -50%
Lenovo ThinkPad P1 G6 21FV001KUS
NVIDIA GeForce RTX 4080 Laptop GPU, Intel Core i7-13800H
27 Seconds * -23%
Dell Precision 5690
NVIDIA RTX 5000 Ada Generation Laptop GPU, Intel Core Ultra 9 185H
23 Seconds * -5%
Lenovo ThinkPad P16 Gen 2
NVIDIA RTX 4000 Ada Generation Laptop GPU, Intel Core i7-14700HX
22 Seconds *
Усредн. модель с NVIDIA RTX 4000 Ada Generation Laptop GPU
  ()
22 Seconds * -0%
v3.3 Classroom CPU
HP ZBook Firefly 16 G9-6B897EA
NVIDIA T550 Laptop GPU, Intel Core i7-1265U
1326 Seconds * -446%
Dell Precision 5690
NVIDIA RTX 5000 Ada Generation Laptop GPU, Intel Core Ultra 9 185H
386 Seconds * -59%
Lenovo ThinkPad P16s G2 21K9000CGE
AMD Radeon 780M, AMD Ryzen 7 PRO 7840U
354 Seconds * -46%
HP ZBook Power 16 G11 A
NVIDIA RTX 2000 Ada Generation Laptop GPU, AMD Ryzen 7 8845HS
347 Seconds * -43%
MSI CreatorPro Z16P B12UKST
NVIDIA RTX A3000 Laptop GPU, Intel Core i7-12700H
339 Seconds * -40%
Lenovo ThinkPad P1 G6 21FV001KUS
NVIDIA GeForce RTX 4080 Laptop GPU, Intel Core i7-13800H
337 Seconds * -39%
Lenovo ThinkPad P1 G6-21FV000DGE
NVIDIA RTX 2000 Ada Generation Laptop GPU, Intel Core i9-13900H
329 Seconds * -35%
Lenovo ThinkPad P16v G1 AMD
NVIDIA RTX A1000 Laptop GPU, AMD Ryzen 7 PRO 7840HS
329 Seconds * -35%
HP ZBook Fury 16 G9
NVIDIA RTX A5500 Laptop GPU, Intel Core i9-12950HX
302 Seconds * -24%
Lenovo ThinkPad P1 Gen 7 21KV001SGE
NVIDIA GeForce RTX 4060 Laptop GPU, Intel Core Ultra 7 155H
297 Seconds * -22%
Lenovo ThinkPad P16 G2 21FA000FGE
NVIDIA RTX 2000 Ada Generation Laptop GPU, Intel Core i7-13700HX
291 Seconds * -20%
Lenovo ThinkPad P16 G1 RTX A5500
NVIDIA RTX A5500 Laptop GPU, Intel Core i9-12950HX
273 Seconds * -12%
HP ZBook Fury 16 G11
NVIDIA RTX 3500 Ada Generation Laptop GPU, Intel Core i9-14900HX
246 Seconds * -1%
Lenovo ThinkPad P16 Gen 2
NVIDIA RTX 4000 Ada Generation Laptop GPU, Intel Core i7-14700HX
243 Seconds *
Усредн. модель с NVIDIA RTX 4000 Ada Generation Laptop GPU
  ()
243 Seconds * -0%

* ... меньше = лучше

Игры

Хотя RTX 4000 Ada и не оптимизирована для игр, она все равно является мощной, особенно если учесть ее потолок в 130 Вт ТГП. Игровая производительность наиболее похожа на производительность игрового ноутбука высокого класса, работающего на мобильной GeForce RTX 4080.

Performance Rating - Percent
Lenovo ThinkPad P16 Gen 2
Intel Core i7-14700HX, NVIDIA RTX 4000 Ada Generation Laptop GPU
100 pt
Dell Precision 5690 -1!
Intel Core Ultra 9 185H, NVIDIA RTX 5000 Ada Generation Laptop GPU
87.3 pt
Lenovo ThinkPad P16 G1 RTX A5500 -1!
Intel Core i9-12950HX, NVIDIA RTX A5500 Laptop GPU
86.7 pt
Lenovo ThinkPad P16 G2 21FA000FGE -1!
Intel Core i7-13700HX, NVIDIA RTX 2000 Ada Generation Laptop GPU
74.2 pt
HP ZBook Power 16 G11 A
AMD Ryzen 7 8845HS, NVIDIA RTX 2000 Ada Generation Laptop GPU
56.4 pt
Lenovo ThinkPad P16s G2 21K9000CGE -1!
AMD Ryzen 7 PRO 7840U, AMD Radeon 780M
24.4 pt
Baldur's Gate 3 - 1920x1080 Ultra Preset
Lenovo ThinkPad P16 Gen 2
Intel Core i7-14700HX, NVIDIA RTX 4000 Ada Generation Laptop GPU
137 fps
Dell Precision 5690
Intel Core Ultra 9 185H, NVIDIA RTX 5000 Ada Generation Laptop GPU
134.6 fps -2%
HP ZBook Power 16 G11 A
AMD Ryzen 7 8845HS, NVIDIA RTX 2000 Ada Generation Laptop GPU
66.1 fps -52%
GTA V - 1920x1080 Highest Settings possible AA:4xMSAA + FX AF:16x
Lenovo ThinkPad P16 Gen 2
Intel Core i7-14700HX, NVIDIA RTX 4000 Ada Generation Laptop GPU
125.6 (3.9min, 83.3P1) fps
Lenovo ThinkPad P16 G1 RTX A5500
Intel Core i9-12950HX, NVIDIA RTX A5500 Laptop GPU
124.4 (5.12min, 90.9P1) fps -1%
Lenovo ThinkPad P16 G2 21FA000FGE
Intel Core i7-13700HX, NVIDIA RTX 2000 Ada Generation Laptop GPU
98 (18.5min, 66.7P1) fps -22%
HP ZBook Power 16 G11 A
AMD Ryzen 7 8845HS, NVIDIA RTX 2000 Ada Generation Laptop GPU
90.3 (5.49min, 55.6P1) fps -28%
Lenovo ThinkPad P16s G2 21K9000CGE
AMD Ryzen 7 PRO 7840U, AMD Radeon 780M
27.3 (2.88min, 18.5P1) fps -78%
Final Fantasy XV Benchmark - 1920x1080 High Quality
Lenovo ThinkPad P16 Gen 2
Intel Core i7-14700HX, NVIDIA RTX 4000 Ada Generation Laptop GPU
150 fps
Dell Precision 5690
Intel Core Ultra 9 185H, NVIDIA RTX 5000 Ada Generation Laptop GPU
132.5 fps -12%
Lenovo ThinkPad P16 G1 RTX A5500
Intel Core i9-12950HX, NVIDIA RTX A5500 Laptop GPU
113.1 fps -25%
Lenovo ThinkPad P16 G2 21FA000FGE
Intel Core i7-13700HX, NVIDIA RTX 2000 Ada Generation Laptop GPU
84.2 fps -44%
HP ZBook Power 16 G11 A
AMD Ryzen 7 8845HS, NVIDIA RTX 2000 Ada Generation Laptop GPU
66.3 fps -56%
Lenovo ThinkPad P16s G2 21K9000CGE
AMD Ryzen 7 PRO 7840U, AMD Radeon 780M
25.2 fps -83%
Strange Brigade - 1920x1080 ultra AA:ultra AF:16
Lenovo ThinkPad P16 Gen 2
Intel Core i7-14700HX, NVIDIA RTX 4000 Ada Generation Laptop GPU
292 (19.8min, 216P1) fps
Dell Precision 5690
Intel Core Ultra 9 185H, NVIDIA RTX 5000 Ada Generation Laptop GPU
252 (95min, 179P1) fps -14%
Lenovo ThinkPad P16 G1 RTX A5500
Intel Core i9-12950HX, NVIDIA RTX A5500 Laptop GPU
197.7 (95.3min, 144.1P1) fps -32%
Lenovo ThinkPad P16 G2 21FA000FGE
Intel Core i7-13700HX, NVIDIA RTX 2000 Ada Generation Laptop GPU
158.4 (22.5min, 117.2P1) fps -46%
HP ZBook Power 16 G11 A
AMD Ryzen 7 8845HS, NVIDIA RTX 2000 Ada Generation Laptop GPU
138.5 (80.1min, 104.4P1) fps -53%
Lenovo ThinkPad P16s G2 21K9000CGE
AMD Ryzen 7 PRO 7840U, AMD Radeon 780M
46.9 (29.8min, 35.7P1) fps -84%
Dota 2 Reborn - 1920x1080 ultra (3/3) best looking
Lenovo ThinkPad P16 Gen 2
Intel Core i7-14700HX, NVIDIA RTX 4000 Ada Generation Laptop GPU
164.4 (142.6min) fps
Lenovo ThinkPad P16 G1 RTX A5500
Intel Core i9-12950HX, NVIDIA RTX A5500 Laptop GPU
156.3 (136.6min) fps -5%
Lenovo ThinkPad P16 G2 21FA000FGE
Intel Core i7-13700HX, NVIDIA RTX 2000 Ada Generation Laptop GPU
150.2 (130.8min) fps -9%
Dell Precision 5690
Intel Core Ultra 9 185H, NVIDIA RTX 5000 Ada Generation Laptop GPU
139.9 (118min) fps -15%
HP ZBook Power 16 G11 A
AMD Ryzen 7 8845HS, NVIDIA RTX 2000 Ada Generation Laptop GPU
119.9 (104.6min) fps -27%
Lenovo ThinkPad P16s G2 21K9000CGE
AMD Ryzen 7 PRO 7840U, AMD Radeon 780M
69.5 (59.8min) fps -58%
X-Plane 11.11 - 1920x1080 high (fps_test=3)
Lenovo ThinkPad P16 Gen 2
Intel Core i7-14700HX, NVIDIA RTX 4000 Ada Generation Laptop GPU
113.1 fps
Lenovo ThinkPad P16 G1 RTX A5500
Intel Core i9-12950HX, NVIDIA RTX A5500 Laptop GPU
108.8 fps -4%
Lenovo ThinkPad P16 G2 21FA000FGE
Intel Core i7-13700HX, NVIDIA RTX 2000 Ada Generation Laptop GPU
103.4 fps -9%
Dell Precision 5690
Intel Core Ultra 9 185H, NVIDIA RTX 5000 Ada Generation Laptop GPU
88.7 fps -22%
HP ZBook Power 16 G11 A
AMD Ryzen 7 8845HS, NVIDIA RTX 2000 Ada Generation Laptop GPU
60.6 fps -46%
Lenovo ThinkPad P16s G2 21K9000CGE
AMD Ryzen 7 PRO 7840U, AMD Radeon 780M
28.4 fps -75%
Lenovo ThinkPad P16s G2 21K9000CGE
AMD Ryzen 7 PRO 7840U, AMD Radeon 780M
28.1 fps -75%
Baldur's Gate 3
1920x1080 High Preset
Lenovo ThinkPad P16 Gen 2
Intel Core i7-14700HX, NVIDIA RTX 4000 Ada Generation Laptop GPU
141.6 fps
Усредн. модель с NVIDIA RTX 4000 Ada Generation Laptop GPU
  ()
141.6 fps 0%
Dell Precision 5690
Intel Core Ultra 9 185H, NVIDIA RTX 5000 Ada Generation Laptop GPU
139.2 fps -2%
HP ZBook Fury 16 G11
Intel Core i9-14900HX, NVIDIA RTX 3500 Ada Generation Laptop GPU
118.6 fps -16%
Dell Precision 5000 5490
Intel Core Ultra 9 185H, NVIDIA RTX 3000 Ada Generation Laptop GPU
70.1 fps -50%
1920x1080 Ultra Preset
Lenovo ThinkPad P16 Gen 2
Intel Core i7-14700HX, NVIDIA RTX 4000 Ada Generation Laptop GPU
137 fps
Усредн. модель с NVIDIA RTX 4000 Ada Generation Laptop GPU
  ()
137 fps 0%
Dell Precision 5690
Intel Core Ultra 9 185H, NVIDIA RTX 5000 Ada Generation Laptop GPU
134.6 fps -2%
HP ZBook Fury 16 G11
Intel Core i9-14900HX, NVIDIA RTX 3500 Ada Generation Laptop GPU
117.3 fps -14%
Dell Precision 5000 5490
Intel Core Ultra 9 185H, NVIDIA RTX 3000 Ada Generation Laptop GPU
68.8 fps -50%
2560x1440 Ultra Preset
Dell Precision 5690
Intel Core Ultra 9 185H, NVIDIA RTX 5000 Ada Generation Laptop GPU
100.5 fps +11%
Lenovo ThinkPad P16 Gen 2
Intel Core i7-14700HX, NVIDIA RTX 4000 Ada Generation Laptop GPU
90.7 fps
Усредн. модель с NVIDIA RTX 4000 Ada Generation Laptop GPU
  ()
90.7 fps 0%
HP ZBook Fury 16 G11
Intel Core i9-14900HX, NVIDIA RTX 3500 Ada Generation Laptop GPU
80.2 fps -12%
Final Fantasy XV Benchmark
1280x720 Lite Quality
Lenovo ThinkPad P16 Gen 2
Intel Core i7-14700HX, NVIDIA RTX 4000 Ada Generation Laptop GPU
207 fps
Усредн. модель с NVIDIA RTX 4000 Ada Generation Laptop GPU
  ()
207 fps 0%
HP ZBook Fury 16 G11
Intel Core i9-14900HX, NVIDIA RTX 3500 Ada Generation Laptop GPU
200 fps -3%
Dell Precision 5690
Intel Core Ultra 9 185H, NVIDIA RTX 5000 Ada Generation Laptop GPU
196.6 fps -5%
HP ZBook Fury 16 G9
Intel Core i9-12950HX, NVIDIA RTX A5500 Laptop GPU
180.1 fps -13%
MSI CreatorPro Z16P B12UKST
Intel Core i7-12700H, NVIDIA RTX A3000 Laptop GPU
176 fps -15%
HP ZBook Power 15 G10
AMD Ryzen 7 PRO 7840HS, NVIDIA RTX 2000 Ada Generation Laptop GPU
173.3 fps -16%
Asus ExpertBook B6 Flip B6602FC2
Intel Core i9-12950HX, NVIDIA RTX A2000 Laptop GPU
164.3 fps -21%
Lenovo ThinkPad P16v G1 AMD
AMD Ryzen 7 PRO 7840HS, NVIDIA RTX A1000 Laptop GPU
129.2 fps -38%
Dell Precision 5000 5490
Intel Core Ultra 9 185H, NVIDIA RTX 3000 Ada Generation Laptop GPU
128.8 fps -38%
Lenovo ThinkPad P1 G4-20Y4Z9DVUS
Intel Core i7-11800H, NVIDIA T1200 Laptop GPU
102 fps -51%
Lenovo ThinkPad P16s G2 21K9000CGE
AMD Ryzen 7 PRO 7840U, AMD Radeon 780M
74.9 fps -64%
HP ZBook Firefly 16 G9-6B897EA
Intel Core i7-1265U, NVIDIA T550 Laptop GPU
60.7 fps -71%
1920x1080 Standard Quality
Lenovo ThinkPad P16 Gen 2
Intel Core i7-14700HX, NVIDIA RTX 4000 Ada Generation Laptop GPU
185.3 fps
Усредн. модель с NVIDIA RTX 4000 Ada Generation Laptop GPU
  ()
185.3 fps 0%
HP ZBook Fury 16 G11
Intel Core i9-14900HX, NVIDIA RTX 3500 Ada Generation Laptop GPU
167.6 fps -10%
Dell Precision 5690
Intel Core Ultra 9 185H, NVIDIA RTX 5000 Ada Generation Laptop GPU
165.4 fps -11%
HP ZBook Fury 16 G9
Intel Core i9-12950HX, NVIDIA RTX A5500 Laptop GPU
131.6 fps -29%
HP ZBook Power 15 G10
AMD Ryzen 7 PRO 7840HS, NVIDIA RTX 2000 Ada Generation Laptop GPU
93.5 fps -50%
Dell Precision 5000 5490
Intel Core Ultra 9 185H, NVIDIA RTX 3000 Ada Generation Laptop GPU
91.9 fps -50%
Asus ExpertBook B6 Flip B6602FC2
Intel Core i9-12950HX, NVIDIA RTX A2000 Laptop GPU
90.5 fps -51%
MSI CreatorPro Z16P B12UKST
Intel Core i7-12700H, NVIDIA RTX A3000 Laptop GPU
83.8 fps -55%
Lenovo ThinkPad P16v G1 AMD
AMD Ryzen 7 PRO 7840HS, NVIDIA RTX A1000 Laptop GPU
67.9 fps -63%
Lenovo ThinkPad P1 G4-20Y4Z9DVUS
Intel Core i7-11800H, NVIDIA T1200 Laptop GPU
56.5 fps -70%
Lenovo ThinkPad P16s G2 21K9000CGE
AMD Ryzen 7 PRO 7840U, AMD Radeon 780M
34.3 fps -81%
HP ZBook Firefly 16 G9-6B897EA
Intel Core i7-1265U, NVIDIA T550 Laptop GPU
31.2 fps -83%
1920x1080 High Quality
Lenovo ThinkPad P16 Gen 2
Intel Core i7-14700HX, NVIDIA RTX 4000 Ada Generation Laptop GPU
150 fps
Усредн. модель с NVIDIA RTX 4000 Ada Generation Laptop GPU
  ()
150 fps 0%
Dell Precision 5690
Intel Core Ultra 9 185H, NVIDIA RTX 5000 Ada Generation Laptop GPU
132.5 fps -12%
HP ZBook Fury 16 G11
Intel Core i9-14900HX, NVIDIA RTX 3500 Ada Generation Laptop GPU
128.9 fps -14%
HP ZBook Fury 16 G9
Intel Core i9-12950HX, NVIDIA RTX A5500 Laptop GPU
103.5 fps -31%
Dell Precision 5000 5490
Intel Core Ultra 9 185H, NVIDIA RTX 3000 Ada Generation Laptop GPU
72.9 fps -51%
HP ZBook Power 15 G10
AMD Ryzen 7 PRO 7840HS, NVIDIA RTX 2000 Ada Generation Laptop GPU
67.7 fps -55%
MSI CreatorPro Z16P B12UKST
Intel Core i7-12700H, NVIDIA RTX A3000 Laptop GPU
64.3 fps -57%
Asus ExpertBook B6 Flip B6602FC2
Intel Core i9-12950HX, NVIDIA RTX A2000 Laptop GPU
64 fps -57%
Lenovo ThinkPad P16v G1 AMD
AMD Ryzen 7 PRO 7840HS, NVIDIA RTX A1000 Laptop GPU
48.3 fps -68%
Lenovo ThinkPad P1 G4-20Y4Z9DVUS
Intel Core i7-11800H, NVIDIA T1200 Laptop GPU
39 fps -74%
Lenovo ThinkPad P16s G2 21K9000CGE
AMD Ryzen 7 PRO 7840U, AMD Radeon 780M
25.2 fps -83%
HP ZBook Firefly 16 G9-6B897EA
Intel Core i7-1265U, NVIDIA T550 Laptop GPU
22.3 fps -85%
2560x1440 High Quality
Lenovo ThinkPad P16 Gen 2
Intel Core i7-14700HX, NVIDIA RTX 4000 Ada Generation Laptop GPU
119.5 fps
Усредн. модель с NVIDIA RTX 4000 Ada Generation Laptop GPU
  ()
119.5 fps 0%
Dell Precision 5690
Intel Core Ultra 9 185H, NVIDIA RTX 5000 Ada Generation Laptop GPU
103.8 fps -13%
HP ZBook Fury 16 G11
Intel Core i9-14900HX, NVIDIA RTX 3500 Ada Generation Laptop GPU
97.5 fps -18%
HP ZBook Fury 16 G9
Intel Core i9-12950HX, NVIDIA RTX A5500 Laptop GPU
75.1 fps -37%
HP ZBook Power 15 G10
AMD Ryzen 7 PRO 7840HS, NVIDIA RTX 2000 Ada Generation Laptop GPU
50.3 fps -58%
Asus ExpertBook B6 Flip B6602FC2
Intel Core i9-12950HX, NVIDIA RTX A2000 Laptop GPU
47.1 fps -61%
MSI CreatorPro Z16P B12UKST
Intel Core i7-12700H, NVIDIA RTX A3000 Laptop GPU
45.6 fps -62%
Lenovo ThinkPad P1 G4-20Y4Z9DVUS
Intel Core i7-11800H, NVIDIA T1200 Laptop GPU
26.6 fps -78%
Lenovo ThinkPad P16s G2 21K9000CGE
AMD Ryzen 7 PRO 7840U, AMD Radeon 780M
17.7 fps -85%
GTA V
1920x1080 Highest Settings possible AA:4xMSAA + FX AF:16x
Lenovo ThinkPad P16 Gen 2
Intel Core i7-14700HX, NVIDIA RTX 4000 Ada Generation Laptop GPU
125.6 (3.9min, 83.3P1) fps
Усредн. модель с NVIDIA RTX 4000 Ada Generation Laptop GPU
  ()
125.6 fps 0%
HP ZBook Fury 16 G9
Intel Core i9-12950HX, NVIDIA RTX A5500 Laptop GPU
118.5 (5.38min, 52.6P1) fps -6%
HP ZBook Fury 16 G11
Intel Core i9-14900HX, NVIDIA RTX 3500 Ada Generation Laptop GPU
115.5 (4.64min, 76.9P1) fps -8%
MSI CreatorPro Z16P B12UKST
Intel Core i7-12700H, NVIDIA RTX A3000 Laptop GPU
95.3 (6.43min, 66.7P1) fps -24%
HP ZBook Power 15 G10
AMD Ryzen 7 PRO 7840HS, NVIDIA RTX 2000 Ada Generation Laptop GPU
86.2 (7.39min, 55.6P1) fps -31%
Asus ExpertBook B6 Flip B6602FC2
Intel Core i9-12950HX, NVIDIA RTX A2000 Laptop GPU
84 (7.33min, 55.6P1) fps -33%
Lenovo ThinkPad P16v G1 AMD
AMD Ryzen 7 PRO 7840HS, NVIDIA RTX A1000 Laptop GPU
62.7 (5.69min, 41.7P1) fps -50%
HP ZBook Firefly 16 G9-6B897EA
Intel Core i7-1265U, NVIDIA T550 Laptop GPU
29.2 (9.17min, 18.9P1) fps -77%
Lenovo ThinkPad P16s G2 21K9000CGE
AMD Ryzen 7 PRO 7840U, AMD Radeon 780M
27.3 (2.88min, 18.5P1) fps -78%
2560x1440 Highest Settings possible AA:4xMSAA + FX AF:16x
Lenovo ThinkPad P16 Gen 2
Intel Core i7-14700HX, NVIDIA RTX 4000 Ada Generation Laptop GPU
118.7 (4.3min, 83.3P1) fps
Усредн. модель с NVIDIA RTX 4000 Ada Generation Laptop GPU
  ()
118.7 fps 0%
HP ZBook Fury 16 G11
Intel Core i9-14900HX, NVIDIA RTX 3500 Ada Generation Laptop GPU
99.7 (3.73min, 66.7P1) fps -16%
HP ZBook Fury 16 G11
Intel Core i9-14900HX, NVIDIA RTX 3500 Ada Generation Laptop GPU
97.5 (16.9min, 66.7P1) fps -18%
HP ZBook Fury 16 G9
Intel Core i9-12950HX, NVIDIA RTX A5500 Laptop GPU
97.5 (5min, 62.5P1) fps -18%
MSI CreatorPro Z16P B12UKST
Intel Core i7-12700H, NVIDIA RTX A3000 Laptop GPU
71.3 (7.74min, 50P1) fps -40%
HP ZBook Power 15 G10
AMD Ryzen 7 PRO 7840HS, NVIDIA RTX 2000 Ada Generation Laptop GPU
60.6 (9.07min, 41.7P1) fps -49%
Lenovo ThinkPad P16s G2 21K9000CGE
AMD Ryzen 7 PRO 7840U, AMD Radeon 780M
19.1 (4.43min, 13P1) fps -84%
1920x1080 High/On (Advanced Graphics Off) AA:2xMSAA + FX AF:8x
Lenovo ThinkPad P16 Gen 2
Intel Core i7-14700HX, NVIDIA RTX 4000 Ada Generation Laptop GPU
179.4 (2.13min, 125P1) fps
Усредн. модель с NVIDIA RTX 4000 Ada Generation Laptop GPU
  ()
179.4 fps 0%
HP ZBook Fury 16 G9
Intel Core i9-12950HX, NVIDIA RTX A5500 Laptop GPU
170.7 (3.17min, 40P1) fps -5%
HP ZBook Fury 16 G11
Intel Core i9-14900HX, NVIDIA RTX 3500 Ada Generation Laptop GPU
170.1 (2.88min, 100P1) fps -5%
MSI CreatorPro Z16P B12UKST
Intel Core i7-12700H, NVIDIA RTX A3000 Laptop GPU
168.5 (3.91min, 111.1P1) fps -6%
Asus ExpertBook B6 Flip B6602FC2
Intel Core i9-12950HX, NVIDIA RTX A2000 Laptop GPU
163.5 (3.57min, 111.1P1) fps -9%
HP ZBook Power 15 G10
AMD Ryzen 7 PRO 7840HS, NVIDIA RTX 2000 Ada Generation Laptop GPU
157.7 (4.55min, 111.1P1) fps -12%
Lenovo ThinkPad P16v G1 AMD
AMD Ryzen 7 PRO 7840HS, NVIDIA RTX A1000 Laptop GPU
129.4 (13.7min, 90.9P1) fps -28%
Lenovo ThinkPad P16s G2 21K9000CGE
AMD Ryzen 7 PRO 7840U, AMD Radeon 780M
64.5 (1.909min, 43.5P1) fps -64%
HP ZBook Firefly 16 G9-6B897EA
Intel Core i7-1265U, NVIDIA T550 Laptop GPU
61.5 (8.14min, 41.7P1) fps -66%
Dota 2 Reborn
1920x1080 high (2/3)
Lenovo ThinkPad P16 Gen 2
Intel Core i7-14700HX, NVIDIA RTX 4000 Ada Generation Laptop GPU
185.2 (155.1min) fps
Усредн. модель с NVIDIA RTX 4000 Ada Generation Laptop GPU
  ()
185.2 fps 0%
HP ZBook Fury 16 G9
Intel Core i9-12950HX, NVIDIA RTX A5500 Laptop GPU
162.4 (139.1min) fps -12%
HP ZBook Fury 16 G11
Intel Core i9-14900HX, NVIDIA RTX 3500 Ada Generation Laptop GPU
162.1 (138.3min) fps -12%
MSI CreatorPro Z16P B12UKST
Intel Core i7-12700H, NVIDIA RTX A3000 Laptop GPU
155.8 (136min) fps -16%
Asus ExpertBook B6 Flip B6602FC2
Intel Core i9-12950HX, NVIDIA RTX A2000 Laptop GPU
154.3 (133.3min) fps -17%
Dell Precision 5690
Intel Core Ultra 9 185H, NVIDIA RTX 5000 Ada Generation Laptop GPU
150.1 (128.5min) fps -19%
HP ZBook Power 15 G10
AMD Ryzen 7 PRO 7840HS, NVIDIA RTX 2000 Ada Generation Laptop GPU
136.9 (120min) fps -26%
Dell Precision 5000 5490
Intel Core Ultra 9 185H, NVIDIA RTX 3000 Ada Generation Laptop GPU
136 (107.4min) fps -27%
Lenovo ThinkPad P1 G4-20Y4Z9DVUS
Intel Core i7-11800H, NVIDIA T1200 Laptop GPU
128 (112.6min) fps -31%
Lenovo ThinkPad P16v G1 AMD
AMD Ryzen 7 PRO 7840HS, NVIDIA RTX A1000 Laptop GPU
125 (110.6min) fps -33%
HP ZBook Firefly 16 G9-6B897EA
Intel Core i7-1265U, NVIDIA T550 Laptop GPU
92.1 (80.9min) fps -50%
Lenovo ThinkPad P16s G2 21K9000CGE
AMD Ryzen 7 PRO 7840U, AMD Radeon 780M
82.1 (69.8min) fps -56%
1920x1080 ultra (3/3) best looking
Lenovo ThinkPad P16 Gen 2
Intel Core i7-14700HX, NVIDIA RTX 4000 Ada Generation Laptop GPU
164.4 (142.6min) fps
Усредн. модель с NVIDIA RTX 4000 Ada Generation Laptop GPU
  ()
164.4 fps 0%
HP ZBook Fury 16 G11
Intel Core i9-14900HX, NVIDIA RTX 3500 Ada Generation Laptop GPU
153.9 (131.9min) fps -6%
HP ZBook Fury 16 G9
Intel Core i9-12950HX, NVIDIA RTX A5500 Laptop GPU
150.7 (128.4min) fps -8%
MSI CreatorPro Z16P B12UKST
Intel Core i7-12700H, NVIDIA RTX A3000 Laptop GPU
147.1 (127.8min) fps -11%
Asus ExpertBook B6 Flip B6602FC2
Intel Core i9-12950HX, NVIDIA RTX A2000 Laptop GPU
142.5 (119.6min) fps -13%
Dell Precision 5690
Intel Core Ultra 9 185H, NVIDIA RTX 5000 Ada Generation Laptop GPU
139.9 (118min) fps -15%
HP ZBook Power 15 G10
AMD Ryzen 7 PRO 7840HS, NVIDIA RTX 2000 Ada Generation Laptop GPU
132 (115.8min) fps -20%
Dell Precision 5000 5490
Intel Core Ultra 9 185H, NVIDIA RTX 3000 Ada Generation Laptop GPU
123.3 (100.7min) fps -25%
Lenovo ThinkPad P16v G1 AMD
AMD Ryzen 7 PRO 7840HS, NVIDIA RTX A1000 Laptop GPU
118.2 (104.2min) fps -28%
Lenovo ThinkPad P1 G4-20Y4Z9DVUS
Intel Core i7-11800H, NVIDIA T1200 Laptop GPU
116 (100.4min) fps -29%
HP ZBook Firefly 16 G9-6B897EA
Intel Core i7-1265U, NVIDIA T550 Laptop GPU
85.2 (74.6min) fps -48%
Lenovo ThinkPad P16s G2 21K9000CGE
AMD Ryzen 7 PRO 7840U, AMD Radeon 780M
69.5 (59.8min) fps -58%
X-Plane 11.11
1920x1080 med (fps_test=2)
Lenovo ThinkPad P16 Gen 2
Intel Core i7-14700HX, NVIDIA RTX 4000 Ada Generation Laptop GPU
144 fps
Усредн. модель с NVIDIA RTX 4000 Ada Generation Laptop GPU
  ()
144 fps 0%
HP ZBook Fury 16 G11
Intel Core i9-14900HX, NVIDIA RTX 3500 Ada Generation Laptop GPU
137.8 fps -4%
Asus ExpertBook B6 Flip B6602FC2
Intel Core i9-12950HX, NVIDIA RTX A2000 Laptop GPU
131.1 fps -9%
HP ZBook Fury 16 G9
Intel Core i9-12950HX, NVIDIA RTX A5500 Laptop GPU
130.9 fps -9%
MSI CreatorPro Z16P B12UKST
Intel Core i7-12700H, NVIDIA RTX A3000 Laptop GPU
120.7 fps -16%
Dell Precision 5690
Intel Core Ultra 9 185H, NVIDIA RTX 5000 Ada Generation Laptop GPU
113.9 fps -21%
Dell Precision 5000 5490
Intel Core Ultra 9 185H, NVIDIA RTX 3000 Ada Generation Laptop GPU
102.1 fps -29%
Lenovo ThinkPad P1 G4-20Y4Z9DVUS
Intel Core i7-11800H, NVIDIA T1200 Laptop GPU
94 fps -35%
Lenovo ThinkPad P16v G1 AMD
AMD Ryzen 7 PRO 7840HS, NVIDIA RTX A1000 Laptop GPU
88.6 fps -38%
HP ZBook Power 15 G10
AMD Ryzen 7 PRO 7840HS, NVIDIA RTX 2000 Ada Generation Laptop GPU
73 fps -49%
HP ZBook Firefly 16 G9-6B897EA
Intel Core i7-1265U, NVIDIA T550 Laptop GPU
59.4 fps -59%
Lenovo ThinkPad P16s G2 21K9000CGE
AMD Ryzen 7 PRO 7840U, AMD Radeon 780M
35.6 fps -75%
Lenovo ThinkPad P16s G2 21K9000CGE
AMD Ryzen 7 PRO 7840U, AMD Radeon 780M
33.2 fps -77%
1920x1080 high (fps_test=3)
Lenovo ThinkPad P16 Gen 2
Intel Core i7-14700HX, NVIDIA RTX 4000 Ada Generation Laptop GPU
113.1 fps
Усредн. модель с NVIDIA RTX 4000 Ada Generation Laptop GPU
  ()
113.1 fps 0%
HP ZBook Fury 16 G11
Intel Core i9-14900HX, NVIDIA RTX 3500 Ada Generation Laptop GPU
110.9 fps -2%
Asus ExpertBook B6 Flip B6602FC2
Intel Core i9-12950HX, NVIDIA RTX A2000 Laptop GPU
105.1 fps -7%
HP ZBook Fury 16 G9
Intel Core i9-12950HX, NVIDIA RTX A5500 Laptop GPU
103.6 fps -8%
MSI CreatorPro Z16P B12UKST
Intel Core i7-12700H, NVIDIA RTX A3000 Laptop GPU
97.5 fps -14%
Dell Precision 5690
Intel Core Ultra 9 185H, NVIDIA RTX 5000 Ada Generation Laptop GPU
88.7 fps -22%
Dell Precision 5000 5490
Intel Core Ultra 9 185H, NVIDIA RTX 3000 Ada Generation Laptop GPU
76.7 fps -32%
Lenovo ThinkPad P1 G4-20Y4Z9DVUS
Intel Core i7-11800H, NVIDIA T1200 Laptop GPU
75.6 fps -33%
Lenovo ThinkPad P16v G1 AMD
AMD Ryzen 7 PRO 7840HS, NVIDIA RTX A1000 Laptop GPU
71.9 fps -36%
HP ZBook Firefly 16 G9-6B897EA
Intel Core i7-1265U, NVIDIA T550 Laptop GPU
55.5 fps -51%
HP ZBook Power 15 G10
AMD Ryzen 7 PRO 7840HS, NVIDIA RTX 2000 Ada Generation Laptop GPU
52.5 fps -54%
Lenovo ThinkPad P16s G2 21K9000CGE
AMD Ryzen 7 PRO 7840U, AMD Radeon 780M
28.4 fps -75%
Lenovo ThinkPad P16s G2 21K9000CGE
AMD Ryzen 7 PRO 7840U, AMD Radeon 780M
28.1 fps -75%
Far Cry 5
1920x1080 Medium Preset AA:T
Lenovo ThinkPad P16 Gen 2
Intel Core i7-14700HX, NVIDIA RTX 4000 Ada Generation Laptop GPU
148 (111min) fps
Усредн. модель с NVIDIA RTX 4000 Ada Generation Laptop GPU
  ()
148 fps 0%
Dell Precision 5690
Intel Core Ultra 9 185H, NVIDIA RTX 5000 Ada Generation Laptop GPU
134 (107min) fps -9%
HP ZBook Fury 16 G11
Intel Core i9-14900HX, NVIDIA RTX 3500 Ada Generation Laptop GPU
133 (61min) fps -10%
MSI CreatorPro Z16P B12UKST
Intel Core i7-12700H, NVIDIA RTX A3000 Laptop GPU
128 fps -14%
Asus ExpertBook B6 Flip B6602FC2
Intel Core i9-12950HX, NVIDIA RTX A2000 Laptop GPU
111 (99min) fps -25%
HP ZBook Power 15 G10
AMD Ryzen 7 PRO 7840HS, NVIDIA RTX 2000 Ada Generation Laptop GPU
110 (96min) fps -26%
Dell Precision 5000 5490
Intel Core Ultra 9 185H, NVIDIA RTX 3000 Ada Generation Laptop GPU
105 (76min) fps -29%
Lenovo ThinkPad P16v G1 AMD
AMD Ryzen 7 PRO 7840HS, NVIDIA RTX A1000 Laptop GPU
85 fps -43%
Lenovo ThinkPad P16s G2 21K9000CGE
AMD Ryzen 7 PRO 7840U, AMD Radeon 780M
46 (36min) fps -69%
HP ZBook Firefly 16 G9-6B897EA
Intel Core i7-1265U, NVIDIA T550 Laptop GPU
41 fps -72%
1920x1080 High Preset AA:T
Lenovo ThinkPad P16 Gen 2
Intel Core i7-14700HX, NVIDIA RTX 4000 Ada Generation Laptop GPU
138 (100min) fps
Усредн. модель с NVIDIA RTX 4000 Ada Generation Laptop GPU
  ()
138 fps 0%
HP ZBook Fury 16 G11
Intel Core i9-14900HX, NVIDIA RTX 3500 Ada Generation Laptop GPU
135 (99min) fps -2%
Dell Precision 5690
Intel Core Ultra 9 185H, NVIDIA RTX 5000 Ada Generation Laptop GPU
127 (97min) fps -8%
MSI CreatorPro Z16P B12UKST
Intel Core i7-12700H, NVIDIA RTX A3000 Laptop GPU
117 fps -15%
Dell Precision 5000 5490
Intel Core Ultra 9 185H, NVIDIA RTX 3000 Ada Generation Laptop GPU
104 (74min) fps -25%
Asus ExpertBook B6 Flip B6602FC2
Intel Core i9-12950HX, NVIDIA RTX A2000 Laptop GPU
103 (90min) fps -25%
HP ZBook Power 15 G10
AMD Ryzen 7 PRO 7840HS, NVIDIA RTX 2000 Ada Generation Laptop GPU
102 (92min) fps -26%
Lenovo ThinkPad P16v G1 AMD
AMD Ryzen 7 PRO 7840HS, NVIDIA RTX A1000 Laptop GPU
79 fps -43%
Lenovo ThinkPad P16s G2 21K9000CGE
AMD Ryzen 7 PRO 7840U, AMD Radeon 780M
42 (35min) fps -70%
HP ZBook Firefly 16 G9-6B897EA
Intel Core i7-1265U, NVIDIA T550 Laptop GPU
38 fps -72%
1920x1080 Ultra Preset AA:T
Lenovo ThinkPad P16 Gen 2
Intel Core i7-14700HX, NVIDIA RTX 4000 Ada Generation Laptop GPU
128 (95min) fps
Усредн. модель с NVIDIA RTX 4000 Ada Generation Laptop GPU
  ()
128 fps 0%
HP ZBook Fury 16 G11
Intel Core i9-14900HX, NVIDIA RTX 3500 Ada Generation Laptop GPU
127 (94min) fps -1%
Dell Precision 5690
Intel Core Ultra 9 185H, NVIDIA RTX 5000 Ada Generation Laptop GPU
119 (91min) fps -7%
MSI CreatorPro Z16P B12UKST
Intel Core i7-12700H, NVIDIA RTX A3000 Laptop GPU
108 fps -16%
Asus ExpertBook B6 Flip B6602FC2
Intel Core i9-12950HX, NVIDIA RTX A2000 Laptop GPU
96 (86min) fps -25%
Dell Precision 5000 5490
Intel Core Ultra 9 185H, NVIDIA RTX 3000 Ada Generation Laptop GPU
96 (69min) fps -25%
HP ZBook Power 15 G10
AMD Ryzen 7 PRO 7840HS, NVIDIA RTX 2000 Ada Generation Laptop GPU
95 (86min) fps -26%
Lenovo ThinkPad P16v G1 AMD
AMD Ryzen 7 PRO 7840HS, NVIDIA RTX A1000 Laptop GPU
73 fps -43%
Lenovo ThinkPad P16s G2 21K9000CGE
AMD Ryzen 7 PRO 7840U, AMD Radeon 780M
40 (27min) fps -69%
HP ZBook Firefly 16 G9-6B897EA
Intel Core i7-1265U, NVIDIA T550 Laptop GPU
35 fps -73%
2560x1440 Ultra Preset AA:T
Lenovo ThinkPad P16 Gen 2
Intel Core i7-14700HX, NVIDIA RTX 4000 Ada Generation Laptop GPU
125 (93min) fps
Усредн. модель с NVIDIA RTX 4000 Ada Generation Laptop GPU
  ()
125 fps 0%
Dell Precision 5690
Intel Core Ultra 9 185H, NVIDIA RTX 5000 Ada Generation Laptop GPU
113 (88min) fps -10%
HP ZBook Fury 16 G11
Intel Core i9-14900HX, NVIDIA RTX 3500 Ada Generation Laptop GPU
109 (92min) fps -13%
MSI CreatorPro Z16P B12UKST
Intel Core i7-12700H, NVIDIA RTX A3000 Laptop GPU
76 fps -39%
HP ZBook Power 15 G10
AMD Ryzen 7 PRO 7840HS, NVIDIA RTX 2000 Ada Generation Laptop GPU
63 (56min) fps -50%
Lenovo ThinkPad P16s G2 21K9000CGE
AMD Ryzen 7 PRO 7840U, AMD Radeon 780M
27 (24min) fps -78%
Strange Brigade
1920x1080 high AA:high AF:8
Lenovo ThinkPad P16 Gen 2
Intel Core i7-14700HX, NVIDIA RTX 4000 Ada Generation Laptop GPU
323 (18.5min, 237P1) fps
Усредн. модель с NVIDIA RTX 4000 Ada Generation Laptop GPU
  ()
323 fps 0%
Dell Precision 5690
Intel Core Ultra 9 185H, NVIDIA RTX 5000 Ada Generation Laptop GPU
276 (48.4min, 199.7P1) fps -15%
HP ZBook Fury 16 G11
Intel Core i9-14900HX, NVIDIA RTX 3500 Ada Generation Laptop GPU
235 (22.2min, 133.8P1) fps -27%
HP ZBook Fury 16 G9
Intel Core i9-12950HX, NVIDIA RTX A5500 Laptop GPU
190.2 (118.9min, 142.6P1) fps -41%
Dell Precision 5000 5490
Intel Core Ultra 9 185H, NVIDIA RTX 3000 Ada Generation Laptop GPU
151.4 (78.4min, 114.6P1) fps -53%
HP ZBook Power 15 G10
AMD Ryzen 7 PRO 7840HS, NVIDIA RTX 2000 Ada Generation Laptop GPU
148.4 (37.9min, 110.3P1) fps -54%
Asus ExpertBook B6 Flip B6602FC2
Intel Core i9-12950HX, NVIDIA RTX A2000 Laptop GPU
125.9 (32.7min, 94.6P1) fps -61%
MSI CreatorPro Z16P B12UKST
Intel Core i7-12700H, NVIDIA RTX A3000 Laptop GPU
121 fps -63%
Lenovo ThinkPad P16v G1 AMD
AMD Ryzen 7 PRO 7840HS, NVIDIA RTX A1000 Laptop GPU
90.2 (61.5min, 70.1P1) fps -72%
Lenovo ThinkPad P16s G2 21K9000CGE
AMD Ryzen 7 PRO 7840U, AMD Radeon 780M
56.1 (39.3min, 43.6P1) fps -83%
HP ZBook Firefly 16 G9-6B897EA
Intel Core i7-1265U, NVIDIA T550 Laptop GPU
42 fps -87%
1920x1080 ultra AA:ultra AF:16
Lenovo ThinkPad P16 Gen 2
Intel Core i7-14700HX, NVIDIA RTX 4000 Ada Generation Laptop GPU
292 (19.8min, 216P1) fps
Усредн. модель с NVIDIA RTX 4000 Ada Generation Laptop GPU
  ()
292 fps 0%
Dell Precision 5690
Intel Core Ultra 9 185H, NVIDIA RTX 5000 Ada Generation Laptop GPU
252 (95min, 179P1) fps -14%
HP ZBook Fury 16 G11
Intel Core i9-14900HX, NVIDIA RTX 3500 Ada Generation Laptop GPU
223 (52.5min, 159.8P1) fps -24%
HP ZBook Fury 16 G9
Intel Core i9-12950HX, NVIDIA RTX A5500 Laptop GPU
168.6 (63.3min, 124.8P1) fps -42%
HP ZBook Power 15 G10
AMD Ryzen 7 PRO 7840HS, NVIDIA RTX 2000 Ada Generation Laptop GPU
132.5 (80.3min, 100.2P1) fps -55%
Dell Precision 5000 5490
Intel Core Ultra 9 185H, NVIDIA RTX 3000 Ada Generation Laptop GPU
132.5 (69.9min, 101.5P1) fps -55%
Asus ExpertBook B6 Flip B6602FC2
Intel Core i9-12950HX, NVIDIA RTX A2000 Laptop GPU
108.8 (68.6min, 83.3P1) fps -63%
MSI CreatorPro Z16P B12UKST
Intel Core i7-12700H, NVIDIA RTX A3000 Laptop GPU
108 fps -63%
Lenovo ThinkPad P16v G1 AMD
AMD Ryzen 7 PRO 7840HS, NVIDIA RTX A1000 Laptop GPU
78.4 (57.3min, 61.9P1) fps -73%
Lenovo ThinkPad P16s G2 21K9000CGE
AMD Ryzen 7 PRO 7840U, AMD Radeon 780M
46.9 (29.8min, 35.7P1) fps -84%
HP ZBook Firefly 16 G9-6B897EA
Intel Core i7-1265U, NVIDIA T550 Laptop GPU
36 fps -88%
2560x1440 ultra AA:ultra AF:16
Lenovo ThinkPad P16 Gen 2
Intel Core i7-14700HX, NVIDIA RTX 4000 Ada Generation Laptop GPU
210 (18.2min, 167.1P1) fps
Усредн. модель с NVIDIA RTX 4000 Ada Generation Laptop GPU
  ()
210 fps 0%
Dell Precision 5690
Intel Core Ultra 9 185H, NVIDIA RTX 5000 Ada Generation Laptop GPU
190.6 (44.7min, 135.8P1) fps -9%
HP ZBook Fury 16 G11
Intel Core i9-14900HX, NVIDIA RTX 3500 Ada Generation Laptop GPU
159.2 (39.8min, 126.8P1) fps -24%
HP ZBook Fury 16 G9
Intel Core i9-12950HX, NVIDIA RTX A5500 Laptop GPU
122 (88.9min, 98.3P1) fps -42%
HP ZBook Power 15 G10
AMD Ryzen 7 PRO 7840HS, NVIDIA RTX 2000 Ada Generation Laptop GPU
94.1 (60.9min, 75.7P1) fps -55%
MSI CreatorPro Z16P B12UKST
Intel Core i7-12700H, NVIDIA RTX A3000 Laptop GPU
85 fps -60%
Lenovo ThinkPad P16s G2 21K9000CGE
AMD Ryzen 7 PRO 7840U, AMD Radeon 780M
31.7 (21.9min, 25.9P1) fps -85%
Tiny Tina's Wonderlands
1920x1080 High Preset (DX12)
Lenovo ThinkPad P16 Gen 2
Intel Core i7-14700HX, NVIDIA RTX 4000 Ada Generation Laptop GPU
171.4 fps
Усредн. модель с NVIDIA RTX 4000 Ada Generation Laptop GPU
  ()
171.4 fps 0%
Dell Precision 5690
Intel Core Ultra 9 185H, NVIDIA RTX 5000 Ada Generation Laptop GPU
145.5 fps -15%
HP ZBook Fury 16 G11
Intel Core i9-14900HX, NVIDIA RTX 3500 Ada Generation Laptop GPU
137.9 fps -20%
HP ZBook Fury 16 G9
Intel Core i9-12950HX, NVIDIA RTX A5500 Laptop GPU
109.5 fps -36%
Dell Precision 5000 5490
Intel Core Ultra 9 185H, NVIDIA RTX 3000 Ada Generation Laptop GPU
88.5 fps -48%
HP ZBook Power 15 G10
AMD Ryzen 7 PRO 7840HS, NVIDIA RTX 2000 Ada Generation Laptop GPU
77.3 fps -55%
Asus ExpertBook B6 Flip B6602FC2
Intel Core i9-12950HX, NVIDIA RTX A2000 Laptop GPU
74 fps -57%
1920x1080 Badass Preset (DX12)
Lenovo ThinkPad P16 Gen 2
Intel Core i7-14700HX, NVIDIA RTX 4000 Ada Generation Laptop GPU
137.1 fps
Усредн. модель с NVIDIA RTX 4000 Ada Generation Laptop GPU
  ()
137.1 fps 0%
Dell Precision 5690
Intel Core Ultra 9 185H, NVIDIA RTX 5000 Ada Generation Laptop GPU
124 fps -10%
HP ZBook Fury 16 G11
Intel Core i9-14900HX, NVIDIA RTX 3500 Ada Generation Laptop GPU
109.3 fps -20%
HP ZBook Fury 16 G9
Intel Core i9-12950HX, NVIDIA RTX A5500 Laptop GPU
87.5 fps -36%
Dell Precision 5000 5490
Intel Core Ultra 9 185H, NVIDIA RTX 3000 Ada Generation Laptop GPU
70.2 fps -49%
HP ZBook Power 15 G10
AMD Ryzen 7 PRO 7840HS, NVIDIA RTX 2000 Ada Generation Laptop GPU
62.3 fps -55%
Asus ExpertBook B6 Flip B6602FC2
Intel Core i9-12950HX, NVIDIA RTX A2000 Laptop GPU
57 fps -58%
2560x1440 Badass Preset (DX12)
Lenovo ThinkPad P16 Gen 2
Intel Core i7-14700HX, NVIDIA RTX 4000 Ada Generation Laptop GPU
92 fps
Усредн. модель с NVIDIA RTX 4000 Ada Generation Laptop GPU
  ()
92 fps 0%
Dell Precision 5690
Intel Core Ultra 9 185H, NVIDIA RTX 5000 Ada Generation Laptop GPU
87.1 fps -5%
HP ZBook Fury 16 G11
Intel Core i9-14900HX, NVIDIA RTX 3500 Ada Generation Laptop GPU
74.4 fps -19%
HP ZBook Fury 16 G9
Intel Core i9-12950HX, NVIDIA RTX A5500 Laptop GPU
57.9 fps -37%
HP ZBook Power 15 G10
AMD Ryzen 7 PRO 7840HS, NVIDIA RTX 2000 Ada Generation Laptop GPU
43.5 fps -53%
Asus ExpertBook B6 Flip B6602FC2
Intel Core i9-12950HX, NVIDIA RTX A2000 Laptop GPU
38.83 fps -58%
F1 22
1920x1080 High Preset AA:T AF:16x
Lenovo ThinkPad P16 Gen 2
Intel Core i7-14700HX, NVIDIA RTX 4000 Ada Generation Laptop GPU
238 (167min, 127P1) fps
Усредн. модель с NVIDIA RTX 4000 Ada Generation Laptop GPU
  ()
238 fps 0%
Dell Precision 5690
Intel Core Ultra 9 185H, NVIDIA RTX 5000 Ada Generation Laptop GPU
217 (166min, 110P1) fps -9%
HP ZBook Fury 16 G11
Intel Core i9-14900HX, NVIDIA RTX 3500 Ada Generation Laptop GPU
182.8 (143min, 93P1) fps -23%
HP ZBook Fury 16 G9
Intel Core i9-12950HX, NVIDIA RTX A5500 Laptop GPU
170.2 (149min, 97P1) fps -28%
Dell Precision 5000 5490
Intel Core Ultra 9 185H, NVIDIA RTX 3000 Ada Generation Laptop GPU
127.5 (113min, 80P1) fps -46%
Asus ExpertBook B6 Flip B6602FC2
Intel Core i9-12950HX, NVIDIA RTX A2000 Laptop GPU
123.2 (118min, 68P1) fps -48%
MSI CreatorPro Z16P B12UKST
Intel Core i7-12700H, NVIDIA RTX A3000 Laptop GPU
120.9 (90min, 85P1) fps -49%
HP ZBook Power 15 G10
AMD Ryzen 7 PRO 7840HS, NVIDIA RTX 2000 Ada Generation Laptop GPU
119.9 (104min, 74P1) fps -50%
Lenovo ThinkPad P16v G1 AMD
AMD Ryzen 7 PRO 7840HS, NVIDIA RTX A1000 Laptop GPU
104.3 (88min, 82P1) fps -56%
HP ZBook Firefly 16 G9-6B897EA
Intel Core i7-1265U, NVIDIA T550 Laptop GPU
43.3 (35min, 35P1) fps -82%
1920x1080 Ultra High Preset AA:T AF:16x
Lenovo ThinkPad P16 Gen 2
Intel Core i7-14700HX, NVIDIA RTX 4000 Ada Generation Laptop GPU
95.5 (81min, 68P1) fps
Усредн. модель с NVIDIA RTX 4000 Ada Generation Laptop GPU
  ()
95.5 fps 0%
Dell Precision 5690
Intel Core Ultra 9 185H, NVIDIA RTX 5000 Ada Generation Laptop GPU
91.1 (75min, 64P1) fps -5%
HP ZBook Fury 16 G11
Intel Core i9-14900HX, NVIDIA RTX 3500 Ada Generation Laptop GPU
72.9 (62min, 40P1) fps -24%
HP ZBook Fury 16 G9
Intel Core i9-12950HX, NVIDIA RTX A5500 Laptop GPU
60.9 (51min, 48P1) fps -36%
Dell Precision 5000 5490
Intel Core Ultra 9 185H, NVIDIA RTX 3000 Ada Generation Laptop GPU
50.4 (43min, 40P1) fps -47%
HP ZBook Power 15 G10
AMD Ryzen 7 PRO 7840HS, NVIDIA RTX 2000 Ada Generation Laptop GPU
44.2 (38min, 37P1) fps -54%
Asus ExpertBook B6 Flip B6602FC2
Intel Core i9-12950HX, NVIDIA RTX A2000 Laptop GPU
39.4 (33min, 28P1) fps -59%
MSI CreatorPro Z16P B12UKST
Intel Core i7-12700H, NVIDIA RTX A3000 Laptop GPU
39 (32min, 31P1) fps -59%
HP ZBook Firefly 16 G9-6B897EA
Intel Core i7-1265U, NVIDIA T550 Laptop GPU
31 (25min, 24P1) fps -68%
Lenovo ThinkPad P16v G1 AMD
AMD Ryzen 7 PRO 7840HS, NVIDIA RTX A1000 Laptop GPU
30.6 (26min, 25P1) fps -68%
2560x1440 Ultra High Preset AA:T AF:16x
Lenovo ThinkPad P16 Gen 2
Intel Core i7-14700HX, NVIDIA RTX 4000 Ada Generation Laptop GPU
65.7 (57min, 52P1) fps
Усредн. модель с NVIDIA RTX 4000 Ada Generation Laptop GPU
  ()
65.7 fps 0%
Dell Precision 5690
Intel Core Ultra 9 185H, NVIDIA RTX 5000 Ada Generation Laptop GPU
60.1 (52min, 48P1) fps -9%
HP ZBook Fury 16 G11
Intel Core i9-14900HX, NVIDIA RTX 3500 Ada Generation Laptop GPU
48.3 (41min, 39P1) fps -26%
HP ZBook Fury 16 G9
Intel Core i9-12950HX, NVIDIA RTX A5500 Laptop GPU
37.2 (23min, 29P1) fps -43%
HP ZBook Power 15 G10
AMD Ryzen 7 PRO 7840HS, NVIDIA RTX 2000 Ada Generation Laptop GPU
28.9 (24min, 24P1) fps -56%
MSI CreatorPro Z16P B12UKST
Intel Core i7-12700H, NVIDIA RTX A3000 Laptop GPU
26.2 (21min, 20P1) fps -60%
Cyberpunk 2077 2.1 Phantom Liberty
1920x1080 High Preset (FSR off)
Lenovo ThinkPad P16 Gen 2
Intel Core i7-14700HX, NVIDIA RTX 4000 Ada Generation Laptop GPU
108.4 (88.9min) fps
Усредн. модель с NVIDIA RTX 4000 Ada Generation Laptop GPU
  ()
108.4 fps 0%
HP ZBook Fury 16 G11
Intel Core i9-14900HX, NVIDIA RTX 3500 Ada Generation Laptop GPU
101.8 (84min) fps -6%
Dell Precision 5690
Intel Core Ultra 9 185H, NVIDIA RTX 5000 Ada Generation Laptop GPU
94.6 (39.9min) fps -13%
Dell Precision 5000 5490
Intel Core Ultra 9 185H, NVIDIA RTX 3000 Ada Generation Laptop GPU
60.7 (35.1min) fps -44%
HP ZBook Power 15 G10
AMD Ryzen 7 PRO 7840HS, NVIDIA RTX 2000 Ada Generation Laptop GPU
55.2 (41.1min) fps -49%
Lenovo ThinkPad P16v G1 AMD
AMD Ryzen 7 PRO 7840HS, NVIDIA RTX A1000 Laptop GPU
41.6 (31.9min) fps -62%
1920x1080 Ultra Preset (FSR off)
Dell Precision 5690
Intel Core Ultra 9 185H, NVIDIA RTX 5000 Ada Generation Laptop GPU
108.5 (48.4min) fps +10%
Lenovo ThinkPad P16 Gen 2
Intel Core i7-14700HX, NVIDIA RTX 4000 Ada Generation Laptop GPU
98.3 (73.5min) fps
Усредн. модель с NVIDIA RTX 4000 Ada Generation Laptop GPU
  ()
98.3 fps 0%
HP ZBook Fury 16 G11
Intel Core i9-14900HX, NVIDIA RTX 3500 Ada Generation Laptop GPU
90.3 (73.1min) fps -8%
Dell Precision 5000 5490
Intel Core Ultra 9 185H, NVIDIA RTX 3000 Ada Generation Laptop GPU
52.1 (35.5min) fps -47%
HP ZBook Power 15 G10
AMD Ryzen 7 PRO 7840HS, NVIDIA RTX 2000 Ada Generation Laptop GPU
48.3 (29.5min) fps -51%
Lenovo ThinkPad P16v G1 AMD
AMD Ryzen 7 PRO 7840HS, NVIDIA RTX A1000 Laptop GPU
34.7 (26.7min) fps -65%
2560x1440 Ultra Preset (FSR off)
Lenovo ThinkPad P16 Gen 2
Intel Core i7-14700HX, NVIDIA RTX 4000 Ada Generation Laptop GPU
68.5 (56.6min) fps
Усредн. модель с NVIDIA RTX 4000 Ada Generation Laptop GPU
  ()
68.5 fps 0%
Dell Precision 5690
Intel Core Ultra 9 185H, NVIDIA RTX 5000 Ada Generation Laptop GPU
63.7 (28min) fps -7%
HP ZBook Fury 16 G11
Intel Core i9-14900HX, NVIDIA RTX 3500 Ada Generation Laptop GPU
60.2 (51.5min) fps -12%
HP ZBook Power 15 G10
AMD Ryzen 7 PRO 7840HS, NVIDIA RTX 2000 Ada Generation Laptop GPU
29.9 (24.5min) fps -56%

К сожалению, при запуске Cyberpunk 2077 наблюдается небольшое снижение производительности. Частота кадров падала с ~103 до ~96 после нескольких минут простоя в игре, и результаты не улучшались после повторного тестирования. Это говорит о том, что графическому процессору могло бы помочь более эффективное решение для охлаждения.

Частота кадров, Cyberpunk 2077

0102030405060708090100Tooltip
Lenovo ThinkPad P16 Gen 2 i7-14700HX, NVIDIA RTX 4000 Ada Generation Laptop GPU: Ø97 (89.5-107.8)
мин.сред.выс.макс.QHD
GTA V (2015) 185.8 183.9 179.4 125.6 118.7
Dota 2 Reborn (2015) 215.4 189.7 185.2 164.4
Final Fantasy XV Benchmark (2018) 207 185.3 150 119.5
X-Plane 11.11 (2018) 166.8 144 113.1
Far Cry 5 (2018) 168 148 138 128 125
Strange Brigade (2018) 452 372 323 292 210
Tiny Tina's Wonderlands (2022) 275.4 232.6 171.4 137.1 92
F1 22 (2022) 275 264 238 95.5 65.7
Baldur's Gate 3 (2023) 178.3 160.6 141.6 137 90.7
Cyberpunk 2077 2.1 Phantom Liberty (2023) 129.3 115.1 108.4 98.3 68.5

Температурные и акустические показатели - Шумный при нагрузке

Система охлаждения

Вентиляторы в нашем устройстве имеют тенденцию к более быстрому увеличению числа оборотов и шума по сравнению с менее мощной конфигурацией RTX 2000 Ada. Таким образом, владельцы могут ожидать большего пульсирования вентиляторов и изменения их шума при различных типах нагрузок. При таких нагрузках, как игры, шум вентилятора достигает 53 дБ(A), что является одной из самых громких 16-дюймовых рабочих станций, которые мы тестировали.

Запуск Cyberpunk 2077 в режиме Balanced вместо режима Performance заметно снизит шум вентилятора с 52,8 дБ(А) до 47,9 дБ(А). Однако это происходит за счет снижения производительности, как было отмечено в разделе "Производительность GPU" выше.

Профиль шума вентилятора (Белый: Фоновый, Красный: Простой системы, Синий: 3DMark 06, Оранжевый: Cyberpunk 2077, Зеленый: Prime95+FurMark stress)

Уровень шума

Ожидание
29.1 / 29.1 / 29.1 дБ
Нагрузка
41 / 52.9 дБ
  red to green bar
 
 
30 dB
бесшумно
40 dB(A)
различимо
50 dB(A)
громко
 
min: dark, med: mid, max: light   Earthworks M23R, Arta (15 см от источника шума)   фоновый шум: 23.9 dB(A)
dB(A) 0102030405060708090Deep BassMiddle BassHigh BassLower RangeMidsHigher MidsLower HighsMid HighsUpper HighsSuper Highs203531.534.639.537.22524.824.724.826.125.83121.720.724.225.422.74026.226.625.325.226.95025.425.123.621.824.56328.321.621.421.628.18030.227.125.62729.310027.123.221.22126.712526.522.519.518.42616030.123.419.617.929.820029.923.419.319.729.825032.224.91916.732.531534.226.620.318.234.840034.726.219.116.33550034.926.718.413.435.863035.126.517.712.535.68003727.917.610.837.3100039.93018.69.539.9125040.529.9189.540160039.128.416.79.939.3200041.530.718.210.141.3250042.530.92010.542.9315043.832.1171143.9400041.829.813.911.442500043.528.613.511.643.4630041.624.712.611.541.9800037.119.212.411.637.21000032.616.112.211.732.71250028.315.112.111.828.1160002414.611.810.923.4SPL52.84129.123.952.9N8.43.51.10.58.5median 35.1median 26.5median 18median 11.6median 35.8Delta5.53.62.62.95.2hearing rangehide median Fan NoiseLenovo ThinkPad P16 Gen 2
Lenovo ThinkPad P16 Gen 2
NVIDIA RTX 4000 Ada Generation Laptop GPU, i7-14700HX, SK hynix PC801 HFS001TEJ9X162N
Lenovo ThinkPad P16 G2 21FA000FGE
NVIDIA RTX 2000 Ada Generation Laptop GPU, i7-13700HX, SK hynix PC801 HFS001TEJ9X162N
Lenovo ThinkPad P16s G2 21K9000CGE
Radeon 780M, R7 PRO 7840U, SK hynix PC801 HFS001TEJ9X162N
Lenovo ThinkPad P16 G1 RTX A5500
RTX A5500 Laptop GPU, i9-12950HX, WDC PC SN810 2TB
HP ZBook Power 16 G11 A
NVIDIA RTX 2000 Ada Generation Laptop GPU, R7 8845HS, Samsung PM9A1 MZVL22T0HBLB
Dell Precision 5690
NVIDIA RTX 5000 Ada Generation Laptop GPU, Ultra 9 185H, 2x Samsung PM9A1 1TB (RAID 0)
Уровень шума
6%
17%
17%
18%
5%
в выкл. виде (фон) *
23.9
23.5
2%
22.6
5%
23.1
3%
23.5
2%
23.4
2%
Мин. в простое *
29.1
23.5
19%
22.6
22%
23.1
21%
23.8
18%
23.6
19%
В простое, сред. *
29.1
29.2
-0%
22.6
22%
23.1
21%
24.2
17%
24.9
14%
В простое, макс. *
29.1
29.5
-1%
22.6
22%
23.1
21%
24.2
17%
30.9
-6%
Нагрузка, сред. *
41
32.7
20%
37.8
8%
28.9
30%
25.4
38%
40.4
1%
Cyberpunk 2077 ultra *
52.8
43
19%
Нагрузка, макс. *
52.9
56.6
-7%
40.5
23%
51.4
3%
45
15%
51.9
2%
Witcher 3 ultra *
50.6
40.3
51.6
48.3

* ... меньше = лучше

Температура

Температура поверхности ожидаемо выше, чем на нашем первом тестовом устройстве ThinkPad P16 Gen 2, благодаря более требовательному 130-ваттному графическому процессору RTX 4000 Ada, но разница оказалась более значительной, чем ожидалось. Средняя температура на крышках C и D может достигать 43 C, в то время как на нашей менее оснащенной конфигурации при выполнении требовательных нагрузок она составляет всего 32 C.
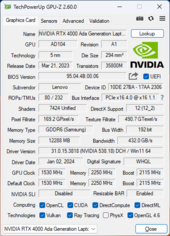
Двойной задний выхлоп
Температура адаптера переменного тока достигает более 57 C при работе с высокими нагрузками
 42.2 °C45.8 °C43.4 °C 
 44 °C46.6 °C44.6 °C 
 35 °C31.6 °C35.6 °C 
Макс.: 46.6 °C
Усредн.: 41 °C
46 °C51 °C48 °C
44.2 °C47.8 °C40.2 °C
35.4 °C43 °C36.6 °C
Макс.: 51 °C
Усредн.: 43.6 °C
ЗУ (макс.)  54.2 °C | Темп. воздуха 20 °C | Fluke 62 Mini IR Thermometer
(-) При нагрузочном тестировании верх корпуса нагревается в среднем до 41 град. Типичное значение для устройств этого же класса (Workstation) = 32 градуса (-ов).
(-) Макс. температура верха корпуса составила 46.6 град. Цельсия. Типичное значение для устройств этого же класса (Workstation) = 38.2 градуса (-ов) при минимуме в 22.2 град. и максимуме в 69.8 град.
(-) Макс. температура дна составила 51 град. Цельсия. Типичное значение для устройств этого же класса = 41.2 градуса (-ов).
(+) При отсутствии вычислительной нагрузки верх корпуса нагревается в среднем до 23.9 град. Типичное значение для устройств этого же класса = 32 градуса (-ов).
(-) 3: The average temperature for the upper side is 39.6 °C / 103 F, compared to the average of 32 °C / 90 F for the class Workstation.
(+) Палуба на ощупь: Умеренно тепло (35.6 град. Цельсия).
(-) Средняя температура палубы у похожих моделей составила 27.8 град. Цельсия, это -7.8 градуса (-ов) разницы.
Система простаивает (крышка C)
Система простаивает (крышка D)
Cyberpunk 2077 (обложка C)
Cyberpunk 2077 (обложка D)
Prime95+FurMark stress (C cover)
Prime95+FurMark стресс (D обложка)
Lenovo ThinkPad P16 Gen 2
Intel Core i7-14700HX, NVIDIA RTX 4000 Ada Generation Laptop GPU
Lenovo ThinkPad P16 G2 21FA000FGE
Intel Core i7-13700HX, NVIDIA RTX 2000 Ada Generation Laptop GPU
Lenovo ThinkPad P16s G2 21K9000CGE
AMD Ryzen 7 PRO 7840U, AMD Radeon 780M
Lenovo ThinkPad P16 G1 RTX A5500
Intel Core i9-12950HX, NVIDIA RTX A5500 Laptop GPU
HP ZBook Power 16 G11 A
AMD Ryzen 7 8845HS, NVIDIA RTX 2000 Ada Generation Laptop GPU
Dell Precision 5690
Intel Core Ultra 9 185H, NVIDIA RTX 5000 Ada Generation Laptop GPU
Нагрев
3%
-2%
-17%
6%
-3%
Нагрузка, макс. сверху *
46.6
47.2
-1%
42.7
8%
44.8
4%
40.6
13%
46.6
-0%
Нагрузка, макс. на дне *
51
39.5
23%
47.2
7%
49.8
2%
40.6
20%
33
35%
В простое сверху *
24.8
28.1
-13%
27.8
-12%
30.6
-23%
26
-5%
32.4
-31%
В простое на дне *
25.6
25.3
1%
28.4
-11%
38.6
-51%
26.6
-4%
29.4
-15%

* ... меньше = лучше

Акустическая система

Розовый шум при максимальной громкости показывает, что динамики могли бы быть немного громче
dB(A) 0102030405060708090Deep BassMiddle BassHigh BassLower RangeMidsHigher MidsLower HighsMid HighsUpper HighsSuper Highs2031.334.631.32524.724.824.73125.624.225.64029.225.329.25034.423.634.46338.221.438.2804225.6421004421.24412548.919.548.916055.219.655.220055.719.355.725058.91958.931564.620.364.640070.419.170.450074.218.474.263071.617.771.680070.217.670.2100072.918.672.9125072.41872.4160068.716.768.7200065.818.265.8250067.52067.53150671767400065.413.965.4500066.313.566.3630064.512.664.5800060.212.460.21000052.912.252.91250053.612.153.61600053.511.853.5SPL80.729.180.7N50.81.150.8median 65.4median 18median 65.4Delta7.42.67.426.325.821.422.12624.925.127.622.532.523.448.72655.818.860.922.167.2267019.372.317.674.217.774.319.575.31571.711.871.311.27410.574.21072.710.17210.67210.97511.374.811.671.71269.71269.612.371.112.669.61270.111.269.824.784.70.666.6median 12median 71.73.42.2hearing rangehide median Pink NoiseLenovo ThinkPad P16 Gen 2Apple MacBook Pro 16 2021 M1 Pro
АЧХ (если нужно отключить сравнение, нажмите на квадратики сверху)
Анализ АЧХ аудиосистемы Lenovo ThinkPad P16 Gen 2

(±) | неплохой уровень макс. громкости (80.7 дБА)
Низкие частоты (100 Гц - 315 Гц)
(±) | баса мало (на 10.8% меньше медианы)
(±) | он умеренно сбалансирован
Средние частоты (400 Гц - 2000 Гц)
(±) | диапазон воспроизводится громче желаемого (отклонение 5.4% от медианы)
(+) | он ровный, без "горбов" или провалов
Высокие частоты (2 кГц - 16 кГц)
(+) | диапазон отлично сбалансирован (отклонение лишь 3.3% от медианы)
(+) | он ровный, без "горбов" или провалов
Весь диапазон (100 - 16000 Гц)
(±) | звук в целом не очень сбалансирован (15.6% отличия от медианы)
в сравнении с устройствами того же класса
» 31% прямо сравнимых устройств показал(и) себя лучше, 9% примерно так же, 60% значительно хуже
» Δ наилучшего устройства из прямо сравнимых: 7%, средняя Δ: 18%, худший результат: 35%
в сравнении со всеми тестированными устройствами
» 21% известных нам устройств показал(и) себя лучше, 4% примерно так же, 75% значительно хуже
» Δ наилучшего устройства среди известных нам: 4%, средняя Δ: 25%, худший результат: 134%

Анализ АЧХ аудиосистемы Apple MacBook Pro 16 2021 M1 Pro

(+) | отличный уровень макс. громкости (84.7 дБА)
Низкие частоты (100 Гц - 315 Гц)
(+) | бас отлично сбалансирован (отклонение лишь 3.8% от медианы)
(+) | он ровный, без "горбов" или провалов
Средние частоты (400 Гц - 2000 Гц)
(+) | диапазон не провален и не выпячен (отклонение лишь 1.3% от медианы)
(+) | он ровный, без "горбов" или провалов
Высокие частоты (2 кГц - 16 кГц)
(+) | диапазон отлично сбалансирован (отклонение лишь 1.9% от медианы)
(+) | он ровный, без "горбов" или провалов
Весь диапазон (100 - 16000 Гц)
(+) | звук в целом сбалансирован (4.6% отличия от медианы)
в сравнении с устройствами того же класса
» 0% прямо сравнимых устройств показал(и) себя лучше, 0% примерно так же, 100% значительно хуже
» Δ наилучшего устройства из прямо сравнимых: 5%, средняя Δ: 18%, худший результат: 45%
в сравнении со всеми тестированными устройствами
» 0% известных нам устройств показал(и) себя лучше, 0% примерно так же, 100% значительно хуже
» Δ наилучшего устройства среди известных нам: 4%, средняя Δ: 25%, худший результат: 134%

Энергопотребление и автономная работа

Энергопотребление

В режиме простоя на рабочем столе может потребоваться до 25 Вт, в то время как на менее оснащенной конфигурации RTX 2000 - всего 16 Вт. При интенсивной нагрузке, например, в играх, разница может достигать 80 Вт, что означает 55-процентное увеличение потребления. Убедитесь, что Вы используете более мощный адаптер переменного тока 230 Вт, чтобы получить максимальную отдачу от конфигурации RTX 4000.

3DMark 06
3DMark 06
Cyberpunk 2077 1080p Ультра
Потребление резко возрастает до 207 Вт при запуске Prime95, а затем снижается и циклически изменяется от 130 до 180 Вт
Prime95+FurMark начался на отметке 10s
Энергопотребление
Выкл.darklight 0.08 / 2.3 Вт
Ожиданиеdarkmidlight 7.9 / 13.1 / 24.2 Вт
Нагрузка midlight 127.4 / 248.5 Вт
 color bar
Легенда: min: dark, med: mid, max: light        Metrahit Energy
Lenovo ThinkPad P16 Gen 2
i7-14700HX, NVIDIA RTX 4000 Ada Generation Laptop GPU, SK hynix PC801 HFS001TEJ9X162N, IPS, 2560x1600, 16"
Lenovo ThinkPad P16 G2 21FA000FGE
i7-13700HX, NVIDIA RTX 2000 Ada Generation Laptop GPU, SK hynix PC801 HFS001TEJ9X162N, IPS LED, 2560x1600, 16"
Lenovo ThinkPad P16s G2 21K9000CGE
R7 PRO 7840U, Radeon 780M, SK hynix PC801 HFS001TEJ9X162N, OLED, 3840x2400, 16"
Lenovo ThinkPad P16 G1 RTX A5500
i9-12950HX, RTX A5500 Laptop GPU, WDC PC SN810 2TB, IPS, 3840x2400, 16"
HP ZBook Power 16 G11 A
R7 8845HS, NVIDIA RTX 2000 Ada Generation Laptop GPU, Samsung PM9A1 MZVL22T0HBLB, IPS, 2560x1600, 16"
Dell Precision 5690
Ultra 9 185H, NVIDIA RTX 5000 Ada Generation Laptop GPU, 2x Samsung PM9A1 1TB (RAID 0), OLED, 3840x2400, 16"
Энергопотребление
7%
55%
-27%
47%
8%
В простое, мин. *
7.9
9.3
-18%
6.1
23%
7.5
5%
4.6
42%
7.9
-0%
В простое, сред. *
13.1
14.1
-8%
6.5
50%
20.1
-53%
10
24%
12
8%
В простое, макс. *
24.2
15.5
36%
7
71%
40
-65%
10.6
56%
28.6
-18%
Нагрузка, сред. *
127.4
133.6
-5%
56.6
56%
137
-8%
60.9
52%
98.8
22%
Cyberpunk 2077 ultra external monitor *
219
92.8
58%
Cyberpunk 2077 ultra *
225
96.8
57%
Нагрузка, макс. *
248.5
179.6
28%
68.3
73%
285.9
-15%
154.8
38%
174.8
30%
Witcher 3 ultra *
144.9
61.2
208
144.5

* ... меньше = лучше

Энергопотребление: Cyberpunk 2077, Стресс-тест

0153045607590105120135150165180195210225240Tooltip
Lenovo ThinkPad P16 Gen 2 i7-14700HX, NVIDIA RTX 4000 Ada Generation Laptop GPU; 1280x720 Prime95 28.10 and Furmark 1.25: Ø198.8 (150.7-248)
Lenovo ThinkPad P16 G2 21FA000FGE i7-13700HX, NVIDIA RTX 2000 Ada Generation Laptop GPU; 1280x720 Prime95 28.10 and Furmark 1.25: Ø165.5 (160.1-179.7)
Lenovo ThinkPad P16 Gen 2 i7-14700HX, NVIDIA RTX 4000 Ada Generation Laptop GPU; Idle 150cd/m2: Ø9.28 (5.14-19.9)
Lenovo ThinkPad P16 G2 21FA000FGE i7-13700HX, NVIDIA RTX 2000 Ada Generation Laptop GPU; Idle 150cd/m2: Ø12.4 (11.3-18.4)
Lenovo ThinkPad P16 Gen 2 i7-14700HX, NVIDIA RTX 4000 Ada Generation Laptop GPU; Cyberpunk 2077 FHD ultra no FSR 150cd: Ø225 (221-229)

Энергопотребление с внешним монитором

0153045607590105120135150165180195210225Tooltip
Lenovo ThinkPad P16 Gen 2 i7-14700HX, NVIDIA RTX 4000 Ada Generation Laptop GPU; Prime95 V2810 Stress (external Monitor): Ø142.3 (113.6-207)
Lenovo ThinkPad P16 G2 21FA000FGE i7-13700HX, NVIDIA RTX 2000 Ada Generation Laptop GPU; Prime95 V2810 Stress (external Monitor): Ø161.3 (154.6-171.2)
Lenovo ThinkPad P16 Gen 2 i7-14700HX, NVIDIA RTX 4000 Ada Generation Laptop GPU; Cinebench R15 Multi (external Monitor): Ø184.8 (169.1-222)
Lenovo ThinkPad P16 Gen 2 i7-14700HX, NVIDIA RTX 4000 Ada Generation Laptop GPU; 1280x720 FurMark 1.19 GPU Stress Test (external Monitor): Ø202 (196.3-209)
Lenovo ThinkPad P16 G2 21FA000FGE i7-13700HX, NVIDIA RTX 2000 Ada Generation Laptop GPU; 1280x720 FurMark 1.19 GPU Stress Test (external Monitor): Ø119.5 (116.8-124.1)
Lenovo ThinkPad P16 Gen 2 i7-14700HX, NVIDIA RTX 4000 Ada Generation Laptop GPU; Idle 1min (external Monitor): Ø7.9 (1.844-18)
Lenovo ThinkPad P16 G2 21FA000FGE i7-13700HX, NVIDIA RTX 2000 Ada Generation Laptop GPU; Idle 1min (external Monitor): Ø27 (25.7-30.1)
Lenovo ThinkPad P16 Gen 2 i7-14700HX, NVIDIA RTX 4000 Ada Generation Laptop GPU; Cyberpunk 2077 FHD ultra no FSR - external Monitor: Ø219 (211-229)

Автономность

Время работы более чем в два раза уступает тому, что мы зафиксировали на меньшей конфигурации ThinkPad P16 Gen 2, даже при установке сбалансированного режима и яркости 150 нит. Разница в основном объясняется отсутствием поддержки Advanced Optimus на нашем устройстве RTX 4000 Ada, поэтому дискретный GPU никогда не отключается полностью.

Зарядка от пустого до полного заряда занимает около 130 минут даже при включенной функции быстрой зарядки Lenovo Quick Charge.

Автономная работа
WiFi Websurfing
2час. 28мин.
Lenovo ThinkPad P16 Gen 2
i7-14700HX, NVIDIA RTX 4000 Ada Generation Laptop GPU, 94 Вт⋅ч
Lenovo ThinkPad P16 G2 21FA000FGE
i7-13700HX, NVIDIA RTX 2000 Ada Generation Laptop GPU, 94 Вт⋅ч
Lenovo ThinkPad P16s G2 21K9000CGE
R7 PRO 7840U, Radeon 780M, 84 Вт⋅ч
Lenovo ThinkPad P16 G1 RTX A5500
i9-12950HX, RTX A5500 Laptop GPU, 94 Вт⋅ч
HP ZBook Power 16 G11 A
R7 8845HS, NVIDIA RTX 2000 Ada Generation Laptop GPU, 83 Вт⋅ч
Dell Precision 5690
Ultra 9 185H, NVIDIA RTX 5000 Ada Generation Laptop GPU, 98 Вт⋅ч
Время работы
248%
329%
136%
293%
271%
Чтение сайтов по Wi-Fi v.2
148
515
248%
635
329%
350
136%
582
293%
549
271%
Воспр. видео H.264
797
Нагрузка и 100% яркости
92
103
В простое
1566

Notebookcheck Rating

Lenovo ThinkPad P16 Gen 2 - 25 October 2024 v8
Allen Ngo

Корпус
88 / 98 → 89%
Клавиатура
90%
Трекпад
92%
Порты и связь
73 / 80 → 91%
Вес
56 / 10-66 → 82%
Время работы
46 / 95 → 49%
Дисплей
86%
3D-производительность
86%
Производительность ЦП
87%
Workstation
90%
Нагрев
83 / 95 → 87%
Шумность
66 / 90 → 73%
Аудио
77%
Камера
36 / 75 → 48%
Средний балл
68%
86%
Workstation - Итоговый рейтинг
CO2 Emissions
No Data
Materials
50%
Packaging
100%
Power Use
77.9%
Repairability
50%
Software Updates
39%
Recycle Logo Total Sustainability Score: 52.8%

Декларация о непредвзятости

Протестированный экземпляр был выдан автору этого материала на короткое время для целей тестирования. Производитель товара или магазин, выдавший нам этот товар на время, не имели никакого влияния на результаты тестирования и не видели текст обзора до его публикации; статья написана не в качестве исполнения любых обязательств перед кем-либо.

This is how Notebookcheck is testing

Every year, Notebookcheck independently reviews hundreds of laptops and smartphones using standardized procedures to ensure that all results are comparable. We have continuously developed our test methods for around 20 years and set industry standards in the process. In our test labs, high-quality measuring equipment is utilized by experienced technicians and editors. These tests involve a multi-stage validation process. Our complex rating system is based on hundreds of well-founded measurements and benchmarks, which maintains objectivity. Further information on our test methods can be found here.

Этот важный материал точно понравится твоим друзьям в социальных сетях!
'
> Обзоры Ноутбуков, Смартфонов, Планшетов. Тесты и Новости > Обзоры > Обзор рабочей станции Lenovo ThinkPad P16 Gen 2: Тяжеловес с супернавороченной графикой
Allen Ngo, 2024-10-30 (Update: 2024-10-30)