Notebookcheck Logo
Teaser

Обзор ноутбука MSI Prestige 13 AI Plus Evo: Отличная графическая производительность весит менее 1 кг

Core Ultra 7 258V против Core Ultra 7 155H.

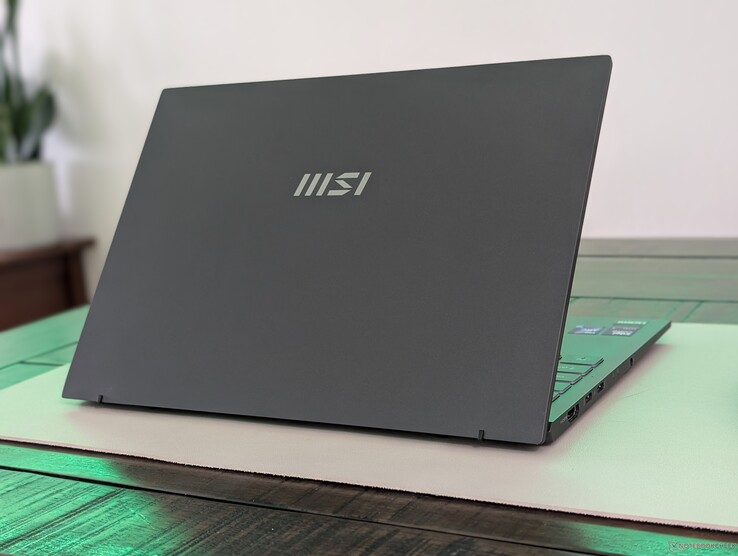
Компания MSI обновила свой самый легкий 13-дюймовый ноутбук, оснастив его процессорами Lunar Lake, которые пришли на смену более старым чипам Meteor Lake. Апгрейд позволил увеличить время автономной работы и графический потенциал не влияя на шумность и вес устройства.
Allen Ngo, 👁 Allen Ngo (перевод DeepL) Опубликовано 🇺🇸 🇫🇷 ...
Intel Evo ноутбуки Lunar Lake

Вердикт - Производительность и набор портов впечатляют с учетом веса

Одной из наших главных претензий к оригинальному Prestige 13 AI Evo было более резкое, чем ожидалось, дросселирование процессора при выполнении интенсивных нагрузок. Новый процессор Lunar Lake решает эту проблему, снижая максимальный потенциал Turbo Boost и повышая минимальный уровень производительности при выполнении таких нагрузок. Это позволило добиться более стабильной и быстрой производительности со временем, что должно понравиться создателям контента или редакторам, которым приходится обрабатывать или кодировать большие файлы или видео. Кроме того, эти преимущества не оказывают заметного влияния на время работы от батареи, температуру или шум вентилятора между Prestige 13 AI Evo и более новой моделью Prestige 13 AI Plus Evo.

Графическая производительность значительно возросла - от 1,5 до 2 раз в зависимости от приложения. Хотя Arc 140V далеко не игровая машина, он, тем не менее, впечатляет, учитывая, насколько легкий ноутбук MSI.

Хорошо (85%) Prestige 13 AI Plus Evo A2VMG Intel Core Ultra 7 258VIntel Arc Graphics 140V Subnotebook - 26 November 2024 - v8
Тестовый образец выдан нам компанией MSI
Сохранить защищённую авторским правом картинку с итоговым рейтингом в формате PNG / SVG

Хотя производительность выросла почти повсеместно, все остальные недостатки, о которых мы упоминали в нашем обзоре Prestige 13 AI Evo, остались неизменными. OLED-дисплей с разрешением 1800p, несмотря на свою четкость и яркость, работает только на частоте 60 Гц, без VRR и сенсорного экрана. Качество веб-камеры и жесткость корпуса также на несколько ступеней ниже по сравнению с более тяжелыми альтернативами от Dell или HP. Несмотря на это, MSI предлагает много производительности и портов, учитывая его малый вес.

За

+ DCI-P3, поддержка HDR и OLED входят в стандартную комплектацию
+ хорошая графическая производительность для своего размера
+ достойное время автономной работы; эффективный процессор
+ обновленная 5 МП веб-камера
+ очень легкий

Против

- более подвержен скручиванию и скрипу
- MicroSD вместо полноразмерной SD
- Оперативная память не может быть увеличена пользователем
- несколько шумноват под нагрузкой
- дисплей ограничен 60 Гц

Соперники

Image
Модель
Price
Вес
Height
Display
1.
85%
MSI Prestige 13 AI Plus Evo A2VMG
Intel Core Ultra 7 258V ⎘
Intel Arc Graphics 140V ⎘
32 Гбайт ОЗУ
Amazon: $1,399.99
List Price: 1400 USD
970 г16.9 мм13.30"
2880x1800
255 PPI
OLED
2.
86.6% v7 (old)
MSI Prestige 13 AI Evo
Intel Core Ultra 7 155H ⎘
Intel Arc 8-Core iGPU ⎘
32 Гбайт ОЗУ, 1024 Гбайт SSD
Amazon: $1,399.99
List Price: 1599€
967 г16.9 мм13.30"
2880x1800
OLED
3.
85.3%
Dell XPS 13 9350
Dell XPS 13 9350
Intel Core Ultra 7 256V ⎘
Intel Arc Graphics 140V ⎘
16 Гбайт ОЗУ, 512 Гбайт SSD
Amazon:
1. $1,399.99
2025 Latest Dell XPS 13 9350...
2. $949.00
Dell XPS 13-9350 13.3-Inch H...
3. $2,399.00
NewDell XPS 13 9350 Powerful...
List Price: 1400 USD
1.2 килог.15.3 мм13.40"
1920x1200
169 PPI
IPS
4.
84%
Framework Laptop 13.5 Core Ultra 7 155H
Intel Core Ultra 7 155H ⎘
Intel Arc 8-Core iGPU ⎘
32 Гбайт ОЗУ
List Price: 1500 USD1.4 килог.15.85 мм13.50"
2880x1920
256 PPI
IPS
5.
87% v7 (old)
Lenovo Yoga Book 9 13IMU9
Intel Core Ultra 7 155U ⎘
Intel Graphics 4-Core iGPU (Arc) ⎘
16 Гбайт ОЗУ
Amazon: $2,119.99
List Price: 2000 USD
1.4 килог.15.95 мм13.30"
2880x1800
255 PPI
OLED
6.
91.9% v7 (old)
HP Dragonfly G4
HP Dragonfly G4
Intel Core i7-1365U ⎘
Intel Iris Xe Graphics G7 96EUs ⎘
16 Гбайт ОЗУ, 512 Гбайт SSD
Amazon: $1,234.85
List Price: 1700 USD
1.1 килог.16.3 мм13.50"
1920x1280
171 PPI
IPS

Прошло всего полгода с момента выпуска оригинального Prestige 13 AI Evo, а MSI уже обновила эту модель, оснастив ее более новыми процессорами Intel. Названная Prestige 13 AI Plus Evo, последняя итерация поставляется с процессорами Lunar Lake вместо Meteor Lake.

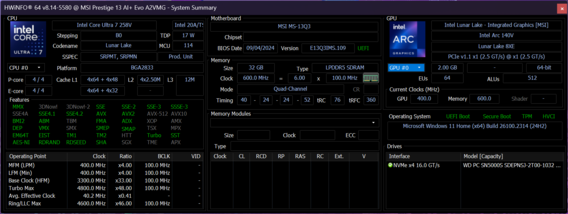
Наше тестовое устройство представляет собой среднюю конфигурацию с Core Ultra 7 258V, 32 ГБ оперативной памяти LPDDR5x-8533 и OLED-дисплеем 1800p по цене около $1400. Другие SKU могут поставляться с Core Ultra 9 288V или Core Ultra 7 256V с вдвое меньшим объемом оперативной памяти.

Конкурентами являются другие высококлассные субноутбуки, такие как Dell XPS 13 9350, Framework Laptop 13.5, или HP Dragonfly 14.

Больше обзоров MSI:

Характеристики

MSI Prestige 13 AI Plus Evo A2VMG (Prestige 13 AI Серия)
Процессор
Intel Core Ultra 7 258V 8 x 2.2 - 4.8 GHz, 40 W PL2 / Short Burst, 27 W PL1 / Sustained, Lunar Lake
Графический адаптер
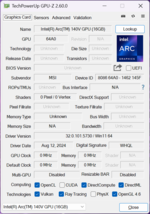
Intel Arc Graphics 140V, Видеопр-р: 1950 МГц, LPDDR5x, 32.0.101.5730
ОЗУ
32 Гбайт 
, LPDDR5x-8533
Дисплей
13.30 дюйм. 16:10, 2880 x 1800 пикс. 255 точек/дюйм, ATNA33AA07-0, OLED, HDR, 60 Hz
Звуковая плата
Intel Lunar Lake SOC - cAVS (Audio, Voice, Speech)
Интерфейсы
1 USB 3.0 / 3.1 Gen 1, 2 USB 4.0 40 Gbps, 2 Thunderbolt, USB-C Power Delivery (PD), 1 HDMI, 2 DisplayPort, Аудиоразъёмы: 3.5 mm combo, картридер: MicroSD, 1 сканер подушечки пальца
Коммуникации
Intel Killer AX1775s 320MHz (a/b/g/h/n = Wi-Fi 4/ac = Wi-Fi 5/ax = Wi-Fi 6/ Wi-Fi 6E 6 GHz), Bluetooth 5.3
Габариты
толщина х ширина х глубина (мм): 16.9 x 299 x 210
Аккумулятор
75 Вт⋅ч литий-полимерн.
Операционная система
Microsoft Windows 11 Home
Камера
Фронтальная камера: 1080p + IR
осн. камера: 2 МП
Дополнительно
акустическая система: Stereo, клавиатура: Chiclet, подсветка клавиатуры: ✔, MSI Center S, 12 мес. гарантии в Европе
Вес
970 г, адаптер питания: 346 г
Стоимость
1400 USD
Amazon
Внимание: Разные образцы одной и той же модели часто используют неодинаковые компоненты! (Матрица AUO вместо BOE, память Hynix вместо Samsung, накопитель SATA вместо PCIe, ...)


Дизайн и особенности

Мы рекомендуем ознакомиться с нашим обзором Prestige 13 AI Evo, поскольку внешних отличий между ним и Prestige 13 AI Plus Evo нет. Система является одним из самых легких 13-дюймовых субноутбуков на рынке - менее 1 кг, но корпус имеет тенденцию прогибаться и скрипеть сильнее по сравнению с более тяжелыми моделями, такими как XPS 13.

Сравнение размеров

299 mm 210 mm 16.9 mm 970 g299 mm 210 mm 16.9 mm 967 g299.1 mm 203.9 mm 15.95 mm 1.4 kg297 mm 220 mm 16.3 mm 1.1 kg296.63 mm 228.98 mm 15.85 mm 1.4 kg295.3 mm 199.1 mm 15.3 mm 1.2 kg297 mm 210 mm 1 mm 5.7 g

Оснащение

Prestige 13 AI - один из немногих оставшихся субноутбуков со встроенными портами HDMI и USB-A. Мы ценим то, что система не полагается полностью только на порты USB-C.

Картридер

SD Card Reader
average JPG Copy Test (av. of 3 runs)
Framework Laptop 13.5 Core Ultra 7 155H
Intel Core Ultra 7 155H (Toshiba Exceria Pro SDXC 64 GB UHS-II)
198.5 MB/s +171%
MSI Prestige 13 AI Evo
Intel Core Ultra 7 155H (Angelbird AV Pro V60)
142 MB/s +94%
MSI Prestige 13 AI Plus Evo A2VMG
Intel Core Ultra 7 258V (Angelbird AV Pro V60)
73.3 MB/s
maximum AS SSD Seq Read Test (1GB)
Framework Laptop 13.5 Core Ultra 7 155H
Intel Core Ultra 7 155H (Toshiba Exceria Pro SDXC 64 GB UHS-II)
248.9 MB/s +37%
MSI Prestige 13 AI Evo
Intel Core Ultra 7 155H (Angelbird AV Pro V60)
206.7 MB/s +14%
MSI Prestige 13 AI Plus Evo A2VMG
Intel Core Ultra 7 258V (Angelbird AV Pro V60)
181.1 MB/s

Сеть

Интересно, что наше устройство поставляется с Intel Killer AX1775s, а не с BE1750W, как в конфигурации Core Ultra 7 155H. AX1775s не поддерживает Wi-Fi 7, в отличие от BE1750W.

Networking
iperf3 transmit AXE11000
MSI Prestige 13 AI Evo
Intel Killer Wi-Fi 7 BE1750W 320 MHz (BE200NGW)
1609 (1535min, 1544.86P1 - 1649max) MBit/s +150%
HP Dragonfly G4
Intel Wi-Fi 6E AX211
973 (879min - 1016max) MBit/s +51%
Dell XPS 13 9350
Intel BE201 320MHz
875 (599min - 1034max) MBit/s +36%
Lenovo Yoga Book 9 13IMU9
Intel Wi-Fi 6E AX211
807 (591min - 989max) MBit/s +25%
Framework Laptop 13.5 Core Ultra 7 155H
Intel Wi-Fi 6E AX210
710 (355min - 758max) MBit/s +10%
MSI Prestige 13 AI Plus Evo A2VMG
Intel Killer AX1775s 320MHz
644 (331min - 781max) MBit/s
iperf3 receive AXE11000
MSI Prestige 13 AI Evo
Intel Killer Wi-Fi 7 BE1750W 320 MHz (BE200NGW)
1644 (1579min, 1581.03P1 - 1671max) MBit/s +113%
Lenovo Yoga Book 9 13IMU9
Intel Wi-Fi 6E AX211
1367 (1203min - 1448max) MBit/s +77%
HP Dragonfly G4
Intel Wi-Fi 6E AX211
1200 (1059min - 1247max) MBit/s +55%
Framework Laptop 13.5 Core Ultra 7 155H
Intel Wi-Fi 6E AX210
848 (777min - 883max) MBit/s +10%
Dell XPS 13 9350
Intel BE201 320MHz
828 (763min - 865max) MBit/s +7%
MSI Prestige 13 AI Plus Evo A2VMG
Intel Killer AX1775s 320MHz
772 (626min - 835max) MBit/s
iperf3 transmit AXE11000 6GHz
MSI Prestige 13 AI Plus Evo A2VMG
Intel Killer AX1775s 320MHz
1303 (1200min - 1351max) MBit/s
HP Dragonfly G4
Intel Wi-Fi 6E AX211
1243 (776min - 1326max) MBit/s -5%
Dell XPS 13 9350
Intel BE201 320MHz
1127 (1037min - 1292max) MBit/s -14%
Framework Laptop 13.5 Core Ultra 7 155H
Intel Wi-Fi 6E AX210
1047 (517min - 1099max) MBit/s -20%
Lenovo Yoga Book 9 13IMU9
Intel Wi-Fi 6E AX211
815 (660min - 933max) MBit/s -37%
iperf3 receive AXE11000 6GHz
Dell XPS 13 9350
Intel BE201 320MHz
1620 (1578min - 1652max) MBit/s +6%
MSI Prestige 13 AI Plus Evo A2VMG
Intel Killer AX1775s 320MHz
1529 (1485min - 1555max) MBit/s
HP Dragonfly G4
Intel Wi-Fi 6E AX211
1234 (1042min - 1336max) MBit/s -19%
Framework Laptop 13.5 Core Ultra 7 155H
Intel Wi-Fi 6E AX210
1065 (973min - 1117max) MBit/s -30%
Lenovo Yoga Book 9 13IMU9
Intel Wi-Fi 6E AX211
1010 (911min - 1067max) MBit/s -34%
050100150200250300350400450500550600650700750800850900950100010501100115012001250130013501400145015001550Tooltip
MSI Prestige 13 AI Plus Evo A2VMG; iperf3 transmit AXE11000 6GHz; iperf 3.1.3: Ø1303 (1200-1351)
MSI Prestige 13 AI Plus Evo A2VMG; iperf3 receive AXE11000 6GHz; iperf 3.1.3: Ø1528 (1485-1555)

Веб-камера

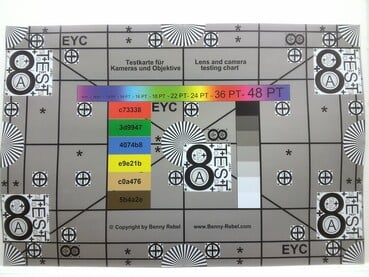
Качество веб-камеры улучшилось с 2 МП в оригинальной модели до 5 МП для более четких изображений.

ColorChecker
5.2 ∆E
6.3 ∆E
9 ∆E
11.4 ∆E
9.8 ∆E
7.8 ∆E
3.5 ∆E
3.5 ∆E
8.6 ∆E
3.8 ∆E
8.6 ∆E
5.6 ∆E
3.7 ∆E
4.9 ∆E
9.1 ∆E
3.7 ∆E
5.3 ∆E
5.5 ∆E
6.2 ∆E
2.9 ∆E
5.9 ∆E
3.9 ∆E
3 ∆E
1.9 ∆E
ColorChecker MSI Prestige 13 AI Plus Evo A2VMG: 5.79 ∆E min: 1.87 - max: 11.44 ∆E

Обслуживание

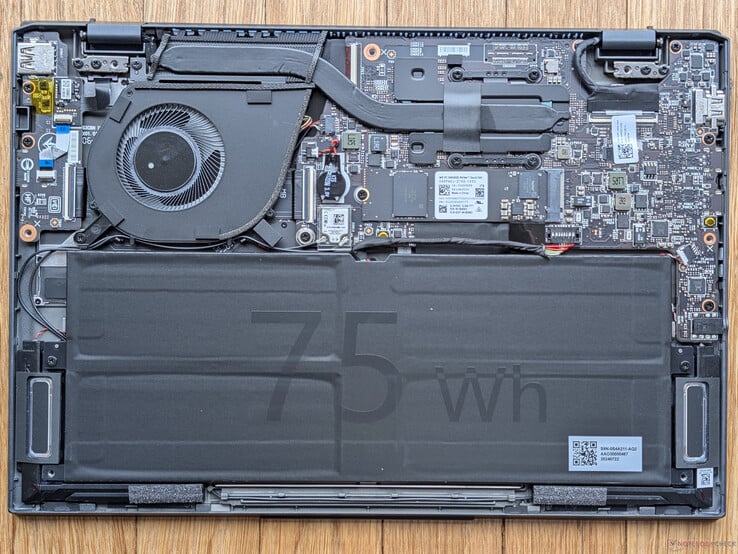
MSI Prestige 13 AI Plus Evo A2VMG. Никаких существенных изменений по сравнению с оригинальной моделью Prestige 13 AI Evo

Экологичность

Модель соответствует рекомендациям EPEAT Silver по экологичности, а упаковка в основном состоит из картона и бумаги с некоторым количеством пластиковой упаковки вокруг ноутбука и сетевого адаптера.

Дисплей

Структура пикселей Sharp OLED

OLED-дисплей Samsung с разрешением 1800p остался таким же, как и раньше. Хотя качество изображения отличное и не вызывает проблем с зернистостью, мы бы предпочли повысить частоту обновления до 90 Гц или 120 Гц, поскольку 60 Гц уже начинает выглядеть устаревшей для высококлассного субноутбука.

Максимальная яркость может достигать 598 нит, если включить режим HDR. В противном случае, в режиме SDR она достигает 382 нит.

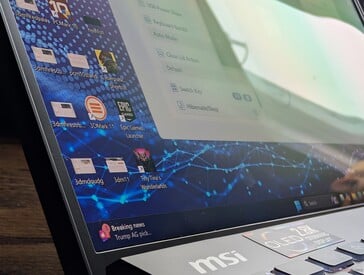
Для уменьшения веса не требуется стекло от края до края или сенсорный экран
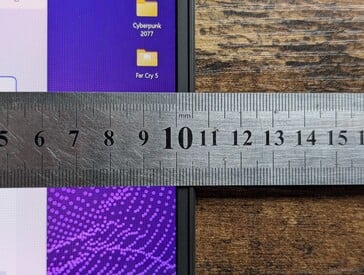
Очень узкие боковые рамки
383.8
cd/m²
380.7
cd/m²
384
cd/m²
383.6
cd/m²
382.4
cd/m²
385
cd/m²
382
cd/m²
382
cd/m²
385
cd/m²
Равномерность подсветки экрана
ATNA33AA07-0 замерено через: X-Rite i1Pro 2
Максимум: 385 cd/m² (Nits) В среднем: 383.2 cd/m² Minimum: 18.8 cd/m²
Равномерность подсветки: 99 %
От батареи: 382.4 cd/m²
Контрастность: ∞:1 (Уровень чёрного: 0 cd/m²)
ΔE Color 3.84 | 0.5-29.43 Ø4.9, calibrated: 0.41
ΔE Greyscale 0.7 | 0.5-98 Ø5.2
95.8% AdobeRGB 1998 (Argyll 2.2.0 3D)
100% sRGB (Argyll 2.2.0 3D)
99.9% Display P3 (Argyll 2.2.0 3D)
Gamma: 2.23
MSI Prestige 13 AI Plus Evo A2VMG
ATNA33AA07-0, OLED, 2880x1800, 13.3", 60 Hz
MSI Prestige 13 AI Evo
ATNA33AA07-0, OLED, 2880x1800, 13.3", 60 Hz
Dell XPS 13 9350
LG Philips 134WU2, IPS, 1920x1200, 13.4", 120 Hz
Framework Laptop 13.5 Core Ultra 7 155H
BOE NE135A1M-NY1, IPS, 2880x1920, 13.5", 120 Hz
Lenovo Yoga Book 9 13IMU9
SDC ATNA33AA02-0, OLED, 2880x1800, 13.3", 60 Hz
HP Dragonfly G4
Chi Mei CMN13C0, IPS, 1920x1280, 13.5", 60 Hz
Display
1%
-21%
-17%
0%
-20%
Display P3 Coverage
99.9
99.9
0%
67.3
-33%
72.8
-27%
99.7
0%
68.4
-32%
sRGB Coverage
100
100
0%
99
-1%
98.6
-1%
100
0%
98.3
-2%
AdobeRGB 1998 Coverage
95.8
97.8
2%
68.6
-28%
72.9
-24%
97
1%
70.4
-27%
Response Times
117%
-1503%
-1567%
-0%
-1933%
Response Time Grey 50% / Grey 80% *
1.94 ?(1, 0.94)
1.54 ?(0.79, 0.75)
21%
37.3 ?(17, 20.3)
-1823%
41.9 ?(18.7, 23.2)
-2060%
1.88 ?(1, 0.88)
3%
48.8 ?(22.9, 25.9)
-2415%
Response Time Black / White *
2.02 ?(0.92, 1.1)
1.44 ?(0.73, 0.71)
29%
25.9 ?(12.5, 13.4)
-1182%
23.7 ?(11.5, 12.2)
-1073%
2.1 ?(0.9, 1.2)
-4%
31.3 ?(16.3, 15)
-1450%
PWM Frequency
60 ?(100)
240 ?(42)
300%
60 ?(100)
0%
Параметры экрана
3%
17%
-108%
-50%
-27%
Яркость в центре
382.4
404
6%
462.8
21%
498.5
30%
362.6
-5%
408.8
7%
Brightness
383
407
6%
435
14%
464
21%
368
-4%
399
4%
Brightness Distribution
99
98
-1%
87
-12%
86
-13%
97
-2%
90
-9%
Уровень чёрного *
0.19
0.36
0.32
Colorchecker Delta E *
3.84
2.1
45%
1.92
50%
4.27
-11%
4.66
-21%
2.02
47%
Colorchecker dE 2000 max. *
6.66
4.3
35%
3.45
48%
7.08
-6%
7.25
-9%
3.84
42%
Colorchecker dE 2000 calibrated *
0.41
0.48
-17%
1.26
-207%
0.56
-37%
0.61
-49%
Delta E для серого *
0.7
1.2
-71%
0.6
14%
4.7
-571%
2.6
-271%
2.3
-229%
Гамма
2.23 99%
2.16 102%
2.19 100%
2.09 105%
2.2 100%
2.2 100%
CCT
6475 100%
6465 101%
6539 99%
7417 88%
6055 107%
6203 105%
Контрастность
2436
1385
1278
Среднее значение
40% / 31%
-502% / -246%
-564% / -329%
-17% / -27%
-660% / -343%

* ... меньше = лучше

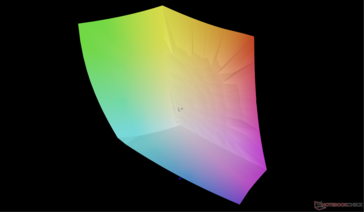
Охват sRGB
Охват sRGB
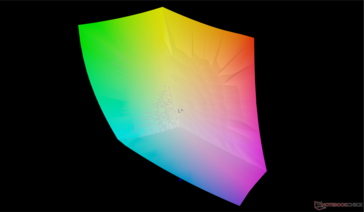
Охват P3
Охват P3

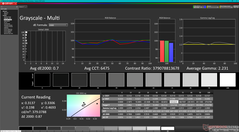
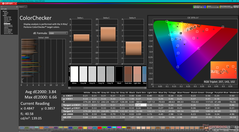
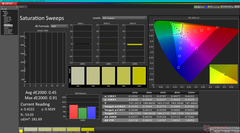
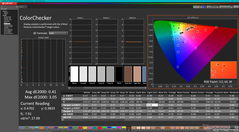
Дисплей хорошо откалиброван по стандарту P3: средние значения дельтаЕ по шкале серого и ColorChecker составляют всего 0,7 и 3,84, соответственно.

Оттенки серого до калибровки
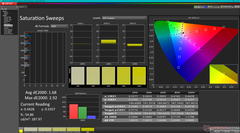
Насыщенность до калибровки
ColorChecker до калибровки
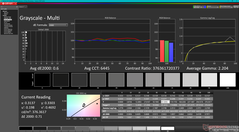
Оттенки серого после калибровки
Насыщенность после калибровки
ColorChecker после калибровки

Дисплей: тест на время отклика

Время отклика показывает, как быстро дисплей устройства способен сменить цвет изображения с одного на другой. Недостаточно быстрый отклик может привести к деформации подвижных фрагментов изображения, появлении теней и размытости. Отсутствие таких проблем особенно важно для просмотра фильмов и для игр.
       Перемена цвета пикселей, чёрный - белый (1) и белый - чёрный (2)
2.02 ms ... стадия 1 ↗ и стадия 2 ↘ в сумме↗ 0.92 ms стадия 1
↘ 1.1 ms стадия 2
Это отличное время отклика! Экран идеально подходит для игр и подобных применений.
Для сравнения, самый лучший результат среди всех известных нам устройств равен 0.1 миллисек., самый худший - 240 миллисек. » 8% экранов из нашей базы данных показали более хороший результат.
Таким образом, тестируемое устройство находится в верхней половине рейтинга (оно опережает средний результат, равный 20.9 миллисек.)
       Перемена цвета пикселей, серый 50% - серый 80% (1) и серый 80% - серый 50% (2)
1.94 ms ... стадия 1 ↗ и стадия 2 ↘ в сумме↗ 1 ms стадия 1
↘ 0.94 ms стадия 2
Это отличное время отклика! Экран идеально подходит для игр и подобных применений.
Для сравнения, самый лучший результат среди всех известных нам устройств равен 0.165 миллисек., самый худший - 636 миллисек. » 6% экранов из нашей базы данных показали более хороший результат.
Таким образом, тестируемое устройство находится в верхней половине рейтинга (оно опережает средний результат, равный 32.8 миллисек.)

Тест на мерцание

Некоторые устройства устанавливают яркость экрана при помощи быстрого включения-выключения светодиодов вместо простого понижения напряжения их питания. Такой метод обозначается аббревиатурой ШИМ (или PWM). Он часто приводит к полоскам или ряби на изображении, а также к быстрой усталости глаз и головной боли. Мы проверяем, используется ли PWM в тестируемом устройстве, и если да, то при каких условиях.
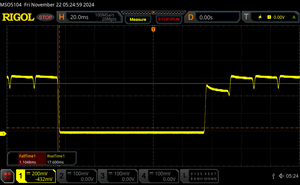
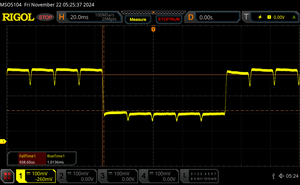
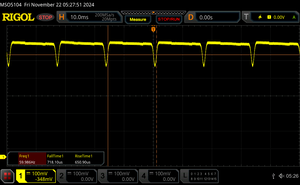
Модуляция на частоте 60 Hz
Amplitude: 21.9 %
≤ 100 % яркости

Подсветка экрана мерцает с частотой 60 Гц. Этот эффект присутствует при яркости 100 % и ниже.

Стоит заметить, что частота 60 Гц очень мала. Мерцание экрана будет практически гарантированно вызывать эффект усталости, вплоть до тошноты.

Для сравнения, 53 % известных нам устройств не применяют PWM для изменения яркости, а среди тех, где PWM используется, типичная частота модуляции составляет 8687 Гц (мин. 5 Гц, макс. 343500 Гц).

Яркость 100%
Яркость 100%
Яркость 75%
Яркость 75%
Яркость 50%
Яркость 50%
Яркость 25%
Яркость 25%
Яркость 0%
Яркость 0%
На открытом воздухе при яркой пасмурной погоде
На открытом воздухе в тени
На открытом воздухе при яркой пасмурной погоде
Широкие углы обзора OLED

Производительность


Условия тестирования

Перед выполнением приведенных ниже бенчмарков мы перевели Windows и MSI Center в режим Performance. Режим Cooler Boost (он же режим максимального вентилятора) также доступен, но он не оказывает существенного влияния на производительность, как покажут наши бенчмарки ниже.

Переработанный главный экран MSI Center S
Вспомогательные функции
Меню поддержки
Меню поддержки

Процессор

По сравнению с Core Ultra 7 155H, наш Core Ultra 7 258V имеет более медленный потенциал Turbo Boost, но более стабильную и высокую производительность в течение длительного времени. Это видно при циклическом выполнении CineBench R15 xT, как показано на графике ниже, где конфигурация Core Ultra 7 155H опережает нашу конфигурацию Core Ultra 7 258V только в начале теста, а затем сильно снижает производительность после первого цикла.

Многопоточный тест Cinebench R15

012024036048060072084096010801200132014401560168018001920204021602280Tooltip
MSI Prestige 13 AI Plus Evo A2VMG Intel Core Ultra 7 258V: Ø1551 (1467.08-1624.89)
MSI Prestige 13 AI Evo Intel Core Ultra 7 155H: Ø1302 (1245.56-2032.83)
Dell XPS 13 9350 Intel Core Ultra 7 256V: Ø1415 (1369.16-1569.86)
Framework Laptop 13.5 Core Ultra 7 155H Intel Core Ultra 7 155H: Ø1844 (1807.26-2336.72)
Lenovo Yoga Book 9 13IMU9 Intel Core Ultra 7 155U: Ø1322 (1278.32-1504.72)
HP Dragonfly G4 Intel Core i7-1365U: Ø1060 (1014.74-1347.89)
CPU Performance Rating: Percent
Cinebench R23: Multi Core | Single Core
Cinebench R20: CPU (Multi Core) | CPU (Single Core)
Cinebench R15: CPU Multi 64Bit | CPU Single 64Bit
Blender: v2.79 BMW27 CPU
7-Zip 18.03: 7z b 4 | 7z b 4 -mmt1
Geekbench 6.3: Multi-Core | Single-Core
Geekbench 5.5: Multi-Core | Single-Core
HWBOT x265 Benchmark v2.2: 4k Preset
LibreOffice : 20 Documents To PDF
R Benchmark 2.5: Overall mean
CPU Performance Rating
Asus ProArt PX13 HN7306
AMD Ryzen AI 9 HX 370
88.2 pt
Lenovo ThinkPad Z13 Gen 2
AMD Ryzen 7 PRO 7840U
68.2 pt
Framework Laptop 13.5 Core Ultra 7 155H
Intel Core Ultra 7 155H
66.4 pt
MSI Prestige 13 AI Plus Evo A2VMG
Intel Core Ultra 7 258V
63.2 pt
Dell XPS 13 9350
Intel Core Ultra 7 256V
62.6 pt
Усредн. модель с Intel Core Ultra 7 258V
 
61.5 pt
Lenovo ThinkPad X13 Gen 4 21J3001VGE
AMD Ryzen 7 PRO 7840U
60.8 pt
MSI Prestige 13 AI Evo
Intel Core Ultra 7 155H
60 pt
HP Dragonfly G4 -2!
Intel Core i7-1365U
54.4 pt
Dell Latitude 13 7350
Intel Core Ultra 5 135U
53 pt
Asus ZenBook S13 OLED UX5304 -2!
Intel Core i7-1355U
51.1 pt
Lenovo ThinkPad X13 2-in-1 Gen 5
Intel Core Ultra 7 165U
50.3 pt
Dell Latitude 7350 Detachable
Intel Core Ultra 7 164U
49.9 pt
Dell XPS 13 Plus 9320 i5-1240p -2!
Intel Core i5-1240P
48.3 pt
Lenovo ThinkPad X13 G3 21CM002UGE -2!
AMD Ryzen 5 PRO 6650U
43.6 pt
HP Elite Dragonfly G3 -2!
Intel Core i7-1265U
43.5 pt
Lenovo Yoga 6 13ALC6 -4!
AMD Ryzen 7 5700U
39.4 pt
Cinebench R23 / Multi Core
Asus ProArt PX13 HN7306
AMD Ryzen AI 9 HX 370
23236 Points +109%
Lenovo ThinkPad Z13 Gen 2
AMD Ryzen 7 PRO 7840U
13767 (13362.4min - 13766.9max) Points +24%
Framework Laptop 13.5 Core Ultra 7 155H
Intel Core Ultra 7 155H
13247 (11787.9min - 13246.9max) Points +19%
MSI Prestige 13 AI Plus Evo A2VMG
Intel Core Ultra 7 258V
11097 (10572.3min - 11097.5max) Points
Lenovo ThinkPad X13 Gen 4 21J3001VGE
AMD Ryzen 7 PRO 7840U
10576 Points -5%
Усредн. модель с Intel Core Ultra 7 258V
  (9114 - 11097, n=5)
10429 Points -6%
Dell XPS 13 9350
Intel Core Ultra 7 256V
10391 (9371.44min - 10390.8max) Points -6%
MSI Prestige 13 AI Evo
Intel Core Ultra 7 155H
9769 Points -12%
Dell XPS 13 Plus 9320 i5-1240p
Intel Core i5-1240P
9392 Points -15%
Dell Latitude 13 7350
Intel Core Ultra 5 135U
9315 (7452.65min - 9315.13max) Points -16%
Dell Latitude 7350 Detachable
Intel Core Ultra 7 164U
8766 (7212.24min - 8765.97max) Points -21%
Lenovo ThinkPad X13 2-in-1 Gen 5
Intel Core Ultra 7 165U
8498 Points -23%
Lenovo ThinkPad X13 G3 21CM002UGE
AMD Ryzen 5 PRO 6650U
7805 Points -30%
HP Dragonfly G4
Intel Core i7-1365U
7532 (5307.67min - 7531.78max) Points -32%
Lenovo Yoga 6 13ALC6
AMD Ryzen 7 5700U
7451 (6931.1min - 7450.97max) Points -33%
Asus ZenBook S13 OLED UX5304
Intel Core i7-1355U
7015 Points -37%
HP Elite Dragonfly G3
Intel Core i7-1265U
6145 (5739.99min - 6144.82max) Points -45%
Cinebench R23 / Single Core
Asus ProArt PX13 HN7306
AMD Ryzen AI 9 HX 370
2035 Points +10%
HP Dragonfly G4
Intel Core i7-1365U
1891 Points +3%
Dell XPS 13 9350
Intel Core Ultra 7 256V
1875 Points +2%
MSI Prestige 13 AI Plus Evo A2VMG
Intel Core Ultra 7 258V
1843 Points
Усредн. модель с Intel Core Ultra 7 258V
  (1664 - 1918, n=5)
1813 Points -2%
Framework Laptop 13.5 Core Ultra 7 155H
Intel Core Ultra 7 155H
1757 Points -5%
Asus ZenBook S13 OLED UX5304
Intel Core i7-1355U
1730 Points -6%
Lenovo ThinkPad X13 Gen 4 21J3001VGE
AMD Ryzen 7 PRO 7840U
1709 Points -7%
Lenovo ThinkPad Z13 Gen 2
AMD Ryzen 7 PRO 7840U
1703 Points -8%
MSI Prestige 13 AI Evo
Intel Core Ultra 7 155H
1671 Points -9%
Dell XPS 13 Plus 9320 i5-1240p
Intel Core i5-1240P
1621 Points -12%
Dell Latitude 7350 Detachable
Intel Core Ultra 7 164U
1590 Points -14%
Dell Latitude 13 7350
Intel Core Ultra 5 135U
1563 Points -15%
HP Elite Dragonfly G3
Intel Core i7-1265U
1529 Points -17%
Lenovo ThinkPad X13 2-in-1 Gen 5
Intel Core Ultra 7 165U
1507 Points -18%
Lenovo ThinkPad X13 G3 21CM002UGE
AMD Ryzen 5 PRO 6650U
1439 Points -22%
Lenovo Yoga 6 13ALC6
AMD Ryzen 7 5700U
1256 Points -32%
Cinebench R20 / CPU (Multi Core)
Asus ProArt PX13 HN7306
AMD Ryzen AI 9 HX 370
9057 Points +111%
Lenovo ThinkPad Z13 Gen 2
AMD Ryzen 7 PRO 7840U
5377 Points +26%
Framework Laptop 13.5 Core Ultra 7 155H
Intel Core Ultra 7 155H
5160 Points +20%
MSI Prestige 13 AI Plus Evo A2VMG
Intel Core Ultra 7 258V
4284 Points
Lenovo ThinkPad X13 Gen 4 21J3001VGE
AMD Ryzen 7 PRO 7840U
4210 Points -2%
Усредн. модель с Intel Core Ultra 7 258V
  (3530 - 4284, n=5)
4046 Points -6%
Dell XPS 13 9350
Intel Core Ultra 7 256V
4038 Points -6%
MSI Prestige 13 AI Evo
Intel Core Ultra 7 155H
3798 Points -11%
Dell Latitude 13 7350
Intel Core Ultra 5 135U
3641 Points -15%
Dell XPS 13 Plus 9320 i5-1240p
Intel Core i5-1240P
3424 Points -20%
Lenovo ThinkPad X13 2-in-1 Gen 5
Intel Core Ultra 7 165U
3254 Points -24%
Dell Latitude 7350 Detachable
Intel Core Ultra 7 164U
3212 Points -25%
Lenovo ThinkPad X13 G3 21CM002UGE
AMD Ryzen 5 PRO 6650U
3057 Points -29%
Lenovo Yoga 6 13ALC6
AMD Ryzen 7 5700U
2913 Points -32%
HP Dragonfly G4
Intel Core i7-1365U
2902 Points -32%
Asus ZenBook S13 OLED UX5304
Intel Core i7-1355U
2849 Points -33%
HP Elite Dragonfly G3
Intel Core i7-1265U
2365 Points -45%
Cinebench R20 / CPU (Single Core)
Asus ProArt PX13 HN7306
AMD Ryzen AI 9 HX 370
803 Points +13%
Dell XPS 13 9350
Intel Core Ultra 7 256V
720 Points +2%
MSI Prestige 13 AI Plus Evo A2VMG
Intel Core Ultra 7 258V
709 Points
HP Dragonfly G4
Intel Core i7-1365U
703 Points -1%
Усредн. модель с Intel Core Ultra 7 258V
  (643 - 734, n=5)
683 Points -4%
Asus ZenBook S13 OLED UX5304
Intel Core i7-1355U
679 Points -4%
Lenovo ThinkPad Z13 Gen 2
AMD Ryzen 7 PRO 7840U
669 Points -6%
Framework Laptop 13.5 Core Ultra 7 155H
Intel Core Ultra 7 155H
669 Points -6%
Lenovo ThinkPad X13 Gen 4 21J3001VGE
AMD Ryzen 7 PRO 7840U
655 Points -8%
MSI Prestige 13 AI Evo
Intel Core Ultra 7 155H
632 Points -11%
Dell XPS 13 Plus 9320 i5-1240p
Intel Core i5-1240P
616 Points -13%
Dell Latitude 13 7350
Intel Core Ultra 5 135U
605 Points -15%
Lenovo ThinkPad X13 2-in-1 Gen 5
Intel Core Ultra 7 165U
604 Points -15%
Dell Latitude 7350 Detachable
Intel Core Ultra 7 164U
602 Points -15%
HP Elite Dragonfly G3
Intel Core i7-1265U
586 Points -17%
Lenovo ThinkPad X13 G3 21CM002UGE
AMD Ryzen 5 PRO 6650U
548 Points -23%
Lenovo Yoga 6 13ALC6
AMD Ryzen 7 5700U
489 Points -31%
Cinebench R15 / CPU Multi 64Bit
Asus ProArt PX13 HN7306
AMD Ryzen AI 9 HX 370
3483 (2901.49min - 3483.11max) Points +114%
Framework Laptop 13.5 Core Ultra 7 155H
Intel Core Ultra 7 155H
2337 (1807.26min - 2336.72max) Points +44%
Lenovo ThinkPad Z13 Gen 2
AMD Ryzen 7 PRO 7840U
2218 (2125.62min - 2218.16max) Points +36%
MSI Prestige 13 AI Evo
Intel Core Ultra 7 155H
2033 (1245.56min - 2032.83max) Points +25%
Dell Latitude 13 7350
Intel Core Ultra 5 135U
1634 (1124.76min - 1633.59max) Points +1%
MSI Prestige 13 AI Plus Evo A2VMG
Intel Core Ultra 7 258V
1625 (1467.08min - 1624.89max) Points
Усредн. модель с Intel Core Ultra 7 258V
  (1550 - 1656, n=5)
1607 Points -1%
Dell XPS 13 Plus 9320 i5-1240p
Intel Core i5-1240P
1592 Points -2%
Lenovo ThinkPad X13 Gen 4 21J3001VGE
AMD Ryzen 7 PRO 7840U
1590 (1018.07min - 1589.89max) Points -2%
Dell XPS 13 9350
Intel Core Ultra 7 256V
1570 (1369.16min - 1569.86max) Points -3%
Lenovo ThinkPad X13 2-in-1 Gen 5
Intel Core Ultra 7 165U
1428 (966.95min - 1428.42max) Points -12%
Asus ZenBook S13 OLED UX5304
Intel Core i7-1355U
1358 (989.63min - 1358.19max) Points -16%
HP Dragonfly G4
Intel Core i7-1365U
1348 (1014.74min - 1347.89max) Points -17%
Dell Latitude 7350 Detachable
Intel Core Ultra 7 164U
1304 (1025.54min - 1304.29max) Points -20%
Lenovo ThinkPad X13 G3 21CM002UGE
AMD Ryzen 5 PRO 6650U
1299 (1229.82min - 1298.7max) Points -20%
HP Elite Dragonfly G3
Intel Core i7-1265U
1204 (961.28min - 1204.49max) Points -26%
Lenovo Yoga 6 13ALC6
AMD Ryzen 7 5700U
1196 (1169.93min - 1196.39max) Points -26%
Cinebench R15 / CPU Single 64Bit
Asus ProArt PX13 HN7306
AMD Ryzen AI 9 HX 370
306 Points +9%
Dell XPS 13 9350
Intel Core Ultra 7 256V
285 Points +1%
MSI Prestige 13 AI Plus Evo A2VMG
Intel Core Ultra 7 258V
281 Points
Усредн. модель с Intel Core Ultra 7 258V
  (258 - 294, n=5)
275 Points -2%
Lenovo ThinkPad Z13 Gen 2
AMD Ryzen 7 PRO 7840U
263 Points -6%
HP Dragonfly G4
Intel Core i7-1365U
261 Points -7%
Framework Laptop 13.5 Core Ultra 7 155H
Intel Core Ultra 7 155H
257 Points -9%
Lenovo ThinkPad X13 Gen 4 21J3001VGE
AMD Ryzen 7 PRO 7840U
247 Points -12%
Asus ZenBook S13 OLED UX5304
Intel Core i7-1355U
245 Points -13%
MSI Prestige 13 AI Evo
Intel Core Ultra 7 155H
242 Points -14%
Lenovo ThinkPad X13 G3 21CM002UGE
AMD Ryzen 5 PRO 6650U
230 Points -18%
Dell Latitude 13 7350
Intel Core Ultra 5 135U
228 Points -19%
Dell XPS 13 Plus 9320 i5-1240p
Intel Core i5-1240P
226 Points -20%
Dell Latitude 7350 Detachable
Intel Core Ultra 7 164U
225 Points -20%
HP Elite Dragonfly G3
Intel Core i7-1265U
224 Points -20%
Lenovo ThinkPad X13 2-in-1 Gen 5
Intel Core Ultra 7 165U
220 Points -22%
Lenovo Yoga 6 13ALC6
AMD Ryzen 7 5700U
188 Points -33%
Blender / v2.79 BMW27 CPU
Lenovo ThinkPad X13 G3 21CM002UGE
AMD Ryzen 5 PRO 6650U
548 Seconds * -71%
Lenovo ThinkPad X13 G3 21CM002UGE
AMD Ryzen 5 PRO 6650U
397 Seconds * -24%
HP Elite Dragonfly G3
Intel Core i7-1265U
484 Seconds * -51%
Asus ZenBook S13 OLED UX5304
Intel Core i7-1355U
450 Seconds * -41%
Asus ZenBook S13 OLED UX5304
Intel Core i7-1355U
448 Seconds * -40%
HP Dragonfly G4
Intel Core i7-1365U
430 Seconds * -34%
Dell Latitude 7350 Detachable
Intel Core Ultra 7 164U
395 Seconds * -23%
Lenovo ThinkPad X13 Gen 4 21J3001VGE
AMD Ryzen 7 PRO 7840U
380 Seconds * -19%
Lenovo ThinkPad X13 2-in-1 Gen 5
Intel Core Ultra 7 165U
380 Seconds * -19%
Lenovo Yoga 6 13ALC6
AMD Ryzen 7 5700U
374 Seconds * -17%
Dell XPS 13 Plus 9320 i5-1240p
Intel Core i5-1240P
369 Seconds * -15%
Dell Latitude 13 7350
Intel Core Ultra 5 135U
358 Seconds * -12%
Усредн. модель с Intel Core Ultra 7 258V
  (320 - 414, n=5)
353 Seconds * -10%
MSI Prestige 13 AI Evo
Intel Core Ultra 7 155H
349 Seconds * -9%
Dell XPS 13 9350
Intel Core Ultra 7 256V
339 Seconds * -6%
MSI Prestige 13 AI Plus Evo A2VMG
Intel Core Ultra 7 258V
320 Seconds *
Framework Laptop 13.5 Core Ultra 7 155H
Intel Core Ultra 7 155H
258 Seconds * +19%
Lenovo ThinkPad Z13 Gen 2
AMD Ryzen 7 PRO 7840U
235 Seconds * +27%
Asus ProArt PX13 HN7306
AMD Ryzen AI 9 HX 370
149 Seconds * +53%
7-Zip 18.03 / 7z b 4
Asus ProArt PX13 HN7306
AMD Ryzen AI 9 HX 370
83572 MIPS +133%
Lenovo ThinkPad Z13 Gen 2
AMD Ryzen 7 PRO 7840U
58820 MIPS +64%
Framework Laptop 13.5 Core Ultra 7 155H
Intel Core Ultra 7 155H
52680 MIPS +47%
MSI Prestige 13 AI Evo
Intel Core Ultra 7 155H
42601 MIPS +19%
Dell XPS 13 Plus 9320 i5-1240p
Intel Core i5-1240P
40777 MIPS +14%
Lenovo Yoga 6 13ALC6
AMD Ryzen 7 5700U
39258 MIPS +9%
Dell Latitude 13 7350
Intel Core Ultra 5 135U
38415 MIPS +7%
Lenovo ThinkPad X13 G3 21CM002UGE
AMD Ryzen 5 PRO 6650U
38078 MIPS +6%
Dell XPS 13 9350
Intel Core Ultra 7 256V
35950 MIPS 0%
MSI Prestige 13 AI Plus Evo A2VMG
Intel Core Ultra 7 258V
35923 MIPS
Усредн. модель с Intel Core Ultra 7 258V
  (32198 - 36422, n=5)
35384 MIPS -2%
Lenovo ThinkPad X13 Gen 4 21J3001VGE
AMD Ryzen 7 PRO 7840U
34490 MIPS -4%
HP Dragonfly G4
Intel Core i7-1365U
33476 MIPS -7%
Asus ZenBook S13 OLED UX5304
Intel Core i7-1355U
31233 MIPS -13%
Lenovo ThinkPad X13 2-in-1 Gen 5
Intel Core Ultra 7 165U
30898 MIPS -14%
HP Elite Dragonfly G3
Intel Core i7-1265U
30561 MIPS -15%
Dell Latitude 7350 Detachable
Intel Core Ultra 7 164U
29361 MIPS -18%
7-Zip 18.03 / 7z b 4 -mmt1
Asus ProArt PX13 HN7306
AMD Ryzen AI 9 HX 370
6200 MIPS +12%
Lenovo ThinkPad X13 Gen 4 21J3001VGE
AMD Ryzen 7 PRO 7840U
5973 MIPS +8%
HP Dragonfly G4
Intel Core i7-1365U
5835 MIPS +5%
Dell XPS 13 9350
Intel Core Ultra 7 256V
5727 MIPS +3%
Asus ZenBook S13 OLED UX5304
Intel Core i7-1355U
5689 MIPS +3%
Усредн. модель с Intel Core Ultra 7 258V
  (5547 - 5865, n=5)
5661 MIPS +2%
Lenovo ThinkPad Z13 Gen 2
AMD Ryzen 7 PRO 7840U
5633 MIPS +2%
MSI Prestige 13 AI Plus Evo A2VMG
Intel Core Ultra 7 258V
5547 MIPS
MSI Prestige 13 AI Evo
Intel Core Ultra 7 155H
5458 MIPS -2%
Framework Laptop 13.5 Core Ultra 7 155H
Intel Core Ultra 7 155H
5355 MIPS -3%
Lenovo ThinkPad X13 G3 21CM002UGE
AMD Ryzen 5 PRO 6650U
5175 MIPS -7%
HP Elite Dragonfly G3
Intel Core i7-1265U
4976 MIPS -10%
Dell XPS 13 Plus 9320 i5-1240p
Intel Core i5-1240P
4791 MIPS -14%
Dell Latitude 13 7350
Intel Core Ultra 5 135U
4649 MIPS -16%
Lenovo ThinkPad X13 2-in-1 Gen 5
Intel Core Ultra 7 165U
4644 MIPS -16%
Dell Latitude 7350 Detachable
Intel Core Ultra 7 164U
4619 MIPS -17%
Lenovo Yoga 6 13ALC6
AMD Ryzen 7 5700U
4567 MIPS -18%
Geekbench 6.3 / Multi-Core
Asus ProArt PX13 HN7306
AMD Ryzen AI 9 HX 370
15338 Points +40%
Lenovo ThinkPad Z13 Gen 2
AMD Ryzen 7 PRO 7840U
12069 Points +10%
Framework Laptop 13.5 Core Ultra 7 155H
Intel Core Ultra 7 155H
12027 Points +10%
Lenovo ThinkPad X13 Gen 4 21J3001VGE
AMD Ryzen 7 PRO 7840U
11130 Points +1%
MSI Prestige 13 AI Plus Evo A2VMG
Intel Core Ultra 7 258V
10978 Points
Dell XPS 13 9350
Intel Core Ultra 7 256V
10972 Points 0%
Усредн. модель с Intel Core Ultra 7 258V
  (10730 - 11102, n=5)
10944 Points 0%
MSI Prestige 13 AI Evo
Intel Core Ultra 7 155H
10696 Points -3%
Dell Latitude 13 7350
Intel Core Ultra 5 135U
9514 Points -13%
Lenovo ThinkPad X13 2-in-1 Gen 5
Intel Core Ultra 7 165U
9308 Points -15%
Dell Latitude 7350 Detachable
Intel Core Ultra 7 164U
8411 Points -23%
Geekbench 6.3 / Single-Core
Asus ProArt PX13 HN7306
AMD Ryzen AI 9 HX 370
2847 Points +5%
Dell XPS 13 9350
Intel Core Ultra 7 256V
2778 Points +2%
MSI Prestige 13 AI Plus Evo A2VMG
Intel Core Ultra 7 258V
2723 Points
Усредн. модель с Intel Core Ultra 7 258V
  (2673 - 2757, n=5)
2712 Points 0%
Lenovo ThinkPad X13 Gen 4 21J3001VGE
AMD Ryzen 7 PRO 7840U
2508 Points -8%
Lenovo ThinkPad Z13 Gen 2
AMD Ryzen 7 PRO 7840U
2479 Points -9%
MSI Prestige 13 AI Evo
Intel Core Ultra 7 155H
2441 Points -10%
Framework Laptop 13.5 Core Ultra 7 155H
Intel Core Ultra 7 155H
2414 Points -11%
Lenovo ThinkPad X13 2-in-1 Gen 5
Intel Core Ultra 7 165U
2275 Points -16%
Lenovo ThinkPad X13 2-in-1 Gen 5
Intel Core Ultra 7 165U
2092 Points -23%
Dell Latitude 13 7350
Intel Core Ultra 5 135U
2176 Points -20%
Dell Latitude 7350 Detachable
Intel Core Ultra 7 164U
2136 Points -22%
Geekbench 5.5 / Multi-Core
Asus ProArt PX13 HN7306
AMD Ryzen AI 9 HX 370
14516 Points +50%
Framework Laptop 13.5 Core Ultra 7 155H
Intel Core Ultra 7 155H
11409 Points +18%
Lenovo ThinkPad Z13 Gen 2
AMD Ryzen 7 PRO 7840U
10920 Points +13%
MSI Prestige 13 AI Evo
Intel Core Ultra 7 155H
10017 Points +4%
Lenovo ThinkPad X13 Gen 4 21J3001VGE
AMD Ryzen 7 PRO 7840U
9771 Points +1%
MSI Prestige 13 AI Plus Evo A2VMG
Intel Core Ultra 7 258V
9657 Points
Усредн. модель с Intel Core Ultra 7 258V
  (9330 - 9750, n=5)
9641 Points 0%
Dell XPS 13 9350
Intel Core Ultra 7 256V
9302 Points -4%
HP Dragonfly G4
Intel Core i7-1365U
8778 Points -9%
Dell Latitude 13 7350
Intel Core Ultra 5 135U
8533 Points -12%
Asus ZenBook S13 OLED UX5304
Intel Core i7-1355U
8117 Points -16%
HP Elite Dragonfly G3
Intel Core i7-1265U
8096 Points -16%
Lenovo ThinkPad X13 2-in-1 Gen 5
Intel Core Ultra 7 165U
8028 Points -17%
Dell Latitude 7350 Detachable
Intel Core Ultra 7 164U
7503 Points -22%
Lenovo ThinkPad X13 G3 21CM002UGE
AMD Ryzen 5 PRO 6650U
6171 Points -36%
Dell XPS 13 Plus 9320 i5-1240p
Intel Core i5-1240P
4286 Points -56%
Geekbench 5.5 / Single-Core
Asus ProArt PX13 HN7306
AMD Ryzen AI 9 HX 370
2028 Points +3%
Dell XPS 13 9350
Intel Core Ultra 7 256V
2010 Points +2%
Усредн. модель с Intel Core Ultra 7 258V
  (1956 - 2046, n=5)
1994 Points +1%
MSI Prestige 13 AI Plus Evo A2VMG
Intel Core Ultra 7 258V
1977 Points
HP Dragonfly G4
Intel Core i7-1365U
1902 Points -4%
Lenovo ThinkPad X13 Gen 4 21J3001VGE
AMD Ryzen 7 PRO 7840U
1895 Points -4%
Lenovo ThinkPad Z13 Gen 2
AMD Ryzen 7 PRO 7840U
1853 Points -6%
Asus ZenBook S13 OLED UX5304
Intel Core i7-1355U
1775 Points -10%
MSI Prestige 13 AI Evo
Intel Core Ultra 7 155H
1771 Points -10%
Framework Laptop 13.5 Core Ultra 7 155H
Intel Core Ultra 7 155H
1753 Points -11%
Lenovo ThinkPad X13 2-in-1 Gen 5
Intel Core Ultra 7 165U
1714 Points -13%
Dell XPS 13 Plus 9320 i5-1240p
Intel Core i5-1240P
1588 Points -20%
Dell Latitude 13 7350
Intel Core Ultra 5 135U
1568 Points -21%
Dell Latitude 7350 Detachable
Intel Core Ultra 7 164U
1522 Points -23%
HP Elite Dragonfly G3
Intel Core i7-1265U
1515 Points -23%
Lenovo ThinkPad X13 G3 21CM002UGE
AMD Ryzen 5 PRO 6650U
1433 Points -28%
HWBOT x265 Benchmark v2.2 / 4k Preset
Asus ProArt PX13 HN7306
AMD Ryzen AI 9 HX 370
26.9 fps +89%
Lenovo ThinkPad Z13 Gen 2
AMD Ryzen 7 PRO 7840U
16.9 fps +19%
MSI Prestige 13 AI Plus Evo A2VMG
Intel Core Ultra 7 258V
14.2 fps
Framework Laptop 13.5 Core Ultra 7 155H
Intel Core Ultra 7 155H
14 fps -1%
Lenovo ThinkPad X13 Gen 4 21J3001VGE
AMD Ryzen 7 PRO 7840U
13.6 fps -4%
Dell XPS 13 9350
Intel Core Ultra 7 256V
13.1 fps -8%
Усредн. модель с Intel Core Ultra 7 258V
  (10.5 - 14.2, n=5)
12.5 fps -12%
Dell XPS 13 Plus 9320 i5-1240p
Intel Core i5-1240P
11.5 fps -19%
MSI Prestige 13 AI Evo
Intel Core Ultra 7 155H
10.4 fps -27%
Dell Latitude 13 7350
Intel Core Ultra 5 135U
10.3 fps -27%
Lenovo ThinkPad X13 G3 21CM002UGE
AMD Ryzen 5 PRO 6650U
9.47 fps -33%
Lenovo Yoga 6 13ALC6
AMD Ryzen 7 5700U
9.2 fps -35%
Lenovo ThinkPad X13 2-in-1 Gen 5
Intel Core Ultra 7 165U
9.06 fps -36%
Dell Latitude 7350 Detachable
Intel Core Ultra 7 164U
9.01 fps -37%
HP Dragonfly G4
Intel Core i7-1365U
8.61 fps -39%
Asus ZenBook S13 OLED UX5304
Intel Core i7-1355U
7.83 fps -45%
HP Elite Dragonfly G3
Intel Core i7-1265U
7.76 fps -45%
LibreOffice / 20 Documents To PDF
Lenovo ThinkPad X13 G3 21CM002UGE
AMD Ryzen 5 PRO 6650U
63.2 s * -24%
Dell XPS 13 Plus 9320 i5-1240p
Intel Core i5-1240P
61.8 s * -21%
Lenovo Yoga 6 13ALC6
AMD Ryzen 7 5700U
61.6 s * -21%
HP Elite Dragonfly G3
Intel Core i7-1265U
61.6 s * -21%
Asus ProArt PX13 HN7306
AMD Ryzen AI 9 HX 370
58.5 s * -15%
Lenovo ThinkPad X13 2-in-1 Gen 5
Intel Core Ultra 7 165U
56.4 s * -11%
Усредн. модель с Intel Core Ultra 7 258V
  (44.9 - 59.3, n=5)
53.7 s * -6%
Dell XPS 13 9350
Intel Core Ultra 7 256V
53.2 s * -5%
Dell Latitude 13 7350
Intel Core Ultra 5 135U
52.2 s * -3%
MSI Prestige 13 AI Plus Evo A2VMG
Intel Core Ultra 7 258V
50.9 s *
Lenovo ThinkPad Z13 Gen 2
AMD Ryzen 7 PRO 7840U
48.2 s * +5%
Dell Latitude 7350 Detachable
Intel Core Ultra 7 164U
48 s * +6%
Framework Laptop 13.5 Core Ultra 7 155H
Intel Core Ultra 7 155H
47.9 s * +6%
Asus ZenBook S13 OLED UX5304
Intel Core i7-1355U
47.5 s * +7%
Lenovo ThinkPad X13 Gen 4 21J3001VGE
AMD Ryzen 7 PRO 7840U
45.8 s * +10%
HP Dragonfly G4
Intel Core i7-1365U
45.3 s * +11%
MSI Prestige 13 AI Evo
Intel Core Ultra 7 155H
43.5 s * +15%
R Benchmark 2.5 / Overall mean
Lenovo ThinkPad X13 G3 21CM002UGE
AMD Ryzen 5 PRO 6650U
0.59 sec * -28%
Lenovo Yoga 6 13ALC6
AMD Ryzen 7 5700U
0.587 sec * -28%
Lenovo ThinkPad X13 2-in-1 Gen 5
Intel Core Ultra 7 165U
0.555 sec * -21%
Dell Latitude 13 7350
Intel Core Ultra 5 135U
0.544 sec * -18%
HP Elite Dragonfly G3
Intel Core i7-1265U
0.533 sec * -16%
Dell Latitude 7350 Detachable
Intel Core Ultra 7 164U
0.531 sec * -15%
Dell XPS 13 Plus 9320 i5-1240p
Intel Core i5-1240P
0.524 sec * -14%
Lenovo ThinkPad Z13 Gen 2
AMD Ryzen 7 PRO 7840U
0.4769 sec * -4%
Framework Laptop 13.5 Core Ultra 7 155H
Intel Core Ultra 7 155H
0.4706 sec * -2%
Asus ZenBook S13 OLED UX5304
Intel Core i7-1355U
0.469 sec * -2%
Lenovo ThinkPad X13 Gen 4 21J3001VGE
AMD Ryzen 7 PRO 7840U
0.4687 sec * -2%
MSI Prestige 13 AI Evo
Intel Core Ultra 7 155H
0.4629 sec * -1%
MSI Prestige 13 AI Plus Evo A2VMG
Intel Core Ultra 7 258V
0.4599 sec *
HP Dragonfly G4
Intel Core i7-1365U
0.4586 sec * -0%
Dell XPS 13 9350
Intel Core Ultra 7 256V
0.4578 sec * -0%
Усредн. модель с Intel Core Ultra 7 258V
  (0.4457 - 0.4631, n=5)
0.4559 sec * +1%
Asus ProArt PX13 HN7306
AMD Ryzen AI 9 HX 370
0.4075 sec * +11%
CPU Performance Rating: Percent
Cinebench R23: Multi Core | Single Core
Cinebench R20: CPU (Multi Core) | CPU (Single Core)
Cinebench R15: CPU Multi 64Bit | CPU Single 64Bit
Blender: v2.79 BMW27 CPU
7-Zip 18.03: 7z b 4 | 7z b 4 -mmt1
Geekbench 6.3: Multi-Core | Single-Core
Geekbench 5.5: Multi-Core | Single-Core
HWBOT x265 Benchmark v2.2: 4k Preset
LibreOffice : 20 Documents To PDF
R Benchmark 2.5: Overall mean

* ... меньше = лучше

Cinebench R15 CPU Multi 64Bit
1625 Points
Cinebench R15 OpenGL 64Bit
160.8 fps
Cinebench R15 Ref. Match 64Bit
97.8 %
Cinebench R15 CPU Single 64Bit
281 Points
Cinebench R20 CPU (Multi Core)
4284 Points
Cinebench R20 CPU (Single Core)
709 Points
Cinebench R23 Single Core
1843 Points
Cinebench R23 Multi Core
11097 Points
Cinebench 2024 CPU Single Core
117.2 Points
Cinebench 2024 CPU Multi Core
646 Points
?
Performance Rating
Framework Laptop 13.5 Core Ultra 7 155H
Intel Core Ultra 7 155H, Arc 8-Core
94.2 pt
MSI Prestige 13 AI Plus Evo A2VMG
Intel Core Ultra 7 258V, Arc 140V
85.6 pt
Dell XPS 13 9350
Intel Core Ultra 7 256V, Arc 140V
82 pt
Усредн. модель с Intel Core Ultra 7 258V
 
80.6 pt
Lenovo Yoga Book 9 13IMU9
Intel Core Ultra 7 155U, Graphics 4-Core
69.5 pt
MSI Prestige 13 AI Evo
Intel Core Ultra 7 155H, Arc 8-Core
68.2 pt
HP Dragonfly G4
Intel Core i7-1365U, Iris Xe G7 96EUs
59.7 pt
AIDA64 / FP32 Ray-Trace
MSI Prestige 13 AI Plus Evo A2VMG
Intel Core Ultra 7 258V, Arc 140V
12647 KRay/s
Dell XPS 13 9350
Intel Core Ultra 7 256V, Arc 140V
12287 KRay/s -3%
Framework Laptop 13.5 Core Ultra 7 155H
Intel Core Ultra 7 155H, Arc 8-Core
11486 KRay/s -9%
Усредн. модель с Intel Core Ultra 7 258V
  (9215 - 12781, n=5)
11284 KRay/s -11%
Lenovo Yoga Book 9 13IMU9
Intel Core Ultra 7 155U, Graphics 4-Core
8380 KRay/s -34%
HP Dragonfly G4
Intel Core i7-1365U, Iris Xe G7 96EUs
6720 KRay/s -47%
MSI Prestige 13 AI Evo
Intel Core Ultra 7 155H, Arc 8-Core
6670 KRay/s -47%
AIDA64 / FPU Julia
MSI Prestige 13 AI Plus Evo A2VMG
Intel Core Ultra 7 258V, Arc 140V
63401 Points
Dell XPS 13 9350
Intel Core Ultra 7 256V, Arc 140V
61131 Points -4%
Framework Laptop 13.5 Core Ultra 7 155H
Intel Core Ultra 7 155H, Arc 8-Core
59515 Points -6%
Усредн. модель с Intel Core Ultra 7 258V
  (48758 - 63401, n=5)
59173 Points -7%
MSI Prestige 13 AI Evo
Intel Core Ultra 7 155H, Arc 8-Core
45123 Points -29%
Lenovo Yoga Book 9 13IMU9
Intel Core Ultra 7 155U, Graphics 4-Core
41991 Points -34%
HP Dragonfly G4
Intel Core i7-1365U, Iris Xe G7 96EUs
33777 Points -47%
AIDA64 / CPU SHA3
MSI Prestige 13 AI Plus Evo A2VMG
Intel Core Ultra 7 258V, Arc 140V
2798 MB/s
Framework Laptop 13.5 Core Ultra 7 155H
Intel Core Ultra 7 155H, Arc 8-Core
2750 MB/s -2%
Dell XPS 13 9350
Intel Core Ultra 7 256V, Arc 140V
2713 MB/s -3%
Усредн. модель с Intel Core Ultra 7 258V
  (2271 - 2817, n=5)
2661 MB/s -5%
Lenovo Yoga Book 9 13IMU9
Intel Core Ultra 7 155U, Graphics 4-Core
2252 MB/s -20%
MSI Prestige 13 AI Evo
Intel Core Ultra 7 155H, Arc 8-Core
2039 MB/s -27%
HP Dragonfly G4
Intel Core i7-1365U, Iris Xe G7 96EUs
1754 MB/s -37%
AIDA64 / CPU Queen
Framework Laptop 13.5 Core Ultra 7 155H
Intel Core Ultra 7 155H, Arc 8-Core
86952 Points +75%
HP Dragonfly G4
Intel Core i7-1365U, Iris Xe G7 96EUs
69991 Points +40%
MSI Prestige 13 AI Evo
Intel Core Ultra 7 155H, Arc 8-Core
64698 Points +30%
MSI Prestige 13 AI Plus Evo A2VMG
Intel Core Ultra 7 258V, Arc 140V
49818 Points
Усредн. модель с Intel Core Ultra 7 258V
  (49763 - 49818, n=5)
49786 Points 0%
Dell XPS 13 9350
Intel Core Ultra 7 256V, Arc 140V
49622 Points 0%
Lenovo Yoga Book 9 13IMU9
Intel Core Ultra 7 155U, Graphics 4-Core
44936 Points -10%
AIDA64 / FPU SinJulia
Framework Laptop 13.5 Core Ultra 7 155H
Intel Core Ultra 7 155H, Arc 8-Core
8348 Points +89%
MSI Prestige 13 AI Evo
Intel Core Ultra 7 155H, Arc 8-Core
5639 Points +28%
Lenovo Yoga Book 9 13IMU9
Intel Core Ultra 7 155U, Graphics 4-Core
5540 Points +25%
HP Dragonfly G4
Intel Core i7-1365U, Iris Xe G7 96EUs
4589 Points +4%
Dell XPS 13 9350
Intel Core Ultra 7 256V, Arc 140V
4428 Points 0%
MSI Prestige 13 AI Plus Evo A2VMG
Intel Core Ultra 7 258V, Arc 140V
4422 Points
Усредн. модель с Intel Core Ultra 7 258V
  (4103 - 4426, n=5)
4336 Points -2%
AIDA64 / FPU Mandel
MSI Prestige 13 AI Plus Evo A2VMG
Intel Core Ultra 7 258V, Arc 140V
33565 Points
Dell XPS 13 9350
Intel Core Ultra 7 256V, Arc 140V
32410 Points -3%
Усредн. модель с Intel Core Ultra 7 258V
  (25361 - 33565, n=5)
30967 Points -8%
Framework Laptop 13.5 Core Ultra 7 155H
Intel Core Ultra 7 155H, Arc 8-Core
29439 Points -12%
MSI Prestige 13 AI Evo
Intel Core Ultra 7 155H, Arc 8-Core
21671 Points -35%
Lenovo Yoga Book 9 13IMU9
Intel Core Ultra 7 155U, Graphics 4-Core
21082 Points -37%
HP Dragonfly G4
Intel Core i7-1365U, Iris Xe G7 96EUs
16808 Points -50%
AIDA64 / CPU AES
Framework Laptop 13.5 Core Ultra 7 155H
Intel Core Ultra 7 155H, Arc 8-Core
59475 MB/s +46%
MSI Prestige 13 AI Evo
Intel Core Ultra 7 155H, Arc 8-Core
46211 MB/s +14%
Lenovo Yoga Book 9 13IMU9
Intel Core Ultra 7 155U, Graphics 4-Core
45243 MB/s +11%
Dell XPS 13 9350
Intel Core Ultra 7 256V, Arc 140V
40828 MB/s 0%
MSI Prestige 13 AI Plus Evo A2VMG
Intel Core Ultra 7 258V, Arc 140V
40649 MB/s
Усредн. модель с Intel Core Ultra 7 258V
  (38049 - 40753, n=5)
39699 MB/s -2%
HP Dragonfly G4
Intel Core i7-1365U, Iris Xe G7 96EUs
34968 MB/s -14%
AIDA64 / CPU ZLib
Framework Laptop 13.5 Core Ultra 7 155H
Intel Core Ultra 7 155H, Arc 8-Core
813 MB/s +29%
Lenovo Yoga Book 9 13IMU9
Intel Core Ultra 7 155U, Graphics 4-Core
657 MB/s +4%
MSI Prestige 13 AI Plus Evo A2VMG
Intel Core Ultra 7 258V, Arc 140V
632 MB/s
Усредн. модель с Intel Core Ultra 7 258V
  (499 - 632, n=5)
601 MB/s -5%
MSI Prestige 13 AI Evo
Intel Core Ultra 7 155H, Arc 8-Core
582 MB/s -8%
Dell XPS 13 9350
Intel Core Ultra 7 256V, Arc 140V
536 MB/s -15%
HP Dragonfly G4
Intel Core i7-1365U, Iris Xe G7 96EUs
519 MB/s -18%
AIDA64 / FP64 Ray-Trace
MSI Prestige 13 AI Plus Evo A2VMG
Intel Core Ultra 7 258V, Arc 140V
6930 KRay/s
Dell XPS 13 9350
Intel Core Ultra 7 256V, Arc 140V
6506 KRay/s -6%
Усредн. модель с Intel Core Ultra 7 258V
  (4891 - 6930, n=5)
6093 KRay/s -12%
Framework Laptop 13.5 Core Ultra 7 155H
Intel Core Ultra 7 155H, Arc 8-Core
5989 KRay/s -14%
Lenovo Yoga Book 9 13IMU9
Intel Core Ultra 7 155U, Graphics 4-Core
4305 KRay/s -38%
MSI Prestige 13 AI Evo
Intel Core Ultra 7 155H, Arc 8-Core
3569 KRay/s -48%
HP Dragonfly G4
Intel Core i7-1365U, Iris Xe G7 96EUs
3513 KRay/s -49%
AIDA64 / CPU PhotoWorxx
MSI Prestige 13 AI Plus Evo A2VMG
Intel Core Ultra 7 258V, Arc 140V
54881 MPixel/s
Усредн. модель с Intel Core Ultra 7 258V
  (51458 - 54971, n=5)
53828 MPixel/s -2%
Dell XPS 13 9350
Intel Core Ultra 7 256V, Arc 140V
51767 MPixel/s -6%
Framework Laptop 13.5 Core Ultra 7 155H
Intel Core Ultra 7 155H, Arc 8-Core
46620 MPixel/s -15%
Lenovo Yoga Book 9 13IMU9
Intel Core Ultra 7 155U, Graphics 4-Core
44831 MPixel/s -18%
MSI Prestige 13 AI Evo
Intel Core Ultra 7 155H, Arc 8-Core
42674 MPixel/s -22%
HP Dragonfly G4
Intel Core i7-1365U, Iris Xe G7 96EUs
37846 MPixel/s -31%

Производительность системы

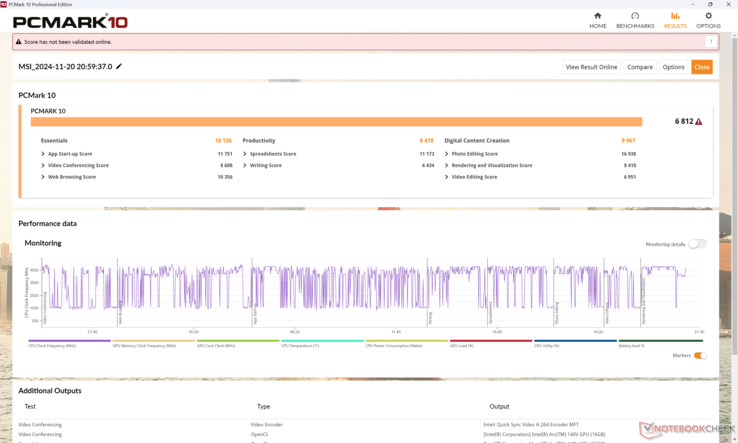
Результаты PCMark 10 и AIDA64 Memory заметно выше, чем у конфигурации Core Ultra 7 155H, благодаря более быстрому интегрированному графическому процессору и оперативной памяти в нашем новом устройстве, соответственно.

PCMark 10 Standard
PCMark 10 Standard
PCMark 10 / Score
Dell XPS 13 9350
Arc 140V, Core Ultra 7 256V, Micron 2550 512GB
6955 Points +2%
Framework Laptop 13.5 Core Ultra 7 155H
Arc 8-Core, Ultra 7 155H
6853 Points +1%
MSI Prestige 13 AI Plus Evo A2VMG
Arc 140V, Core Ultra 7 258V
6812 Points
Усредн. модель с Intel Core Ultra 7 258V, Intel Arc Graphics 140V
  (6265 - 7066, n=5)
6750 Points -1%
Lenovo Yoga Book 9 13IMU9
Graphics 4-Core, Ultra 7 155U
6055 Points -11%
MSI Prestige 13 AI Evo
Arc 8-Core, Ultra 7 155H, Samsung PM9A1 MZVL21T0HCLR
5952 Points -13%
HP Dragonfly G4
Iris Xe G7 96EUs, i7-1365U, Micron 3400 MTFDKBA512TFH 512GB
5690 Points -16%
PCMark 10 / Essentials
Lenovo Yoga Book 9 13IMU9
Graphics 4-Core, Ultra 7 155U
11088 Points +9%
HP Dragonfly G4
Iris Xe G7 96EUs, i7-1365U, Micron 3400 MTFDKBA512TFH 512GB
10853 Points +7%
Framework Laptop 13.5 Core Ultra 7 155H
Arc 8-Core, Ultra 7 155H
10692 Points +5%
MSI Prestige 13 AI Plus Evo A2VMG
Arc 140V, Core Ultra 7 258V
10156 Points
Dell XPS 13 9350
Arc 140V, Core Ultra 7 256V, Micron 2550 512GB
10006 Points -1%
Усредн. модель с Intel Core Ultra 7 258V, Intel Arc Graphics 140V
  (9295 - 10538, n=5)
9857 Points -3%
MSI Prestige 13 AI Evo
Arc 8-Core, Ultra 7 155H, Samsung PM9A1 MZVL21T0HCLR
9833 Points -3%
PCMark 10 / Productivity
Dell XPS 13 9350
Arc 140V, Core Ultra 7 256V, Micron 2550 512GB
9219 Points +9%
MSI Prestige 13 AI Evo
Arc 8-Core, Ultra 7 155H, Samsung PM9A1 MZVL21T0HCLR
8643 Points +2%
Framework Laptop 13.5 Core Ultra 7 155H
Arc 8-Core, Ultra 7 155H
8633 Points +2%
Усредн. модель с Intel Core Ultra 7 258V, Intel Arc Graphics 140V
  (7357 - 9287, n=5)
8615 Points +2%
MSI Prestige 13 AI Plus Evo A2VMG
Arc 140V, Core Ultra 7 258V
8478 Points
Lenovo Yoga Book 9 13IMU9
Graphics 4-Core, Ultra 7 155U
7994 Points -6%
HP Dragonfly G4
Iris Xe G7 96EUs, i7-1365U, Micron 3400 MTFDKBA512TFH 512GB
7206 Points -15%
PCMark 10 / Digital Content Creation
MSI Prestige 13 AI Plus Evo A2VMG
Arc 140V, Core Ultra 7 258V
9967 Points
Dell XPS 13 9350
Arc 140V, Core Ultra 7 256V, Micron 2550 512GB
9898 Points -1%
Усредн. модель с Intel Core Ultra 7 258V, Intel Arc Graphics 140V
  (9728 - 10008, n=5)
9847 Points -1%
Framework Laptop 13.5 Core Ultra 7 155H
Arc 8-Core, Ultra 7 155H
9465 Points -5%
Lenovo Yoga Book 9 13IMU9
Graphics 4-Core, Ultra 7 155U
6797 Points -32%
MSI Prestige 13 AI Evo
Arc 8-Core, Ultra 7 155H, Samsung PM9A1 MZVL21T0HCLR
6735 Points -32%
HP Dragonfly G4
Iris Xe G7 96EUs, i7-1365U, Micron 3400 MTFDKBA512TFH 512GB
6392 Points -36%
CrossMark / Overall
Dell XPS 13 9350
Arc 140V, Core Ultra 7 256V, Micron 2550 512GB
1736 Points +1%
MSI Prestige 13 AI Plus Evo A2VMG
Arc 140V, Core Ultra 7 258V
1717 Points
Framework Laptop 13.5 Core Ultra 7 155H
Arc 8-Core, Ultra 7 155H
1686 Points -2%
Усредн. модель с Intel Core Ultra 7 258V, Intel Arc Graphics 140V
  (1623 - 1737, n=5)
1680 Points -2%
HP Dragonfly G4
Iris Xe G7 96EUs, i7-1365U, Micron 3400 MTFDKBA512TFH 512GB
1628 Points -5%
Lenovo Yoga Book 9 13IMU9
Graphics 4-Core, Ultra 7 155U
1467 Points -15%
MSI Prestige 13 AI Evo
Arc 8-Core, Ultra 7 155H, Samsung PM9A1 MZVL21T0HCLR
1455 Points -15%
CrossMark / Productivity
Dell XPS 13 9350
Arc 140V, Core Ultra 7 256V, Micron 2550 512GB
1682 Points +2%
MSI Prestige 13 AI Plus Evo A2VMG
Arc 140V, Core Ultra 7 258V
1646 Points
HP Dragonfly G4
Iris Xe G7 96EUs, i7-1365U, Micron 3400 MTFDKBA512TFH 512GB
1620 Points -2%
Усредн. модель с Intel Core Ultra 7 258V, Intel Arc Graphics 140V
  (1558 - 1670, n=5)
1616 Points -2%
Framework Laptop 13.5 Core Ultra 7 155H
Arc 8-Core, Ultra 7 155H
1607 Points -2%
MSI Prestige 13 AI Evo
Arc 8-Core, Ultra 7 155H, Samsung PM9A1 MZVL21T0HCLR
1454 Points -12%
Lenovo Yoga Book 9 13IMU9
Graphics 4-Core, Ultra 7 155U
1443 Points -12%
CrossMark / Creativity
MSI Prestige 13 AI Plus Evo A2VMG
Arc 140V, Core Ultra 7 258V
1959 Points
Dell XPS 13 9350
Arc 140V, Core Ultra 7 256V, Micron 2550 512GB
1953 Points 0%
Усредн. модель с Intel Core Ultra 7 258V, Intel Arc Graphics 140V
  (1846 - 1971, n=5)
1907 Points -3%
Framework Laptop 13.5 Core Ultra 7 155H
Arc 8-Core, Ultra 7 155H
1904 Points -3%
HP Dragonfly G4
Iris Xe G7 96EUs, i7-1365U, Micron 3400 MTFDKBA512TFH 512GB
1731 Points -12%
Lenovo Yoga Book 9 13IMU9
Graphics 4-Core, Ultra 7 155U
1566 Points -20%
MSI Prestige 13 AI Evo
Arc 8-Core, Ultra 7 155H, Samsung PM9A1 MZVL21T0HCLR
1519 Points -22%
CrossMark / Responsiveness
HP Dragonfly G4
Iris Xe G7 96EUs, i7-1365U, Micron 3400 MTFDKBA512TFH 512GB
1373 Points +5%
Framework Laptop 13.5 Core Ultra 7 155H
Arc 8-Core, Ultra 7 155H
1351 Points +3%
Dell XPS 13 9350
Arc 140V, Core Ultra 7 256V, Micron 2550 512GB
1343 Points +2%
MSI Prestige 13 AI Plus Evo A2VMG
Arc 140V, Core Ultra 7 258V
1311 Points
Усредн. модель с Intel Core Ultra 7 258V, Intel Arc Graphics 140V
  (1251 - 1338, n=5)
1293 Points -1%
MSI Prestige 13 AI Evo
Arc 8-Core, Ultra 7 155H, Samsung PM9A1 MZVL21T0HCLR
1283 Points -2%
Lenovo Yoga Book 9 13IMU9
Graphics 4-Core, Ultra 7 155U
1266 Points -3%
WebXPRT 3 / Overall
Dell XPS 13 9350
Arc 140V, Core Ultra 7 256V, Micron 2550 512GB
310 Points +2%
HP Dragonfly G4
Iris Xe G7 96EUs, i7-1365U, Micron 3400 MTFDKBA512TFH 512GB
305 Points +1%
MSI Prestige 13 AI Plus Evo A2VMG
Arc 140V, Core Ultra 7 258V
303 Points
Framework Laptop 13.5 Core Ultra 7 155H
Arc 8-Core, Ultra 7 155H
288 Points -5%
Усредн. модель с Intel Core Ultra 7 258V, Intel Arc Graphics 140V
  (260 - 303, n=4)
280 Points -8%
Lenovo Yoga Book 9 13IMU9
Graphics 4-Core, Ultra 7 155U
272 Points -10%
MSI Prestige 13 AI Evo
Arc 8-Core, Ultra 7 155H, Samsung PM9A1 MZVL21T0HCLR
261 Points -14%
WebXPRT 4 / Overall
MSI Prestige 13 AI Plus Evo A2VMG
Arc 140V, Core Ultra 7 258V
287 Points
Dell XPS 13 9350
Arc 140V, Core Ultra 7 256V, Micron 2550 512GB
286 Points 0%
Усредн. модель с Intel Core Ultra 7 258V, Intel Arc Graphics 140V
  (251 - 287, n=5)
270 Points -6%
HP Dragonfly G4
Iris Xe G7 96EUs, i7-1365U, Micron 3400 MTFDKBA512TFH 512GB
266 Points -7%
Framework Laptop 13.5 Core Ultra 7 155H
Arc 8-Core, Ultra 7 155H
255 Points -11%
Lenovo Yoga Book 9 13IMU9
Graphics 4-Core, Ultra 7 155U
250 Points -13%
MSI Prestige 13 AI Evo
Arc 8-Core, Ultra 7 155H, Samsung PM9A1 MZVL21T0HCLR
241 Points -16%
Mozilla Kraken 1.1 / Total
Lenovo Yoga Book 9 13IMU9
Graphics 4-Core, Ultra 7 155U
548 ms * -16%
MSI Prestige 13 AI Evo
Arc 8-Core, Ultra 7 155H, Samsung PM9A1 MZVL21T0HCLR
542 ms * -15%
Framework Laptop 13.5 Core Ultra 7 155H
Arc 8-Core, Ultra 7 155H
532 ms * -12%
Усредн. модель с Intel Core Ultra 7 258V, Intel Arc Graphics 140V
  (468 - 559, n=5)
508 ms * -7%
HP Dragonfly G4
Iris Xe G7 96EUs, i7-1365U, Micron 3400 MTFDKBA512TFH 512GB
494 ms * -4%
MSI Prestige 13 AI Plus Evo A2VMG
Arc 140V, Core Ultra 7 258V
473 ms *
Dell XPS 13 9350
Arc 140V, Core Ultra 7 256V, Micron 2550 512GB
472 ms * -0%

* ... меньше = лучше

PCMark 10 Score
6812 баллов
?
AIDA64 / Memory Copy
Усредн. модель с Intel Core Ultra 7 258V
  (108474 - 108783, n=5)
108609 MB/s 0%
MSI Prestige 13 AI Plus Evo A2VMG
Intel Core Ultra 7 258V, Arc 140V
108474 MB/s
Dell XPS 13 9350
Intel Core Ultra 7 256V, Arc 140V
101642 MB/s -6%
MSI Prestige 13 AI Evo
Intel Core Ultra 7 155H, Arc 8-Core
81600 MB/s -25%
Lenovo Yoga Book 9 13IMU9
Intel Core Ultra 7 155U, Graphics 4-Core
77717 MB/s -28%
Framework Laptop 13.5 Core Ultra 7 155H
Intel Core Ultra 7 155H, Arc 8-Core
75020 MB/s -31%
HP Dragonfly G4
Intel Core i7-1365U, Iris Xe G7 96EUs
58331 MB/s -46%
AIDA64 / Memory Read
Dell XPS 13 9350
Intel Core Ultra 7 256V, Arc 140V
88013 MB/s +2%
Усредн. модель с Intel Core Ultra 7 258V
  (82846 - 89204, n=5)
86720 MB/s 0%
MSI Prestige 13 AI Plus Evo A2VMG
Intel Core Ultra 7 258V, Arc 140V
86537 MB/s
Framework Laptop 13.5 Core Ultra 7 155H
Intel Core Ultra 7 155H, Arc 8-Core
80746 MB/s -7%
MSI Prestige 13 AI Evo
Intel Core Ultra 7 155H, Arc 8-Core
74299 MB/s -14%
Lenovo Yoga Book 9 13IMU9
Intel Core Ultra 7 155U, Graphics 4-Core
62523 MB/s -28%
HP Dragonfly G4
Intel Core i7-1365U, Iris Xe G7 96EUs
49203 MB/s -43%
AIDA64 / Memory Write
MSI Prestige 13 AI Plus Evo A2VMG
Intel Core Ultra 7 258V, Arc 140V
117897 MB/s
Усредн. модель с Intel Core Ultra 7 258V
  (112837 - 117935, n=5)
116897 MB/s -1%
Dell XPS 13 9350
Intel Core Ultra 7 256V, Arc 140V
112340 MB/s -5%
MSI Prestige 13 AI Evo
Intel Core Ultra 7 155H, Arc 8-Core
75825 MB/s -36%
Framework Laptop 13.5 Core Ultra 7 155H
Intel Core Ultra 7 155H, Arc 8-Core
72451 MB/s -39%
HP Dragonfly G4
Intel Core i7-1365U, Iris Xe G7 96EUs
70434 MB/s -40%
Lenovo Yoga Book 9 13IMU9
Intel Core Ultra 7 155U, Graphics 4-Core
60520 MB/s -49%
AIDA64 / Memory Latency
MSI Prestige 13 AI Evo
Intel Core Ultra 7 155H, Arc 8-Core
146.1 ns * -45%
Lenovo Yoga Book 9 13IMU9
Intel Core Ultra 7 155U, Graphics 4-Core
143.3 ns * -42%
Framework Laptop 13.5 Core Ultra 7 155H
Intel Core Ultra 7 155H, Arc 8-Core
122 ns * -21%
MSI Prestige 13 AI Plus Evo A2VMG
Intel Core Ultra 7 258V, Arc 140V
101.1 ns *
Dell XPS 13 9350
Intel Core Ultra 7 256V, Arc 140V
99.6 ns * +1%
Усредн. модель с Intel Core Ultra 7 258V
  (95.2 - 101.1, n=5)
97.6 ns * +3%
HP Dragonfly G4
Intel Core i7-1365U, Iris Xe G7 96EUs
90.2 ns * +11%

* ... меньше = лучше

Задержка DPC

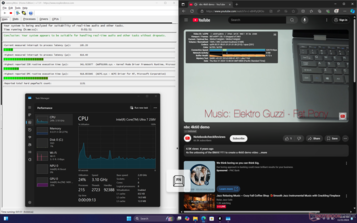
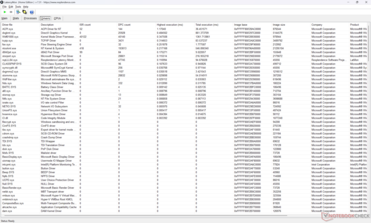
LatencyMon показывает лишь незначительные проблемы с DPC и отсутствие выпавших кадров при воспроизведении видео 4K 60 FPS.

LatencyMon
LatencyMon
Список драйверов
Список драйверов
DPC Latencies / LatencyMon - interrupt to process latency (max), Web, Youtube, Prime95
MSI Prestige 13 AI Evo
Arc 8-Core, Ultra 7 155H, Samsung PM9A1 MZVL21T0HCLR
3035.2 μs * -272%
Lenovo Yoga Book 9 13IMU9
Graphics 4-Core, Ultra 7 155U
1577.5 μs * -93%
HP Dragonfly G4
Iris Xe G7 96EUs, i7-1365U, Micron 3400 MTFDKBA512TFH 512GB
1181 μs * -45%
MSI Prestige 13 AI Plus Evo A2VMG
Arc 140V, Core Ultra 7 258V
816.4 μs *
Framework Laptop 13.5 Core Ultra 7 155H
Arc 8-Core, Ultra 7 155H
665.5 μs * +18%

* ... меньше = лучше

Накопитель

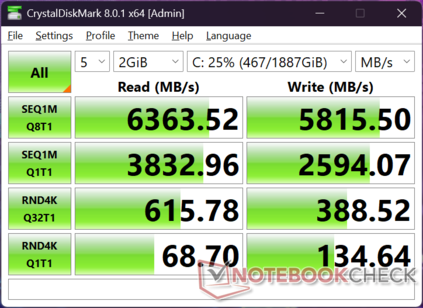
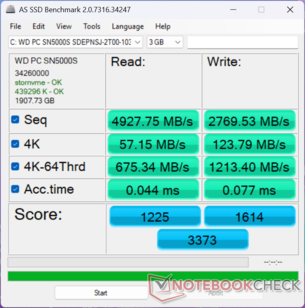
Наше устройство поставляется с WD SN5000S вместо Samsung PM9A1, который использовался в нашей конфигурации Core Ultra 7 155H. Этот накопитель не испытывает никаких проблем с дросселированием, с которыми мы столкнулись на оригинальном Prestige 13 AI.

CDM 8
CDM 8
AS SSD
AS SSD
CDM 5/6 Read Seq Q32T1: 6211 MB/s
CDM 5/6 Write Seq Q32T1: 5810 MB/s
CDM 5/6 Read 4K Q32T1: 628 MB/s
CDM 5/6 Write 4K Q32T1: 409.1 MB/s
CDM 5 Read Seq: 3797 MB/s
CDM 5 Write Seq: 2595 MB/s
CDM 5/6 Read 4K: 69.07 MB/s
CDM 5/6 Write 4K: 125.9 MB/s
Drive Performance Rating - Percent
MSI Prestige 13 AI Evo
Samsung PM9A1 MZVL21T0HCLR
95.4 pt
Framework Laptop 13.5 Core Ultra 7 155H
 
73.1 pt
HP Dragonfly G4
Micron 3400 MTFDKBA512TFH 512GB
64.1 pt
MSI Prestige 13 AI Plus Evo A2VMG
 
57.9 pt
Lenovo Yoga Book 9 13IMU9
 
57.2 pt
Dell XPS 13 9350
Micron 2550 512GB
50.6 pt
DiskSpd
seq read
MSI Prestige 13 AI Evo
Samsung PM9A1 MZVL21T0HCLR
4501 (4492.31min - 4501.34max) MB/s +79%
Framework Laptop 13.5 Core Ultra 7 155H
 
4012 (4000.53min - 4012.27max) MB/s +60%
Lenovo Yoga Book 9 13IMU9
 
3321 (3281.98min - 3320.91max) MB/s +32%
HP Dragonfly G4
Micron 3400 MTFDKBA512TFH 512GB
3312 (3304.27min - 3312.03max) MB/s +32%
MSI Prestige 13 AI Plus Evo A2VMG
 
2513 (2459.65min - 2513.23max) MB/s
Dell XPS 13 9350
Micron 2550 512GB
2416 (2299.74min - 2415.91max) MB/s -4%
seq write
MSI Prestige 13 AI Evo
Samsung PM9A1 MZVL21T0HCLR
4460 (4450.9min - 4460.43max) MB/s +72%
Framework Laptop 13.5 Core Ultra 7 155H
 
3701 (3556.54min - 3701.05max) MB/s +43%
HP Dragonfly G4
Micron 3400 MTFDKBA512TFH 512GB
3342 (3270.72min - 3341.6max) MB/s +29%
Lenovo Yoga Book 9 13IMU9
 
2964 (2739.3min - 2964.06max) MB/s +14%
MSI Prestige 13 AI Plus Evo A2VMG
 
2590 (2240.31min - 2590.4max) MB/s
Dell XPS 13 9350
Micron 2550 512GB
2477 (2281.75min - 2476.53max) MB/s -4%
seq q8 t1 read
MSI Prestige 13 AI Evo
Samsung PM9A1 MZVL21T0HCLR
7100 (6554.33min - 7100.12max) MB/s +11%
Framework Laptop 13.5 Core Ultra 7 155H
 
6966 (6085.09min - 6965.9max) MB/s +9%
HP Dragonfly G4
Micron 3400 MTFDKBA512TFH 512GB
6628 (6115.78min - 6627.63max) MB/s +4%
MSI Prestige 13 AI Plus Evo A2VMG
 
6385 (5141.58min - 6384.59max) MB/s
Lenovo Yoga Book 9 13IMU9
 
5234 (4365.43min - 5234.3max) MB/s -18%
Dell XPS 13 9350
Micron 2550 512GB
5057 (4337.25min - 5057.07max) MB/s -21%
seq q8 t1 write
Framework Laptop 13.5 Core Ultra 7 155H
 
6299 (6214.64min - 6298.78max) MB/s +8%
MSI Prestige 13 AI Plus Evo A2VMG
 
5859 (4402.55min - 5859.05max) MB/s
MSI Prestige 13 AI Evo
Samsung PM9A1 MZVL21T0HCLR
5281 (5261.13min - 5280.63max) MB/s -10%
Lenovo Yoga Book 9 13IMU9
 
4403 (4331.88min - 4402.97max) MB/s -25%
Dell XPS 13 9350
Micron 2550 512GB
4062 (3975.8min - 4061.61max) MB/s -31%
HP Dragonfly G4
Micron 3400 MTFDKBA512TFH 512GB
3965 (3820.5min - 3965.05max) MB/s -32%
4k q1 t1 read
MSI Prestige 13 AI Evo
Samsung PM9A1 MZVL21T0HCLR
85.9 (85.31min - 85.9max) MB/s +41%
Framework Laptop 13.5 Core Ultra 7 155H
 
72.4 (71.31min - 72.35max) MB/s +19%
HP Dragonfly G4
Micron 3400 MTFDKBA512TFH 512GB
67.2 (66.32min - 67.16max) MB/s +11%
MSI Prestige 13 AI Plus Evo A2VMG
 
60.8 (59.81min - 60.77max) MB/s
Lenovo Yoga Book 9 13IMU9
 
60.4 (57.59min - 60.39max) MB/s -1%
Dell XPS 13 9350
Micron 2550 512GB
53.2 (50.58min - 53.24max) MB/s -12%
4k q1 t1 write
MSI Prestige 13 AI Evo
Samsung PM9A1 MZVL21T0HCLR
204 (200.8min - 203.91max) MB/s +79%
Dell XPS 13 9350
Micron 2550 512GB
139.2 (136.33min - 139.15max) MB/s +22%
HP Dragonfly G4
Micron 3400 MTFDKBA512TFH 512GB
138.9 (137.35min - 138.92max) MB/s +22%
Framework Laptop 13.5 Core Ultra 7 155H
 
132.5 (124.75min - 132.53max) MB/s +16%
Lenovo Yoga Book 9 13IMU9
 
127.7 (123.8min - 127.74max) MB/s +12%
MSI Prestige 13 AI Plus Evo A2VMG
 
114 (109.91min - 113.96max) MB/s
4k q32 t16 read
MSI Prestige 13 AI Evo
Samsung PM9A1 MZVL21T0HCLR
3215 (2358.16min - 3214.63max) MB/s +343%
Framework Laptop 13.5 Core Ultra 7 155H
 
905 (794.35min - 904.75max) MB/s +25%
MSI Prestige 13 AI Plus Evo A2VMG
 
726 (612.46min - 725.52max) MB/s
Lenovo Yoga Book 9 13IMU9
 
705 (687.5min - 705.08max) MB/s -3%
HP Dragonfly G4
Micron 3400 MTFDKBA512TFH 512GB
690 (550.07min - 689.62max) MB/s -5%
Dell XPS 13 9350
Micron 2550 512GB
640 (630.5min - 640.27max) MB/s -12%
4k q32 t16 write
MSI Prestige 13 AI Evo
Samsung PM9A1 MZVL21T0HCLR
2288 (1575.7min - 2287.8max) MB/s +554%
HP Dragonfly G4
Micron 3400 MTFDKBA512TFH 512GB
389 (345.44min - 388.55max) MB/s +11%
Framework Laptop 13.5 Core Ultra 7 155H
 
377 (342.78min - 377.4max) MB/s +8%
Dell XPS 13 9350
Micron 2550 512GB
374 (359.04min - 373.65max) MB/s +7%
Lenovo Yoga Book 9 13IMU9
 
358 (344.36min - 358.28max) MB/s +2%
MSI Prestige 13 AI Plus Evo A2VMG
 
350 (325.75min - 350.22max) MB/s
AS SSD
Score Total
MSI Prestige 13 AI Evo
Samsung PM9A1 MZVL21T0HCLR
5770 Points +71%
Framework Laptop 13.5 Core Ultra 7 155H
 
4631 Points +37%
HP Dragonfly G4
Micron 3400 MTFDKBA512TFH 512GB
4171 Points +24%
Lenovo Yoga Book 9 13IMU9
 
3586 Points +6%
MSI Prestige 13 AI Plus Evo A2VMG
 
3373 Points
Dell XPS 13 9350
Micron 2550 512GB
3176 Points -6%
Score Read
MSI Prestige 13 AI Evo
Samsung PM9A1 MZVL21T0HCLR
1756 Points +43%
Framework Laptop 13.5 Core Ultra 7 155H
 
1430 Points +17%
MSI Prestige 13 AI Plus Evo A2VMG
 
1225 Points
Lenovo Yoga Book 9 13IMU9
 
1171 Points -4%
HP Dragonfly G4
Micron 3400 MTFDKBA512TFH 512GB
1169 Points -5%
Dell XPS 13 9350
Micron 2550 512GB
1096 Points -11%
Score Write
MSI Prestige 13 AI Evo
Samsung PM9A1 MZVL21T0HCLR
3156 Points +96%
Framework Laptop 13.5 Core Ultra 7 155H
 
2552 Points +58%
HP Dragonfly G4
Micron 3400 MTFDKBA512TFH 512GB
2506 Points +55%
Lenovo Yoga Book 9 13IMU9
 
1885 Points +17%
MSI Prestige 13 AI Plus Evo A2VMG
 
1614 Points
Dell XPS 13 9350
Micron 2550 512GB
1572 Points -3%
Seq Read
MSI Prestige 13 AI Evo
Samsung PM9A1 MZVL21T0HCLR
5470 MB/s +11%
Framework Laptop 13.5 Core Ultra 7 155H
 
5447.92 MB/s +11%
MSI Prestige 13 AI Plus Evo A2VMG
 
4927.75 MB/s
HP Dragonfly G4
Micron 3400 MTFDKBA512TFH 512GB
4510.61 MB/s -8%
Lenovo Yoga Book 9 13IMU9
 
4133 MB/s -16%
Dell XPS 13 9350
Micron 2550 512GB
3933.86 MB/s -20%
Seq Write
MSI Prestige 13 AI Evo
Samsung PM9A1 MZVL21T0HCLR
4344 MB/s +57%
Framework Laptop 13.5 Core Ultra 7 155H
 
3481.82 MB/s +26%
MSI Prestige 13 AI Plus Evo A2VMG
 
2769.53 MB/s
Dell XPS 13 9350
Micron 2550 512GB
2608.98 MB/s -6%
Lenovo Yoga Book 9 13IMU9
 
2415.77 MB/s -13%
HP Dragonfly G4
Micron 3400 MTFDKBA512TFH 512GB
2127.08 MB/s -23%
4K Read
MSI Prestige 13 AI Evo
Samsung PM9A1 MZVL21T0HCLR
72 MB/s +26%
Framework Laptop 13.5 Core Ultra 7 155H
 
65.88 MB/s +15%
HP Dragonfly G4
Micron 3400 MTFDKBA512TFH 512GB
61.53 MB/s +8%
Lenovo Yoga Book 9 13IMU9
 
58.39 MB/s +2%
MSI Prestige 13 AI Plus Evo A2VMG
 
57.15 MB/s
Dell XPS 13 9350
Micron 2550 512GB
51.9 MB/s -9%
4K Write
HP Dragonfly G4
Micron 3400 MTFDKBA512TFH 512GB
185.58 MB/s +50%
MSI Prestige 13 AI Evo
Samsung PM9A1 MZVL21T0HCLR
179.9 MB/s +45%
Framework Laptop 13.5 Core Ultra 7 155H
 
172.76 MB/s +40%
Lenovo Yoga Book 9 13IMU9
 
167.15 MB/s +35%
Dell XPS 13 9350
Micron 2550 512GB
138.37 MB/s +12%
MSI Prestige 13 AI Plus Evo A2VMG
 
123.79 MB/s
4K-64 Read
MSI Prestige 13 AI Evo
Samsung PM9A1 MZVL21T0HCLR
1137 MB/s +68%
Framework Laptop 13.5 Core Ultra 7 155H
 
818.96 MB/s +21%
Lenovo Yoga Book 9 13IMU9
 
699.78 MB/s +4%
MSI Prestige 13 AI Plus Evo A2VMG
 
675.34 MB/s
HP Dragonfly G4
Micron 3400 MTFDKBA512TFH 512GB
656.17 MB/s -3%
Dell XPS 13 9350
Micron 2550 512GB
650.78 MB/s -4%
4K-64 Write
MSI Prestige 13 AI Evo
Samsung PM9A1 MZVL21T0HCLR
2542 MB/s +109%
HP Dragonfly G4
Micron 3400 MTFDKBA512TFH 512GB
2107.89 MB/s +74%
Framework Laptop 13.5 Core Ultra 7 155H
 
2030.88 MB/s +67%
Lenovo Yoga Book 9 13IMU9
 
1476.23 MB/s +22%
MSI Prestige 13 AI Plus Evo A2VMG
 
1213.4 MB/s
Dell XPS 13 9350
Micron 2550 512GB
1172.49 MB/s -3%
Access Time Read
Dell XPS 13 9350
Micron 2550 512GB
0.091 ms * -107%
Lenovo Yoga Book 9 13IMU9
 
0.084 ms * -91%
HP Dragonfly G4
Micron 3400 MTFDKBA512TFH 512GB
0.055 ms * -25%
Framework Laptop 13.5 Core Ultra 7 155H
 
0.048 ms * -9%
MSI Prestige 13 AI Plus Evo A2VMG
 
0.044 ms *
MSI Prestige 13 AI Evo
Samsung PM9A1 MZVL21T0HCLR
0.033 ms * +25%
Access Time Write
MSI Prestige 13 AI Plus Evo A2VMG
 
0.077 ms *
Dell XPS 13 9350
Micron 2550 512GB
0.076 ms * +1%
HP Dragonfly G4
Micron 3400 MTFDKBA512TFH 512GB
0.067 ms * +13%
Lenovo Yoga Book 9 13IMU9
 
0.066 ms * +14%
Framework Laptop 13.5 Core Ultra 7 155H
 
0.062 ms * +19%
MSI Prestige 13 AI Evo
Samsung PM9A1 MZVL21T0HCLR
0.025 ms * +68%

* ... меньше = лучше

Чтение в DiskSpd, Глубина запроса 8

036072010801440180021602520288032403600396043204680504054005760612064806840Tooltip
MSI Prestige 13 AI Plus Evo A2VMG  ; diskspd 2.0.17 f: Ø6342 (5221.53-6365.13)
MSI Prestige 13 AI Evo Samsung PM9A1 MZVL21T0HCLR; diskspd 2.0.17 f: Ø6110 (3287.71-7112.49)

Видеокарта

Новый интегрированный Arc 140V GPU это, пожалуй, одно из самых больших усовершенствований по сравнению с Arc 8 в конфигурации Core Ultra 7 155H. результаты 3DMark в 1,5-2 раза быстрее, и это очень хорошо отражается на таких игровых сценариях, как GTA V или даже Cyberpunk 2077 , где конфигурация Core Ultra 7 155H , как правило, отстает.

Профиль мощностиОценка графикиОценка физикиКомбинированный балл
Режим производительности (Cooler Boost включен)9513218423426
Режим производительности (Cooler Boost off)9503220433474
Сбалансированный режим9376210373019
Питание от аккумулятора9471218373440

Работа системы с включенным Cooler Boost, в сбалансированном режиме или даже просто от батареи не окажет существенного влияния на производительность, как показано в нашей таблице результатов Fire Strike выше.

3DMark 11
3DMark 11
Fire Strike
Fire Strike
Time Spy
Time Spy
Скоростной путь
Скоростной путь
Steel Nomad
Steel Nomad
 
3DMark Performance Rating - Percent
Asus ProArt PX13 HN7306 -1!
NVIDIA GeForce RTX 4070 Laptop GPU, AMD Ryzen AI 9 HX 370
100 pt
Dell XPS 13 9350
Intel Arc Graphics 140V, Intel Core Ultra 7 256V
50 pt
MSI Prestige 13 AI Plus Evo A2VMG
Intel Arc Graphics 140V, Intel Core Ultra 7 258V
48.7 pt
Усредн. модель с Intel Arc Graphics 140V
 
48 pt
Framework Laptop 13.5 Core Ultra 7 155H
Intel Arc 8-Core iGPU, Intel Core Ultra 7 155H
43.1 pt
Lenovo ThinkPad X13 2-in-1 Gen 5
Intel Graphics 4-Core iGPU (Arc), Intel Core Ultra 7 165U
27.5 pt
Dell Latitude 13 7350
Intel Graphics 4-Core iGPU (Arc), Intel Core Ultra 5 135U
27.5 pt
Lenovo ThinkPad Z13 Gen 2 -1!
AMD Radeon 780M, AMD Ryzen 7 PRO 7840U
27.4 pt
Lenovo ThinkPad X13 G3 21CM002UGE
AMD Radeon 660M, AMD Ryzen 5 PRO 6650U
26.6 pt
HP Elite Dragonfly G3
Intel Iris Xe Graphics G7 96EUs, Intel Core i7-1265U
24.5 pt
Lenovo ThinkPad X13 Gen 4 21J3001VGE -2!
AMD Radeon 780M, AMD Ryzen 7 PRO 7840U
24.3 pt
Dell Latitude 7350 Detachable
Intel Graphics 4-Core iGPU (Arc), Intel Core Ultra 7 164U
23.4 pt
Lenovo Yoga 6 13ALC6
AMD Radeon RX Vega 8 (Ryzen 4000/5000), AMD Ryzen 7 5700U
21.4 pt
MSI Prestige 13 AI Evo -1!
Intel Arc 8-Core iGPU, Intel Core Ultra 7 155H
19.9 pt
HP Dragonfly G4 -1!
Intel Iris Xe Graphics G7 96EUs, Intel Core i7-1365U
16.7 pt
Dell XPS 13 Plus 9320 i5-1240p
Intel Iris Xe Graphics G7 80EUs, Intel Core i5-1240P
16.6 pt
Asus ZenBook S13 OLED UX5304 -1!
Intel Iris Xe Graphics G7 96EUs, Intel Core i7-1355U
16.3 pt
3DMark 11 - 1280x720 Performance GPU
Asus ProArt PX13 HN7306
NVIDIA GeForce RTX 4070 Laptop GPU, AMD Ryzen AI 9 HX 370
38156 Points +263%
Framework Laptop 13.5 Core Ultra 7 155H
Intel Arc 8-Core iGPU, Intel Core Ultra 7 155H
12739 Points +21%
Lenovo ThinkPad Z13 Gen 2
AMD Radeon 780M, AMD Ryzen 7 PRO 7840U
12223 Points +16%
Усредн. модель с Intel Arc Graphics 140V
  (10499 - 11335, n=8)
10810 Points +3%
Dell XPS 13 9350
Intel Arc Graphics 140V, Intel Core Ultra 7 256V
10651 Points +1%
MSI Prestige 13 AI Plus Evo A2VMG
Intel Arc Graphics 140V, Intel Core Ultra 7 258V
10499 Points
MSI Prestige 13 AI Evo
Intel Arc 8-Core iGPU, Intel Core Ultra 7 155H
8064 Points -23%
Dell Latitude 13 7350
Intel Graphics 4-Core iGPU (Arc), Intel Core Ultra 5 135U
6827 Points -35%
Lenovo ThinkPad X13 G3 21CM002UGE
AMD Radeon 660M, AMD Ryzen 5 PRO 6650U
6743 Points -36%
Lenovo ThinkPad X13 2-in-1 Gen 5
Intel Graphics 4-Core iGPU (Arc), Intel Core Ultra 7 165U
6587 Points -37%
HP Dragonfly G4
Intel Iris Xe Graphics G7 96EUs, Intel Core i7-1365U
6440 Points -39%
Asus ZenBook S13 OLED UX5304
Intel Iris Xe Graphics G7 96EUs, Intel Core i7-1355U
6334 Points -40%
Dell Latitude 7350 Detachable
Intel Graphics 4-Core iGPU (Arc), Intel Core Ultra 7 164U
6177 Points -41%
HP Elite Dragonfly G3
Intel Iris Xe Graphics G7 96EUs, Intel Core i7-1265U
6155 Points -41%
Lenovo Yoga 6 13ALC6
AMD Radeon RX Vega 8 (Ryzen 4000/5000), AMD Ryzen 7 5700U
5693 Points -46%
Dell XPS 13 Plus 9320 i5-1240p
Intel Iris Xe Graphics G7 80EUs, Intel Core i5-1240P
5104 Points -51%
3DMark
1280x720 Cloud Gate Standard Graphics
Dell XPS 13 9350
Intel Arc Graphics 140V, Intel Core Ultra 7 256V
54751 Points +4%
MSI Prestige 13 AI Plus Evo A2VMG
Intel Arc Graphics 140V, Intel Core Ultra 7 258V
52639 Points
Усредн. модель с Intel Arc Graphics 140V
  (42294 - 56072, n=6)
51974 Points -1%
Framework Laptop 13.5 Core Ultra 7 155H
Intel Arc 8-Core iGPU, Intel Core Ultra 7 155H
42140 Points -20%
Lenovo ThinkPad X13 G3 21CM002UGE
AMD Radeon 660M, AMD Ryzen 5 PRO 6650U
31180 Points -41%
Lenovo ThinkPad X13 2-in-1 Gen 5
Intel Graphics 4-Core iGPU (Arc), Intel Core Ultra 7 165U
29783 Points -43%
Dell Latitude 13 7350
Intel Graphics 4-Core iGPU (Arc), Intel Core Ultra 5 135U
29765 Points -43%
HP Elite Dragonfly G3
Intel Iris Xe Graphics G7 96EUs, Intel Core i7-1265U
27360 Points -48%
Lenovo Yoga 6 13ALC6
AMD Radeon RX Vega 8 (Ryzen 4000/5000), AMD Ryzen 7 5700U
26080 Points -50%
Dell Latitude 7350 Detachable
Intel Graphics 4-Core iGPU (Arc), Intel Core Ultra 7 164U
23935 Points -55%
Dell XPS 13 Plus 9320 i5-1240p
Intel Iris Xe Graphics G7 80EUs, Intel Core i5-1240P
15200 Points -71%
1920x1080 Fire Strike Graphics
Asus ProArt PX13 HN7306
NVIDIA GeForce RTX 4070 Laptop GPU, AMD Ryzen AI 9 HX 370
28172 Points +196%
MSI Prestige 13 AI Plus Evo A2VMG
Intel Arc Graphics 140V, Intel Core Ultra 7 258V
9503 Points
Dell XPS 13 9350
Intel Arc Graphics 140V, Intel Core Ultra 7 256V
9492 Points 0%
Усредн. модель с Intel Arc Graphics 140V
  (6790 - 9930, n=9)
9167 Points -4%
Framework Laptop 13.5 Core Ultra 7 155H
Intel Arc 8-Core iGPU, Intel Core Ultra 7 155H
8513 Points -10%
Lenovo ThinkPad Z13 Gen 2
AMD Radeon 780M, AMD Ryzen 7 PRO 7840U
7359 Points -23%
Lenovo ThinkPad X13 Gen 4 21J3001VGE
AMD Radeon 780M, AMD Ryzen 7 PRO 7840U
7197 Points -24%
MSI Prestige 13 AI Evo
Intel Arc 8-Core iGPU, Intel Core Ultra 7 155H
5568 Points -41%
Lenovo ThinkPad X13 2-in-1 Gen 5
Intel Graphics 4-Core iGPU (Arc), Intel Core Ultra 7 165U
5465 Points -42%
Dell Latitude 13 7350
Intel Graphics 4-Core iGPU (Arc), Intel Core Ultra 5 135U
5366 Points -44%
HP Dragonfly G4
Intel Iris Xe Graphics G7 96EUs, Intel Core i7-1365U
5175 Points -46%
Asus ZenBook S13 OLED UX5304
Intel Iris Xe Graphics G7 96EUs, Intel Core i7-1355U
5101 Points -46%
HP Elite Dragonfly G3
Intel Iris Xe Graphics G7 96EUs, Intel Core i7-1265U
4954 Points -48%
Lenovo ThinkPad X13 G3 21CM002UGE
AMD Radeon 660M, AMD Ryzen 5 PRO 6650U
4848 Points -49%
Dell Latitude 7350 Detachable
Intel Graphics 4-Core iGPU (Arc), Intel Core Ultra 7 164U
4785 Points -50%
Dell XPS 13 Plus 9320 i5-1240p
Intel Iris Xe Graphics G7 80EUs, Intel Core i5-1240P
4086 Points -57%
Lenovo Yoga 6 13ALC6
AMD Radeon RX Vega 8 (Ryzen 4000/5000), AMD Ryzen 7 5700U
3572 Points -62%
2560x1440 Time Spy Graphics
Asus ProArt PX13 HN7306
NVIDIA GeForce RTX 4070 Laptop GPU, AMD Ryzen AI 9 HX 370
10693 Points +167%
Dell XPS 13 9350
Intel Arc Graphics 140V, Intel Core Ultra 7 256V
4115 Points +3%
MSI Prestige 13 AI Plus Evo A2VMG
Intel Arc Graphics 140V, Intel Core Ultra 7 258V
4006 Points
Усредн. модель с Intel Arc Graphics 140V
  (2955 - 4227, n=12)
3867 Points -3%
Framework Laptop 13.5 Core Ultra 7 155H
Intel Arc 8-Core iGPU, Intel Core Ultra 7 155H
3401 Points -15%
Lenovo ThinkPad Z13 Gen 2
AMD Radeon 780M, AMD Ryzen 7 PRO 7840U
2555 Points -36%
Lenovo ThinkPad X13 Gen 4 21J3001VGE
AMD Radeon 780M, AMD Ryzen 7 PRO 7840U
2472 Points -38%
Lenovo ThinkPad X13 2-in-1 Gen 5
Intel Graphics 4-Core iGPU (Arc), Intel Core Ultra 7 165U
2037 Points -49%
MSI Prestige 13 AI Evo
Intel Arc 8-Core iGPU, Intel Core Ultra 7 155H
2018 Points -50%
Dell Latitude 13 7350
Intel Graphics 4-Core iGPU (Arc), Intel Core Ultra 5 135U
2005 Points -50%
Dell Latitude 7350 Detachable
Intel Graphics 4-Core iGPU (Arc), Intel Core Ultra 7 164U
1808 Points -55%
HP Dragonfly G4
Intel Iris Xe Graphics G7 96EUs, Intel Core i7-1365U
1579 Points -61%
HP Elite Dragonfly G3
Intel Iris Xe Graphics G7 96EUs, Intel Core i7-1265U
1549 Points -61%
Lenovo ThinkPad X13 G3 21CM002UGE
AMD Radeon 660M, AMD Ryzen 5 PRO 6650U
1544 Points -61%
Asus ZenBook S13 OLED UX5304
Intel Iris Xe Graphics G7 96EUs, Intel Core i7-1355U
1505 Points -62%
Dell XPS 13 Plus 9320 i5-1240p
Intel Iris Xe Graphics G7 80EUs, Intel Core i5-1240P
1134 Points -72%
Lenovo Yoga 6 13ALC6
AMD Radeon RX Vega 8 (Ryzen 4000/5000), AMD Ryzen 7 5700U
1112 Points -72%
3DMark 11 Performance
11114 баллов
3DMark Cloud Gate Standard Score
33012 баллов
3DMark Fire Strike Score
8732 баллов
3DMark Time Spy Score
4253 баллов
3DMark Steel Nomad Score
681 баллов
?
Blender
v3.3 Classroom HIP/AMD
Lenovo ThinkPad X13 G3 21CM002UGE
AMD Radeon 660M, AMD Ryzen 5 PRO 6650U
548 Seconds *
v3.3 Classroom OPTIX/RTX
Asus ProArt PX13 HN7306
NVIDIA GeForce RTX 4070 Laptop GPU, AMD Ryzen AI 9 HX 370
22 Seconds *
v3.3 Classroom CUDA
Asus ProArt PX13 HN7306
NVIDIA GeForce RTX 4070 Laptop GPU, AMD Ryzen AI 9 HX 370
181 Seconds *
Asus ProArt PX13 HN7306
NVIDIA GeForce RTX 4070 Laptop GPU, AMD Ryzen AI 9 HX 370
34 Seconds *
v3.3 Classroom CPU
Lenovo ThinkPad X13 G3 21CM002UGE
AMD Radeon 660M, AMD Ryzen 5 PRO 6650U
968 Seconds * -82%
HP Elite Dragonfly G3
Intel Iris Xe Graphics G7 96EUs, Intel Core i7-1265U
923 Seconds * -73%
Asus ZenBook S13 OLED UX5304
Intel Iris Xe Graphics G7 96EUs, Intel Core i7-1355U
839 Seconds * -58%
Lenovo ThinkPad X13 2-in-1 Gen 5
Intel Graphics 4-Core iGPU (Arc), Intel Core Ultra 7 165U
827 Seconds * -55%
HP Dragonfly G4
Intel Iris Xe Graphics G7 96EUs, Intel Core i7-1365U
796 Seconds * -50%
Dell Latitude 7350 Detachable
Intel Graphics 4-Core iGPU (Arc), Intel Core Ultra 7 164U
770 Seconds * -45%
Dell Latitude 13 7350
Intel Graphics 4-Core iGPU (Arc), Intel Core Ultra 5 135U
687 Seconds * -29%
Lenovo ThinkPad X13 Gen 4 21J3001VGE
AMD Radeon 780M, AMD Ryzen 7 PRO 7840U
664 Seconds * -25%
MSI Prestige 13 AI Evo
Intel Arc 8-Core iGPU, Intel Core Ultra 7 155H
637 Seconds * -20%
Усредн. модель с Intel Arc Graphics 140V
  (532 - 700, n=7)
583 Seconds * -10%
Dell XPS 13 9350
Intel Arc Graphics 140V, Intel Core Ultra 7 256V
580 Seconds * -9%
MSI Prestige 13 AI Plus Evo A2VMG
Intel Arc Graphics 140V, Intel Core Ultra 7 258V
532 Seconds *
Framework Laptop 13.5 Core Ultra 7 155H
Intel Arc 8-Core iGPU, Intel Core Ultra 7 155H
451 Seconds * +15%
Lenovo ThinkPad Z13 Gen 2
AMD Radeon 780M, AMD Ryzen 7 PRO 7840U
385 Seconds * +28%
v3.3 Classroom oneAPI/Intel
Dell Latitude 7350 Detachable
Intel Graphics 4-Core iGPU (Arc), Intel Core Ultra 7 164U
423 Seconds * -101%
Dell Latitude 13 7350
Intel Graphics 4-Core iGPU (Arc), Intel Core Ultra 5 135U
364 Seconds * -73%
Lenovo ThinkPad X13 2-in-1 Gen 5
Intel Graphics 4-Core iGPU (Arc), Intel Core Ultra 7 165U
347 Seconds * -65%
Framework Laptop 13.5 Core Ultra 7 155H
Intel Arc 8-Core iGPU, Intel Core Ultra 7 155H
235 Seconds * -12%
Усредн. модель с Intel Arc Graphics 140V
  (210 - 217, n=5)
212 Seconds * -1%
Dell XPS 13 9350
Intel Arc Graphics 140V, Intel Core Ultra 7 256V
211 Seconds * -0%
MSI Prestige 13 AI Plus Evo A2VMG
Intel Arc Graphics 140V, Intel Core Ultra 7 258V
210 Seconds *

* ... меньше = лучше

Performance Rating - Percent
MSI Prestige 13 AI Plus Evo A2VMG
Intel Core Ultra 7 258V, Intel Arc Graphics 140V
99.4 pt
Dell XPS 13 9350
Intel Core Ultra 7 256V, Intel Arc Graphics 140V
89.9 pt
Framework Laptop 13.5 Core Ultra 7 155H
Intel Core Ultra 7 155H, Intel Arc 8-Core iGPU
80.5 pt
MSI Prestige 13 AI Evo -2!
Intel Core Ultra 7 155H, Intel Arc 8-Core iGPU
59.5 pt
Lenovo Yoga Book 9 13IMU9 -2!
Intel Core Ultra 7 155U, Intel Graphics 4-Core iGPU (Arc)
55.7 pt
HP Dragonfly G4 -2!
Intel Core i7-1365U, Intel Iris Xe Graphics G7 96EUs
55 pt
Cyberpunk 2077 2.1 Phantom Liberty - 1920x1080 Ultra Preset (FSR off)
MSI Prestige 13 AI Plus Evo A2VMG
Intel Core Ultra 7 258V, Intel Arc Graphics 140V
28.5 (23.3min) fps
Framework Laptop 13.5 Core Ultra 7 155H
Intel Core Ultra 7 155H, Intel Arc 8-Core iGPU
21.1 (17.4min) fps -26%
Dell XPS 13 9350
Intel Core Ultra 7 256V, Intel Arc Graphics 140V
19.1 (15.5min) fps -33%
Lenovo Yoga Book 9 13IMU9
Intel Core Ultra 7 155U, Intel Graphics 4-Core iGPU (Arc)
13 (10.4min) fps -54%
Baldur's Gate 3 - 1920x1080 Ultra Preset
MSI Prestige 13 AI Plus Evo A2VMG
Intel Core Ultra 7 258V, Intel Arc Graphics 140V
29.1 fps
Framework Laptop 13.5 Core Ultra 7 155H
Intel Core Ultra 7 155H, Intel Arc 8-Core iGPU
25.7 fps -12%
Dell XPS 13 9350
Intel Core Ultra 7 256V, Intel Arc Graphics 140V
25.7 fps -12%
GTA V - 1920x1080 Highest Settings possible AA:4xMSAA + FX AF:16x
MSI Prestige 13 AI Plus Evo A2VMG
Intel Core Ultra 7 258V, Intel Arc Graphics 140V
26.7 (3.24min, 21.3P1) fps
Dell XPS 13 9350
Intel Core Ultra 7 256V, Intel Arc Graphics 140V
25.6 (2.46min, 19.6P1) fps -4%
Framework Laptop 13.5 Core Ultra 7 155H
Intel Core Ultra 7 155H, Intel Arc 8-Core iGPU
17.5 (2.07min, 12P1) fps -34%
HP Dragonfly G4
Intel Core i7-1365U, Intel Iris Xe Graphics G7 96EUs
10.1 (4.85min, 6.29P1) fps -62%
MSI Prestige 13 AI Evo
Intel Core Ultra 7 155H, Intel Arc 8-Core iGPU
9.97 (1.989min, 4.98P1) fps -63%
Final Fantasy XV Benchmark - 1920x1080 High Quality
MSI Prestige 13 AI Plus Evo A2VMG
Intel Core Ultra 7 258V, Intel Arc Graphics 140V
31.7 fps
Dell XPS 13 9350
Intel Core Ultra 7 256V, Intel Arc Graphics 140V
31.5 fps -1%
Framework Laptop 13.5 Core Ultra 7 155H
Intel Core Ultra 7 155H, Intel Arc 8-Core iGPU
27.2 fps -14%
MSI Prestige 13 AI Evo
Intel Core Ultra 7 155H, Intel Arc 8-Core iGPU
17 fps -46%
HP Dragonfly G4
Intel Core i7-1365U, Intel Iris Xe Graphics G7 96EUs
16.4 fps -48%
Lenovo Yoga Book 9 13IMU9
Intel Core Ultra 7 155U, Intel Graphics 4-Core iGPU (Arc)
16.3 fps -49%
Strange Brigade - 1920x1080 ultra AA:ultra AF:16
Dell XPS 13 9350
Intel Core Ultra 7 256V, Intel Arc Graphics 140V
58 (24.7min, 30.7P1) fps +5%
MSI Prestige 13 AI Plus Evo A2VMG
Intel Core Ultra 7 258V, Intel Arc Graphics 140V
55.4 (21.6min, 28.3P1) fps
Framework Laptop 13.5 Core Ultra 7 155H
Intel Core Ultra 7 155H, Intel Arc 8-Core iGPU
48.5 (12.8min, 21.5P1) fps -12%
MSI Prestige 13 AI Evo
Intel Core Ultra 7 155H, Intel Arc 8-Core iGPU
32 fps -42%
Lenovo Yoga Book 9 13IMU9
Intel Core Ultra 7 155U, Intel Graphics 4-Core iGPU (Arc)
30.3 (7.5min, 11.1P1) fps -45%
HP Dragonfly G4
Intel Core i7-1365U, Intel Iris Xe Graphics G7 96EUs
24.7 (5.3min, 6.86P1) fps -55%
Dota 2 Reborn - 1920x1080 ultra (3/3) best looking
MSI Prestige 13 AI Plus Evo A2VMG
Intel Core Ultra 7 258V, Intel Arc Graphics 140V
83 (51.5min) fps
Dell XPS 13 9350
Intel Core Ultra 7 256V, Intel Arc Graphics 140V
80.7 (52.1min) fps -3%
Framework Laptop 13.5 Core Ultra 7 155H
Intel Core Ultra 7 155H, Intel Arc 8-Core iGPU
62.1 (35.2min) fps -25%
Lenovo Yoga Book 9 13IMU9
Intel Core Ultra 7 155U, Intel Graphics 4-Core iGPU (Arc)
54.2 (41.9min) fps -35%
HP Dragonfly G4
Intel Core i7-1365U, Intel Iris Xe Graphics G7 96EUs
53.3 (44.9min) fps -36%
MSI Prestige 13 AI Evo
Intel Core Ultra 7 155H, Intel Arc 8-Core iGPU
53.3 (34.3min) fps -36%
X-Plane 11.11 - 1920x1080 high (fps_test=3)
MSI Prestige 13 AI Plus Evo A2VMG
Intel Core Ultra 7 258V, Intel Arc Graphics 140V
36.9 fps
Framework Laptop 13.5 Core Ultra 7 155H
Intel Core Ultra 7 155H, Intel Arc 8-Core iGPU
33.7 fps -9%
MSI Prestige 13 AI Evo
Intel Core Ultra 7 155H, Intel Arc 8-Core iGPU
32.1 fps -13%
Dell XPS 13 9350
Intel Core Ultra 7 256V, Intel Arc Graphics 140V
30.1 fps -18%
HP Dragonfly G4
Intel Core i7-1365U, Intel Iris Xe Graphics G7 96EUs
29.1 fps -21%
Lenovo Yoga Book 9 13IMU9
Intel Core Ultra 7 155U, Intel Graphics 4-Core iGPU (Arc)
23.6 fps -36%
Tiny Tina's Wonderlands
1280x720 Lowest Preset (DX12)
MSI Prestige 13 AI Plus Evo A2VMG
Intel Core Ultra 7 258V, Intel Arc Graphics 140V
111.4 fps
Lenovo ThinkPad Z13 Gen 2
AMD Ryzen 7 PRO 7840U, AMD Radeon 780M
108.8 fps -2%
Усредн. модель с Intel Arc Graphics 140V
  (96.9 - 111.4, n=4)
102.5 fps -8%
Dell XPS 13 9350
Intel Core Ultra 7 256V, Intel Arc Graphics 140V
96.9 fps -13%
Framework Laptop 13.5 Core Ultra 7 155H
Intel Core Ultra 7 155H, Intel Arc 8-Core iGPU
77.4 fps -31%
HP Dragonfly G4
Intel Core i7-1365U, Intel Iris Xe Graphics G7 96EUs
53.2 fps -52%
Dell Latitude 13 7350
Intel Core Ultra 5 135U, Intel Graphics 4-Core iGPU (Arc)
51.3 fps -54%
Dell Latitude 7350 Detachable
Intel Core Ultra 7 164U, Intel Graphics 4-Core iGPU (Arc)
50 fps -55%
1920x1080 Low Preset (DX12)
MSI Prestige 13 AI Plus Evo A2VMG
Intel Core Ultra 7 258V, Intel Arc Graphics 140V
72.1 fps
Lenovo ThinkPad Z13 Gen 2
AMD Ryzen 7 PRO 7840U, AMD Radeon 780M
64.7 fps -10%
Усредн. модель с Intel Arc Graphics 140V
  (56.5 - 72.1, n=3)
63.4 fps -12%
Framework Laptop 13.5 Core Ultra 7 155H
Intel Core Ultra 7 155H, Intel Arc 8-Core iGPU
50.8 fps -30%
Dell Latitude 13 7350
Intel Core Ultra 5 135U, Intel Graphics 4-Core iGPU (Arc)
27.6 fps -62%
HP Dragonfly G4
Intel Core i7-1365U, Intel Iris Xe Graphics G7 96EUs
25.9 fps -64%
Dell Latitude 7350 Detachable
Intel Core Ultra 7 164U, Intel Graphics 4-Core iGPU (Arc)
24.1 fps -67%
1920x1080 Medium Preset (DX12)
MSI Prestige 13 AI Plus Evo A2VMG
Intel Core Ultra 7 258V, Intel Arc Graphics 140V
53.3 fps
Усредн. модель с Intel Arc Graphics 140V
  (42.1 - 53.3, n=3)
48.5 fps -9%
Lenovo ThinkPad Z13 Gen 2
AMD Ryzen 7 PRO 7840U, AMD Radeon 780M
47.1 fps -12%
Framework Laptop 13.5 Core Ultra 7 155H
Intel Core Ultra 7 155H, Intel Arc 8-Core iGPU
44.5 fps -17%
Dell Latitude 13 7350
Intel Core Ultra 5 135U, Intel Graphics 4-Core iGPU (Arc)
22.9 fps -57%
HP Dragonfly G4
Intel Core i7-1365U, Intel Iris Xe Graphics G7 96EUs
21.2 fps -60%
1920x1080 High Preset (DX12)
MSI Prestige 13 AI Plus Evo A2VMG
Intel Core Ultra 7 258V, Intel Arc Graphics 140V
36 fps
Усредн. модель с Intel Arc Graphics 140V
  (28.2 - 36, n=3)
32 fps -11%
Lenovo ThinkPad Z13 Gen 2
AMD Ryzen 7 PRO 7840U, AMD Radeon 780M
31.5 fps -12%
Framework Laptop 13.5 Core Ultra 7 155H
Intel Core Ultra 7 155H, Intel Arc 8-Core iGPU
30.7 fps -15%
Dell Latitude 13 7350
Intel Core Ultra 5 135U, Intel Graphics 4-Core iGPU (Arc)
16.8 fps -53%
HP Dragonfly G4
Intel Core i7-1365U, Intel Iris Xe Graphics G7 96EUs
14.1 fps -61%
1920x1080 Badass Preset (DX12)
MSI Prestige 13 AI Plus Evo A2VMG
Intel Core Ultra 7 258V, Intel Arc Graphics 140V
28 fps
Усредн. модель с Intel Arc Graphics 140V
  (23.6 - 28, n=3)
26.1 fps -7%
Lenovo ThinkPad Z13 Gen 2
AMD Ryzen 7 PRO 7840U, AMD Radeon 780M
25.2 fps -10%
Framework Laptop 13.5 Core Ultra 7 155H
Intel Core Ultra 7 155H, Intel Arc 8-Core iGPU
24.2 fps -14%
Dell Latitude 13 7350
Intel Core Ultra 5 135U, Intel Graphics 4-Core iGPU (Arc)
13.6 fps -51%
HP Dragonfly G4
Intel Core i7-1365U, Intel Iris Xe Graphics G7 96EUs
11.1 fps -60%
GTA V
1024x768 Lowest Settings possible
MSI Prestige 13 AI Plus Evo A2VMG
Intel Core Ultra 7 258V, Intel Arc Graphics 140V
161.6 (4.64min, 100P1) fps
Dell XPS 13 9350
Intel Core Ultra 7 256V, Intel Arc Graphics 140V
154.9 (4.26min, 83.3P1) fps -4%
Усредн. модель с Intel Arc Graphics 140V
  (110.5 - 161.6, n=13)
145.2 fps -10%
Framework Laptop 13.5 Core Ultra 7 155H
Intel Core Ultra 7 155H, Intel Arc 8-Core iGPU
144.9 (5.16min, 83.3P1) fps -10%
Lenovo ThinkPad X13 Gen 4 21J3001VGE
AMD Ryzen 7 PRO 7840U, AMD Radeon 780M
138.6 (3.04min, 83.3P1) fps -14%
Lenovo ThinkPad X13 G3 21CM002UGE
AMD Ryzen 5 PRO 6650U, AMD Radeon 660M
118.8 (8.57min, 76.9P1) fps -26%
Dell Latitude 7350 Detachable
Intel Core Ultra 7 164U, Intel Graphics 4-Core iGPU (Arc)
114.3 (16.7min, 71.4P1) fps -29%
HP Dragonfly G4
Intel Core i7-1365U, Intel Iris Xe Graphics G7 96EUs
99.8 (27min, 62.5P1) fps -38%
MSI Prestige 13 AI Evo
Intel Core Ultra 7 155H, Intel Arc 8-Core iGPU
99.1 (6.8min, 27.8P1) fps -39%
Asus ZenBook S13 OLED UX5304
Intel Core i7-1355U, Intel Iris Xe Graphics G7 96EUs
94.8 (19.3min, 55.6P1) fps -41%
Lenovo ThinkPad X13 2-in-1 Gen 5
Intel Core Ultra 7 165U, Intel Graphics 4-Core iGPU (Arc)
94 (9.2min, 55.6P1) fps -42%
HP Elite Dragonfly G3
Intel Core i7-1265U, Intel Iris Xe Graphics G7 96EUs
90.6 (14.9min, 55.6P1) fps -44%
Lenovo Yoga 6 13ALC6
AMD Ryzen 7 5700U, AMD Radeon RX Vega 8 (Ryzen 4000/5000)
88.7 (15.2min, 50P1) fps -45%
1920x1080 Lowest Settings possible
MSI Prestige 13 AI Plus Evo A2VMG
Intel Core Ultra 7 258V, Intel Arc Graphics 140V
158.4 (3.54min, 90.9P1) fps
Dell XPS 13 9350
Intel Core Ultra 7 256V, Intel Arc Graphics 140V
146.7 (4.88min, 90.9P1) fps -7%
Усредн. модель с Intel Arc Graphics 140V
  (135.2 - 158.4, n=6)
143.7 fps -9%
Framework Laptop 13.5 Core Ultra 7 155H
Intel Core Ultra 7 155H, Intel Arc 8-Core iGPU
131.1 (12.4min, 71.4P1) fps -17%
Lenovo ThinkPad X13 Gen 4 21J3001VGE
AMD Ryzen 7 PRO 7840U, AMD Radeon 780M
109.4 (12.3min, 76.9P1) fps -31%
Lenovo ThinkPad X13 G3 21CM002UGE
AMD Ryzen 5 PRO 6650U, AMD Radeon 660M
87.4 (7.49min, 58.8P1) fps -45%
HP Dragonfly G4
Intel Core i7-1365U, Intel Iris Xe Graphics G7 96EUs
78.8 (12.6min, 52.6P1) fps -50%
Lenovo ThinkPad X13 2-in-1 Gen 5
Intel Core Ultra 7 165U, Intel Graphics 4-Core iGPU (Arc)
77.3 (25.2min, 45.5P1) fps -51%
Dell Latitude 7350 Detachable
Intel Core Ultra 7 164U, Intel Graphics 4-Core iGPU (Arc)
76.5 (18.7min, 50P1) fps -52%
HP Elite Dragonfly G3
Intel Core i7-1265U, Intel Iris Xe Graphics G7 96EUs
74.9 (13.6min, 52.6P1) fps -53%
Lenovo Yoga 6 13ALC6
AMD Ryzen 7 5700U, AMD Radeon RX Vega 8 (Ryzen 4000/5000)
56 (7.44min, 40P1) fps -65%
1366x768 Normal/Off AF:4x
Asus ProArt PX13 HN7306
AMD Ryzen AI 9 HX 370, NVIDIA GeForce RTX 4070 Laptop GPU
174.2 (3.45min, 111.1P1) fps +12%
MSI Prestige 13 AI Plus Evo A2VMG
Intel Core Ultra 7 258V, Intel Arc Graphics 140V
155.6 (4.3min, 90.9P1) fps
Dell XPS 13 9350
Intel Core Ultra 7 256V, Intel Arc Graphics 140V
149.4 (4.38min, 90.9P1) fps -4%
Framework Laptop 13.5 Core Ultra 7 155H
Intel Core Ultra 7 155H, Intel Arc 8-Core iGPU
140.1 (8min, 66.7P1) fps -10%
Усредн. модель с Intel Arc Graphics 140V
  (91.1 - 155.6, n=12)
133.6 fps -14%
Lenovo ThinkPad X13 Gen 4 21J3001VGE
AMD Ryzen 7 PRO 7840U, AMD Radeon 780M
124.9 (11.1min, 76.9P1) fps -20%
Lenovo ThinkPad X13 2-in-1 Gen 5
Intel Core Ultra 7 165U, Intel Graphics 4-Core iGPU (Arc)
109.3 (8.4min, 50P1) fps -30%
Lenovo ThinkPad X13 G3 21CM002UGE
AMD Ryzen 5 PRO 6650U, AMD Radeon 660M
103.2 (7.87min, 62.5P1) fps -34%
Dell Latitude 7350 Detachable
Intel Core Ultra 7 164U, Intel Graphics 4-Core iGPU (Arc)
95.7 (8.89min, 58.8P1) fps -38%
MSI Prestige 13 AI Evo
Intel Core Ultra 7 155H, Intel Arc 8-Core iGPU
93.8 (12.8min, 41.7P1) fps -40%
Dell XPS 13 Plus 9320 i5-1240p
Intel Core i5-1240P, Intel Iris Xe Graphics G7 80EUs
91 fps -42%
HP Dragonfly G4
Intel Core i7-1365U, Intel Iris Xe Graphics G7 96EUs
84.1 (9min, 47.6P1) fps -46%
Asus ZenBook S13 OLED UX5304
Intel Core i7-1355U, Intel Iris Xe Graphics G7 96EUs
81 (16.8min, 45.5P1) fps -48%
HP Elite Dragonfly G3
Intel Core i7-1265U, Intel Iris Xe Graphics G7 96EUs
79.2 (14.8min, 50P1) fps -49%
1920x1080 Normal/Off AF:4x
MSI Prestige 13 AI Plus Evo A2VMG
Intel Core Ultra 7 258V, Intel Arc Graphics 140V
152 (4.18min, 83.3P1) fps
Усредн. модель с Intel Arc Graphics 140V
  (120.6 - 152, n=6)
134.7 fps -11%
Dell XPS 13 9350
Intel Core Ultra 7 256V, Intel Arc Graphics 140V
134.2 (5.63min, 83.3P1) fps -12%
Framework Laptop 13.5 Core Ultra 7 155H
Intel Core Ultra 7 155H, Intel Arc 8-Core iGPU
119.9 (6.03min, 62.5P1) fps -21%
Lenovo ThinkPad X13 Gen 4 21J3001VGE
AMD Ryzen 7 PRO 7840U, AMD Radeon 780M
104.4 (13.1min, 71.4P1) fps -31%
Lenovo ThinkPad X13 G3 21CM002UGE
AMD Ryzen 5 PRO 6650U, AMD Radeon 660M
83.9 (6.08min, 52.6P1) fps -45%
HP Dragonfly G4
Intel Core i7-1365U, Intel Iris Xe Graphics G7 96EUs
70.6 (16.1min, 43.5P1) fps -54%
Lenovo ThinkPad X13 2-in-1 Gen 5
Intel Core Ultra 7 165U, Intel Graphics 4-Core iGPU (Arc)
70.1 (16.5min, 40P1) fps -54%
HP Elite Dragonfly G3
Intel Core i7-1265U, Intel Iris Xe Graphics G7 96EUs
66.4 (14min, 40P1) fps -56%
Dell Latitude 7350 Detachable
Intel Core Ultra 7 164U, Intel Graphics 4-Core iGPU (Arc)
65.6 (22.6min, 43.5P1) fps -57%
Lenovo Yoga 6 13ALC6
AMD Ryzen 7 5700U, AMD Radeon RX Vega 8 (Ryzen 4000/5000)
57.4 (7.36min, 38.5P1) fps -62%
1920x1080 High/On (Advanced Graphics Off) AA:2xMSAA + FX AF:8x
Asus ProArt PX13 HN7306
AMD Ryzen AI 9 HX 370, NVIDIA GeForce RTX 4070 Laptop GPU
167.1 (4.37min, 100P1) fps +148%
MSI Prestige 13 AI Plus Evo A2VMG
Intel Core Ultra 7 258V, Intel Arc Graphics 140V
67.4 (4.31min, 50P1) fps
Dell XPS 13 9350
Intel Core Ultra 7 256V, Intel Arc Graphics 140V
60.8 (2.26min, 43.5P1) fps -10%
Усредн. модель с Intel Arc Graphics 140V
  (32 - 67.4, n=12)
58.8 fps -13%
Lenovo ThinkPad X13 Gen 4 21J3001VGE
AMD Ryzen 7 PRO 7840U, AMD Radeon 780M
54.4 (2.2min, 34.5P1) fps -19%
Framework Laptop 13.5 Core Ultra 7 155H
Intel Core Ultra 7 155H, Intel Arc 8-Core iGPU
43.5 (2.85min, 21.7P1) fps -35%
Lenovo ThinkPad X13 G3 21CM002UGE
AMD Ryzen 5 PRO 6650U, AMD Radeon 660M
36.4 (2.98min, 25P1) fps -46%
Dell XPS 13 Plus 9320 i5-1240p
Intel Core i5-1240P, Intel Iris Xe Graphics G7 80EUs
32 fps -53%
MSI Prestige 13 AI Evo
Intel Core Ultra 7 155H, Intel Arc 8-Core iGPU
26.2 (5.31min, 15.6P1) fps -61%
Lenovo Yoga 6 13ALC6
AMD Ryzen 7 5700U, AMD Radeon RX Vega 8 (Ryzen 4000/5000)
24.5 (3.65min, 17.5P1) fps -64%
Lenovo ThinkPad X13 2-in-1 Gen 5
Intel Core Ultra 7 165U, Intel Graphics 4-Core iGPU (Arc)
24.2 (2.14min, 13.5P1) fps -64%
HP Dragonfly G4
Intel Core i7-1365U, Intel Iris Xe Graphics G7 96EUs
23.4 (10.4min, 16.1P1) fps -65%
HP Elite Dragonfly G3
Intel Core i7-1265U, Intel Iris Xe Graphics G7 96EUs
23.3 (7.35min, 16.7P1) fps -65%
Asus ZenBook S13 OLED UX5304
Intel Core i7-1355U, Intel Iris Xe Graphics G7 96EUs
22.5 (6.83min, 13.9P1) fps -67%
Dell Latitude 7350 Detachable
Intel Core Ultra 7 164U, Intel Graphics 4-Core iGPU (Arc)
17.6 (2.25min, 12.5P1) fps -74%
1920x1080 Highest Settings possible AA:4xMSAA + FX AF:16x
Asus ProArt PX13 HN7306
AMD Ryzen AI 9 HX 370, NVIDIA GeForce RTX 4070 Laptop GPU
104.5 (9.04min, 66.7P1) fps +291%
MSI Prestige 13 AI Plus Evo A2VMG
Intel Core Ultra 7 258V, Intel Arc Graphics 140V
26.7 (3.24min, 21.3P1) fps
Dell XPS 13 9350
Intel Core Ultra 7 256V, Intel Arc Graphics 140V
25.6 (2.46min, 19.6P1) fps -4%
Усредн. модель с Intel Arc Graphics 140V
  (15.4 - 28.4, n=12)
25 fps -6%
Lenovo ThinkPad X13 Gen 4 21J3001VGE
AMD Ryzen 7 PRO 7840U, AMD Radeon 780M
23.7 (3.18min, 16.1P1) fps -11%
Framework Laptop 13.5 Core Ultra 7 155H
Intel Core Ultra 7 155H, Intel Arc 8-Core iGPU
17.5 (2.07min, 12P1) fps -34%
Lenovo ThinkPad X13 G3 21CM002UGE
AMD Ryzen 5 PRO 6650U, AMD Radeon 660M
14.2 (4.52min, 9.71P1) fps -47%
HP Elite Dragonfly G3
Intel Core i7-1265U, Intel Iris Xe Graphics G7 96EUs
10.2 (3.63min, 6.9P1) fps -62%
HP Dragonfly G4
Intel Core i7-1365U, Intel Iris Xe Graphics G7 96EUs
10.1 (4.85min, 6.29P1) fps -62%
MSI Prestige 13 AI Evo
Intel Core Ultra 7 155H, Intel Arc 8-Core iGPU
9.97 (1.989min, 4.98P1) fps -63%
Lenovo Yoga 6 13ALC6
AMD Ryzen 7 5700U, AMD Radeon RX Vega 8 (Ryzen 4000/5000)
9.82 (2.64min, 6.8P1) fps -63%
Lenovo ThinkPad X13 2-in-1 Gen 5
Intel Core Ultra 7 165U, Intel Graphics 4-Core iGPU (Arc)
9.45 (1.644min, 7.41P1) fps -65%
Asus ZenBook S13 OLED UX5304
Intel Core i7-1355U, Intel Iris Xe Graphics G7 96EUs
9.42 (3.26min, 5.92P1) fps -65%
Dell Latitude 7350 Detachable
Intel Core Ultra 7 164U, Intel Graphics 4-Core iGPU (Arc)
7.55 (1.677min, 4.78P1) fps -72%
Dota 2 Reborn
1280x720 min (0/3) fastest
Asus ProArt PX13 HN7306
AMD Ryzen AI 9 HX 370, NVIDIA GeForce RTX 4070 Laptop GPU
157.1 (134.3min) fps +62%
Dell XPS 13 Plus 9320 i5-1240p
Intel Core i5-1240P, Intel Iris Xe Graphics G7 80EUs
134.4 (81.4min) fps +38%
Lenovo ThinkPad X13 Gen 4 21J3001VGE
AMD Ryzen 7 PRO 7840U, AMD Radeon 780M
118.5 (103min) fps +22%
Lenovo ThinkPad Z13 Gen 2
AMD Ryzen 7 PRO 7840U, AMD Radeon 780M
113.7 (99.8min) fps +17%
Framework Laptop 13.5 Core Ultra 7 155H
Intel Core Ultra 7 155H, Intel Arc 8-Core iGPU
102.7 (56.4min) fps +6%
HP Dragonfly G4
Intel Core i7-1365U, Intel Iris Xe Graphics G7 96EUs
101.4 (80.9min) fps +4%
Усредн. модель с Intel Arc Graphics 140V
  (89.8 - 116.9, n=12)
100.1 fps +3%
HP Elite Dragonfly G3
Intel Core i7-1265U, Intel Iris Xe Graphics G7 96EUs
97.4 (77.3min) fps 0%
MSI Prestige 13 AI Plus Evo A2VMG
Intel Core Ultra 7 258V, Intel Arc Graphics 140V
97.2 (60.5min) fps
Dell XPS 13 9350
Intel Core Ultra 7 256V, Intel Arc Graphics 140V
95.8 (61.3min) fps -1%
Lenovo Yoga 6 13ALC6
AMD Ryzen 7 5700U, AMD Radeon RX Vega 8 (Ryzen 4000/5000)
93.7 (82min) fps -4%
Lenovo ThinkPad X13 G3 21CM002UGE
AMD Ryzen 5 PRO 6650U, AMD Radeon 660M
93.7 (80.5min) fps -4%
Dell Latitude 13 7350
Intel Core Ultra 5 135U, Intel Graphics 4-Core iGPU (Arc)
92.9 (38.4min) fps -4%
MSI Prestige 13 AI Evo
Intel Core Ultra 7 155H, Intel Arc 8-Core iGPU
89.9 (53min) fps -8%
Dell Latitude 7350 Detachable
Intel Core Ultra 7 164U, Intel Graphics 4-Core iGPU (Arc)
85 (58.2min) fps -13%
Asus ZenBook S13 OLED UX5304
Intel Core i7-1355U, Intel Iris Xe Graphics G7 96EUs
84.8 (65.2min) fps -13%
Lenovo ThinkPad X13 2-in-1 Gen 5
Intel Core Ultra 7 165U, Intel Graphics 4-Core iGPU (Arc)
75.2 (32min) fps -23%
Lenovo ThinkPad X13 2-in-1 Gen 5
Intel Core Ultra 7 165U, Intel Graphics 4-Core iGPU (Arc)
66.1 (23.3min) fps -32%
1366x768 med (1/3)
Asus ProArt PX13 HN7306
AMD Ryzen AI 9 HX 370, NVIDIA GeForce RTX 4070 Laptop GPU
146.7 (123.4min) fps +67%
Dell XPS 13 Plus 9320 i5-1240p
Intel Core i5-1240P, Intel Iris Xe Graphics G7 80EUs
119.5 (103.4min) fps +36%
Lenovo ThinkPad Z13 Gen 2
AMD Ryzen 7 PRO 7840U, AMD Radeon 780M
96.7 (83.5min) fps +10%
Lenovo ThinkPad X13 Gen 4 21J3001VGE
AMD Ryzen 7 PRO 7840U, AMD Radeon 780M
89.5 (74.3min) fps +2%
MSI Prestige 13 AI Plus Evo A2VMG
Intel Core Ultra 7 258V, Intel Arc Graphics 140V
87.8 (54.2min) fps
Dell XPS 13 9350
Intel Core Ultra 7 256V, Intel Arc Graphics 140V
87 (55.1min) fps -1%
Усредн. модель с Intel Arc Graphics 140V
  (58 - 99.9, n=12)
84.3 fps -4%
Framework Laptop 13.5 Core Ultra 7 155H
Intel Core Ultra 7 155H, Intel Arc 8-Core iGPU
76.9 (31.4min) fps -12%
HP Dragonfly G4
Intel Core i7-1365U, Intel Iris Xe Graphics G7 96EUs
76.3 (60.7min) fps -13%
MSI Prestige 13 AI Evo
Intel Core Ultra 7 155H, Intel Arc 8-Core iGPU
75.9 (14.5min) fps -14%
Lenovo Yoga 6 13ALC6
AMD Ryzen 7 5700U, AMD Radeon RX Vega 8 (Ryzen 4000/5000)
73.7 (59.2min) fps -16%
Lenovo ThinkPad X13 G3 21CM002UGE
AMD Ryzen 5 PRO 6650U, AMD Radeon 660M
72.2 (58.5min) fps -18%
HP Elite Dragonfly G3
Intel Core i7-1265U, Intel Iris Xe Graphics G7 96EUs
71.1 (54.1min) fps -19%
Asus ZenBook S13 OLED UX5304
Intel Core i7-1355U, Intel Iris Xe Graphics G7 96EUs
66.7 (50.3min) fps -24%
Dell Latitude 7350 Detachable
Intel Core Ultra 7 164U, Intel Graphics 4-Core iGPU (Arc)
57.7 (43.4min) fps -34%
Dell Latitude 13 7350
Intel Core Ultra 5 135U, Intel Graphics 4-Core iGPU (Arc)
54.3 (31.3min) fps -38%
Lenovo ThinkPad X13 2-in-1 Gen 5
Intel Core Ultra 7 165U, Intel Graphics 4-Core iGPU (Arc)
48.6 (29.8min) fps -45%
Lenovo ThinkPad X13 2-in-1 Gen 5
Intel Core Ultra 7 165U, Intel Graphics 4-Core iGPU (Arc)
38.2 (24.6min) fps -56%
1920x1080 high (2/3)
Asus ProArt PX13 HN7306
AMD Ryzen AI 9 HX 370, NVIDIA GeForce RTX 4070 Laptop GPU
131.9 (111.6min) fps +83%
Lenovo ThinkPad Z13 Gen 2
AMD Ryzen 7 PRO 7840U, AMD Radeon 780M
83.1 (71.9min) fps +15%
Dell XPS 13 9350
Intel Core Ultra 7 256V, Intel Arc Graphics 140V
83 (35.8min) fps +15%
Усредн. модель с Intel Arc Graphics 140V
  (48.4 - 88.2, n=12)
77.4 fps +7%
MSI Prestige 13 AI Plus Evo A2VMG
Intel Core Ultra 7 258V, Intel Arc Graphics 140V
72.1 (37.8min) fps
Dell XPS 13 Plus 9320 i5-1240p
Intel Core i5-1240P, Intel Iris Xe Graphics G7 80EUs
70.9 (59.6min) fps -2%
Framework Laptop 13.5 Core Ultra 7 155H
Intel Core Ultra 7 155H, Intel Arc 8-Core iGPU
67.2 (36.9min) fps -7%
Dell Latitude 13 7350
Intel Core Ultra 5 135U, Intel Graphics 4-Core iGPU (Arc)
61.6 (37.1min) fps -15%
HP Dragonfly G4
Intel Core i7-1365U, Intel Iris Xe Graphics G7 96EUs
60.2 (49.5min) fps -17%
Lenovo ThinkPad X13 Gen 4 21J3001VGE
AMD Ryzen 7 PRO 7840U, AMD Radeon 780M
57.9 (49.3min) fps -20%
MSI Prestige 13 AI Evo
Intel Core Ultra 7 155H, Intel Arc 8-Core iGPU
57.7 (35.7min) fps -20%
HP Elite Dragonfly G3
Intel Core i7-1265U, Intel Iris Xe Graphics G7 96EUs
57 (47.8min) fps -21%
Asus ZenBook S13 OLED UX5304
Intel Core i7-1355U, Intel Iris Xe Graphics G7 96EUs
54.9 (44.7min) fps -24%
Dell Latitude 7350 Detachable
Intel Core Ultra 7 164U, Intel Graphics 4-Core iGPU (Arc)
50.7 (39.2min) fps -30%
Lenovo ThinkPad X13 2-in-1 Gen 5
Intel Core Ultra 7 165U, Intel Graphics 4-Core iGPU (Arc)
49.7 (31.4min) fps -31%
Lenovo ThinkPad X13 2-in-1 Gen 5
Intel Core Ultra 7 165U, Intel Graphics 4-Core iGPU (Arc)
44.4 (28.2min) fps -38%
Lenovo Yoga 6 13ALC6
AMD Ryzen 7 5700U, AMD Radeon RX Vega 8 (Ryzen 4000/5000)
45.7 (40.4min) fps -37%
Lenovo ThinkPad X13 G3 21CM002UGE
AMD Ryzen 5 PRO 6650U, AMD Radeon 660M
37.4 (33.6min) fps -48%
1920x1080 ultra (3/3) best looking
Asus ProArt PX13 HN7306
AMD Ryzen AI 9 HX 370, NVIDIA GeForce RTX 4070 Laptop GPU
122.8 (106.2min) fps +48%
MSI Prestige 13 AI Plus Evo A2VMG
Intel Core Ultra 7 258V, Intel Arc Graphics 140V
83 (51.5min) fps
Dell XPS 13 9350
Intel Core Ultra 7 256V, Intel Arc Graphics 140V
80.7 (52.1min) fps -3%
Усредн. модель с Intel Arc Graphics 140V
  (54.8 - 83, n=12)
75.4 fps -9%
Lenovo ThinkPad Z13 Gen 2
AMD Ryzen 7 PRO 7840U, AMD Radeon 780M
72.2 (60.1min) fps -13%
Dell XPS 13 Plus 9320 i5-1240p
Intel Core i5-1240P, Intel Iris Xe Graphics G7 80EUs
66.1 (49.7min) fps -20%
Framework Laptop 13.5 Core Ultra 7 155H
Intel Core Ultra 7 155H, Intel Arc 8-Core iGPU
62.1 (35.2min) fps -25%
Dell Latitude 13 7350
Intel Core Ultra 5 135U, Intel Graphics 4-Core iGPU (Arc)
54 (32.2min) fps -35%
HP Dragonfly G4
Intel Core i7-1365U, Intel Iris Xe Graphics G7 96EUs
53.3 (44.9min) fps -36%
MSI Prestige 13 AI Evo
Intel Core Ultra 7 155H, Intel Arc 8-Core iGPU
53.3 (34.3min) fps -36%
Lenovo ThinkPad X13 Gen 4 21J3001VGE
AMD Ryzen 7 PRO 7840U, AMD Radeon 780M
53.1 (46.2min) fps -36%
Asus ZenBook S13 OLED UX5304
Intel Core i7-1355U, Intel Iris Xe Graphics G7 96EUs
51.1 (42.7min) fps -38%
HP Elite Dragonfly G3
Intel Core i7-1265U, Intel Iris Xe Graphics G7 96EUs
50.9 (42.5min) fps -39%
Dell Latitude 7350 Detachable
Intel Core Ultra 7 164U, Intel Graphics 4-Core iGPU (Arc)
48 (38.5min) fps -42%
Lenovo ThinkPad X13 2-in-1 Gen 5
Intel Core Ultra 7 165U, Intel Graphics 4-Core iGPU (Arc)
47.9 (31.4min) fps -42%
Lenovo ThinkPad X13 2-in-1 Gen 5
Intel Core Ultra 7 165U, Intel Graphics 4-Core iGPU (Arc)
39.9 (25min) fps -52%
Lenovo Yoga 6 13ALC6
AMD Ryzen 7 5700U, AMD Radeon RX Vega 8 (Ryzen 4000/5000)
43.4 (38.6min) fps -48%
Lenovo ThinkPad X13 G3 21CM002UGE
AMD Ryzen 5 PRO 6650U, AMD Radeon 660M
32.8 (29.4min) fps -60%
Final Fantasy XV Benchmark
1280x720 Lite Quality
Asus ProArt PX13 HN7306
AMD Ryzen AI 9 HX 370, NVIDIA GeForce RTX 4070 Laptop GPU
173.8 fps +107%
MSI Prestige 13 AI Plus Evo A2VMG
Intel Core Ultra 7 258V, Intel Arc Graphics 140V
84 fps
Усредн. модель с Intel Arc Graphics 140V
  (54.1 - 91, n=12)
80.1 fps -5%
Dell XPS 13 9350
Intel Core Ultra 7 256V, Intel Arc Graphics 140V
79.4 fps -5%
Framework Laptop 13.5 Core Ultra 7 155H
Intel Core Ultra 7 155H, Intel Arc 8-Core iGPU
70 fps -17%
Lenovo ThinkPad Z13 Gen 2
AMD Ryzen 7 PRO 7840U, AMD Radeon 780M
69.8 fps -17%
Lenovo ThinkPad X13 Gen 4 21J3001VGE
AMD Ryzen 7 PRO 7840U, AMD Radeon 780M
69.2 fps -18%
Lenovo ThinkPad X13 G3 21CM002UGE
AMD Ryzen 5 PRO 6650U, AMD Radeon 660M
45.5 fps -46%
MSI Prestige 13 AI Evo
Intel Core Ultra 7 155H, Intel Arc 8-Core iGPU
43.8 fps -48%
Dell Latitude 13 7350
Intel Core Ultra 5 135U, Intel Graphics 4-Core iGPU (Arc)
42.7 fps -49%
HP Dragonfly G4
Intel Core i7-1365U, Intel Iris Xe Graphics G7 96EUs
40.9 fps -51%
HP Elite Dragonfly G3
Intel Core i7-1265U, Intel Iris Xe Graphics G7 96EUs
39.7 fps -53%
Asus ZenBook S13 OLED UX5304
Intel Core i7-1355U, Intel Iris Xe Graphics G7 96EUs
37.4 fps -55%
Dell Latitude 7350 Detachable
Intel Core Ultra 7 164U, Intel Graphics 4-Core iGPU (Arc)
36.9 fps -56%
Dell XPS 13 Plus 9320 i5-1240p
Intel Core i5-1240P, Intel Iris Xe Graphics G7 80EUs
36.3 fps -57%
Lenovo ThinkPad X13 2-in-1 Gen 5
Intel Core Ultra 7 165U, Intel Graphics 4-Core iGPU (Arc)
33.7 fps -60%
Lenovo Yoga 6 13ALC6
AMD Ryzen 7 5700U, AMD Radeon RX Vega 8 (Ryzen 4000/5000)
31.7 fps -62%
1920x1080 Standard Quality
Asus ProArt PX13 HN7306
AMD Ryzen AI 9 HX 370, NVIDIA GeForce RTX 4070 Laptop GPU
140.5 fps +204%
MSI Prestige 13 AI Plus Evo A2VMG
Intel Core Ultra 7 258V, Intel Arc Graphics 140V
46.2 fps
Dell XPS 13 9350
Intel Core Ultra 7 256V, Intel Arc Graphics 140V
46.1 fps 0%
Усредн. модель с Intel Arc Graphics 140V
  (31.6 - 49.3, n=13)
44.3 fps -4%
Framework Laptop 13.5 Core Ultra 7 155H
Intel Core Ultra 7 155H, Intel Arc 8-Core iGPU
38 fps -18%
Lenovo ThinkPad Z13 Gen 2
AMD Ryzen 7 PRO 7840U, AMD Radeon 780M
35.3 fps -24%
Lenovo ThinkPad X13 Gen 4 21J3001VGE
AMD Ryzen 7 PRO 7840U, AMD Radeon 780M
34 fps -26%
MSI Prestige 13 AI Evo
Intel Core Ultra 7 155H, Intel Arc 8-Core iGPU
28 fps -39%
Dell Latitude 13 7350
Intel Core Ultra 5 135U, Intel Graphics 4-Core iGPU (Arc)
23.6 fps -49%
HP Dragonfly G4
Intel Core i7-1365U, Intel Iris Xe Graphics G7 96EUs
23.2 fps -50%
HP Elite Dragonfly G3
Intel Core i7-1265U, Intel Iris Xe Graphics G7 96EUs
22.7 fps -51%
Lenovo ThinkPad X13 G3 21CM002UGE
AMD Ryzen 5 PRO 6650U, AMD Radeon 660M
21.9 fps -53%
Dell Latitude 7350 Detachable
Intel Core Ultra 7 164U, Intel Graphics 4-Core iGPU (Arc)
20.8 fps -55%
Asus ZenBook S13 OLED UX5304
Intel Core i7-1355U, Intel Iris Xe Graphics G7 96EUs
20.5 fps -56%
Dell XPS 13 Plus 9320 i5-1240p
Intel Core i5-1240P, Intel Iris Xe Graphics G7 80EUs
19.7 fps -57%
Lenovo ThinkPad X13 2-in-1 Gen 5
Intel Core Ultra 7 165U, Intel Graphics 4-Core iGPU (Arc)
17.1 fps -63%
Lenovo Yoga 6 13ALC6
AMD Ryzen 7 5700U, AMD Radeon RX Vega 8 (Ryzen 4000/5000)
16.6 fps -64%
1920x1080 High Quality
Asus ProArt PX13 HN7306
AMD Ryzen AI 9 HX 370, NVIDIA GeForce RTX 4070 Laptop GPU
104 fps +228%
MSI Prestige 13 AI Plus Evo A2VMG
Intel Core Ultra 7 258V, Intel Arc Graphics 140V
31.7 fps
Dell XPS 13 9350
Intel Core Ultra 7 256V, Intel Arc Graphics 140V
31.5 fps -1%
Усредн. модель с Intel Arc Graphics 140V
  (23 - 34.2, n=12)
31.3 fps -1%
Framework Laptop 13.5 Core Ultra 7 155H
Intel Core Ultra 7 155H, Intel Arc 8-Core iGPU
27.2 fps -14%
Lenovo ThinkPad Z13 Gen 2
AMD Ryzen 7 PRO 7840U, AMD Radeon 780M
26.5 fps -16%
Lenovo ThinkPad X13 Gen 4 21J3001VGE
AMD Ryzen 7 PRO 7840U, AMD Radeon 780M
25.6 fps -19%
Dell Latitude 13 7350
Intel Core Ultra 5 135U, Intel Graphics 4-Core iGPU (Arc)
17.5 fps -45%
MSI Prestige 13 AI Evo
Intel Core Ultra 7 155H, Intel Arc 8-Core iGPU
17 fps -46%
HP Dragonfly G4
Intel Core i7-1365U, Intel Iris Xe Graphics G7 96EUs
16.4 fps -48%
Lenovo ThinkPad X13 G3 21CM002UGE
AMD Ryzen 5 PRO 6650U, AMD Radeon 660M
16 fps -50%
HP Elite Dragonfly G3
Intel Core i7-1265U, Intel Iris Xe Graphics G7 96EUs
15.8 fps -50%
Asus ZenBook S13 OLED UX5304
Intel Core i7-1355U, Intel Iris Xe Graphics G7 96EUs
14.9 fps -53%
Dell Latitude 7350 Detachable
Intel Core Ultra 7 164U, Intel Graphics 4-Core iGPU (Arc)
14.7 fps -54%
Lenovo ThinkPad X13 2-in-1 Gen 5
Intel Core Ultra 7 165U, Intel Graphics 4-Core iGPU (Arc)
12.2 fps -62%
Dell XPS 13 Plus 9320 i5-1240p
Intel Core i5-1240P, Intel Iris Xe Graphics G7 80EUs
11.7 fps -63%
Lenovo Yoga 6 13ALC6
AMD Ryzen 7 5700U, AMD Radeon RX Vega 8 (Ryzen 4000/5000)
11.2 fps -65%
X-Plane 11.11
1280x720 low (fps_test=1)
Asus ProArt PX13 HN7306
AMD Ryzen AI 9 HX 370, NVIDIA GeForce RTX 4070 Laptop GPU
96.5 fps +70%
MSI Prestige 13 AI Plus Evo A2VMG
Intel Core Ultra 7 258V, Intel Arc Graphics 140V
56.6 fps
Framework Laptop 13.5 Core Ultra 7 155H
Intel Core Ultra 7 155H, Intel Arc 8-Core iGPU
56 fps -1%
Усредн. модель с Intel Arc Graphics 140V
  (38.9 - 57, n=12)
49.3 fps -13%
MSI Prestige 13 AI Evo
Intel Core Ultra 7 155H, Intel Arc 8-Core iGPU
47.4 fps -16%
Dell XPS 13 9350
Intel Core Ultra 7 256V, Intel Arc Graphics 140V
47.1 fps -17%
Lenovo ThinkPad X13 Gen 4 21J3001VGE
AMD Ryzen 7 PRO 7840U, AMD Radeon 780M
46.2 fps -18%
Lenovo ThinkPad Z13 Gen 2
AMD Ryzen 7 PRO 7840U, AMD Radeon 780M
43.1 fps -24%
Lenovo Yoga 6 13ALC6
AMD Ryzen 7 5700U, AMD Radeon RX Vega 8 (Ryzen 4000/5000)
38.2 fps -33%
HP Dragonfly G4
Intel Core i7-1365U, Intel Iris Xe Graphics G7 96EUs
37.6 fps -34%
HP Elite Dragonfly G3
Intel Core i7-1265U, Intel Iris Xe Graphics G7 96EUs
37.3 fps -34%
Dell Latitude 13 7350
Intel Core Ultra 5 135U, Intel Graphics 4-Core iGPU (Arc)
36.2 fps -36%
Lenovo ThinkPad X13 G3 21CM002UGE
AMD Ryzen 5 PRO 6650U, AMD Radeon 660M
36 fps -36%
Asus ZenBook S13 OLED UX5304
Intel Core i7-1355U, Intel Iris Xe Graphics G7 96EUs
34.6 fps -39%
Dell Latitude 7350 Detachable
Intel Core Ultra 7 164U, Intel Graphics 4-Core iGPU (Arc)
33.8 fps -40%
Lenovo ThinkPad X13 2-in-1 Gen 5
Intel Core Ultra 7 165U, Intel Graphics 4-Core iGPU (Arc)
31.2 fps -45%
Lenovo ThinkPad X13 2-in-1 Gen 5
Intel Core Ultra 7 165U, Intel Graphics 4-Core iGPU (Arc)
28.7 fps -49%
Dell XPS 13 Plus 9320 i5-1240p
Intel Core i5-1240P, Intel Iris Xe Graphics G7 80EUs
28.5 fps -50%
1920x1080 med (fps_test=2)
Asus ProArt PX13 HN7306
AMD Ryzen AI 9 HX 370, NVIDIA GeForce RTX 4070 Laptop GPU
90.7 fps +113%
MSI Prestige 13 AI Plus Evo A2VMG
Intel Core Ultra 7 258V, Intel Arc Graphics 140V
42.6 fps
Framework Laptop 13.5 Core Ultra 7 155H
Intel Core Ultra 7 155H, Intel Arc 8-Core iGPU
41.6 fps -2%
Усредн. модель с Intel Arc Graphics 140V
  (34.4 - 43.8, n=12)
39.5 fps -7%
MSI Prestige 13 AI Evo
Intel Core Ultra 7 155H, Intel Arc 8-Core iGPU
37.7 fps -12%
Dell XPS 13 9350
Intel Core Ultra 7 256V, Intel Arc Graphics 140V
36.1 fps -15%
HP Elite Dragonfly G3
Intel Core i7-1265U, Intel Iris Xe Graphics G7 96EUs
34.7 fps -19%
Lenovo ThinkPad X13 Gen 4 21J3001VGE
AMD Ryzen 7 PRO 7840U, AMD Radeon 780M
33.5 fps -21%
Lenovo ThinkPad Z13 Gen 2
AMD Ryzen 7 PRO 7840U, AMD Radeon 780M
33 fps -23%
Asus ZenBook S13 OLED UX5304
Intel Core i7-1355U, Intel Iris Xe Graphics G7 96EUs
32.1 fps -25%
HP Dragonfly G4
Intel Core i7-1365U, Intel Iris Xe Graphics G7 96EUs
31.8 fps -25%
Lenovo Yoga 6 13ALC6
AMD Ryzen 7 5700U, AMD Radeon RX Vega 8 (Ryzen 4000/5000)
30.8 fps -28%
Dell Latitude 13 7350
Intel Core Ultra 5 135U, Intel Graphics 4-Core iGPU (Arc)
28.2 fps -34%
Dell Latitude 7350 Detachable
Intel Core Ultra 7 164U, Intel Graphics 4-Core iGPU (Arc)
25.9 fps -39%
Lenovo ThinkPad X13 2-in-1 Gen 5
Intel Core Ultra 7 165U, Intel Graphics 4-Core iGPU (Arc)
25.2 fps -41%
Lenovo ThinkPad X13 2-in-1 Gen 5
Intel Core Ultra 7 165U, Intel Graphics 4-Core iGPU (Arc)
21.6 fps -49%
Lenovo ThinkPad X13 G3 21CM002UGE
AMD Ryzen 5 PRO 6650U, AMD Radeon 660M
24.2 fps -43%
Dell XPS 13 Plus 9320 i5-1240p
Intel Core i5-1240P, Intel Iris Xe Graphics G7 80EUs
23.7 fps -44%
1920x1080 high (fps_test=3)
Asus ProArt PX13 HN7306
AMD Ryzen AI 9 HX 370, NVIDIA GeForce RTX 4070 Laptop GPU
74.1 fps +101%
MSI Prestige 13 AI Plus Evo A2VMG
Intel Core Ultra 7 258V, Intel Arc Graphics 140V
36.9 fps
Усредн. модель с Intel Arc Graphics 140V
  (28.5 - 37.7, n=12)
34 fps -8%
Framework Laptop 13.5 Core Ultra 7 155H
Intel Core Ultra 7 155H, Intel Arc 8-Core iGPU
33.7 fps -9%
MSI Prestige 13 AI Evo
Intel Core Ultra 7 155H, Intel Arc 8-Core iGPU
32.1 fps -13%
HP Elite Dragonfly G3
Intel Core i7-1265U, Intel Iris Xe Graphics G7 96EUs
31.2 fps -15%
Dell XPS 13 9350
Intel Core Ultra 7 256V, Intel Arc Graphics 140V
30.1 fps -18%
HP Dragonfly G4
Intel Core i7-1365U, Intel Iris Xe Graphics G7 96EUs
29.1 fps -21%
Dell XPS 13 Plus 9320 i5-1240p
Intel Core i5-1240P, Intel Iris Xe Graphics G7 80EUs
28.8 fps -22%
Lenovo ThinkPad X13 Gen 4 21J3001VGE
AMD Ryzen 7 PRO 7840U, AMD Radeon 780M
27.8 fps -25%
Asus ZenBook S13 OLED UX5304
Intel Core i7-1355U, Intel Iris Xe Graphics G7 96EUs
27.3 fps -26%
Lenovo ThinkPad Z13 Gen 2
AMD Ryzen 7 PRO 7840U, AMD Radeon 780M
27.1 fps -27%
Lenovo Yoga 6 13ALC6
AMD Ryzen 7 5700U, AMD Radeon RX Vega 8 (Ryzen 4000/5000)
27 fps -27%
Dell Latitude 7350 Detachable
Intel Core Ultra 7 164U, Intel Graphics 4-Core iGPU (Arc)
23.6 fps -36%
Dell Latitude 13 7350
Intel Core Ultra 5 135U, Intel Graphics 4-Core iGPU (Arc)
23.2 fps -37%
Lenovo ThinkPad X13 G3 21CM002UGE
AMD Ryzen 5 PRO 6650U, AMD Radeon 660M
22.1 fps -40%
Lenovo ThinkPad X13 2-in-1 Gen 5
Intel Core Ultra 7 165U, Intel Graphics 4-Core iGPU (Arc)
20.8 fps -44%
Lenovo ThinkPad X13 2-in-1 Gen 5
Intel Core Ultra 7 165U, Intel Graphics 4-Core iGPU (Arc)
19.1 fps -48%
Strange Brigade
1280x720 lowest AF:1
Asus ProArt PX13 HN7306
AMD Ryzen AI 9 HX 370, NVIDIA GeForce RTX 4070 Laptop GPU
357 (96.9min, 265P1) fps +65%
MSI Prestige 13 AI Plus Evo A2VMG
Intel Core Ultra 7 258V, Intel Arc Graphics 140V
216 (95min, 164.1P1) fps
Усредн. модель с Intel Arc Graphics 140V
  (138.1 - 236, n=10)
207 fps -4%
Dell XPS 13 9350
Intel Core Ultra 7 256V, Intel Arc Graphics 140V
201 (47.5min, 157.9P1) fps -7%
Framework Laptop 13.5 Core Ultra 7 155H
Intel Core Ultra 7 155H, Intel Arc 8-Core iGPU
162.1 (46.4min, 76.2P1) fps -25%
Lenovo ThinkPad Z13 Gen 2
AMD Ryzen 7 PRO 7840U, AMD Radeon 780M
141.9 (74.2min, 109P1) fps -34%
MSI Prestige 13 AI Evo
Intel Core Ultra 7 155H, Intel Arc 8-Core iGPU
121 fps -44%
Dell Latitude 13 7350
Intel Core Ultra 5 135U, Intel Graphics 4-Core iGPU (Arc)
118.4 (25.8min, 85.9P1) fps -45%
Lenovo ThinkPad X13 2-in-1 Gen 5
Intel Core Ultra 7 165U, Intel Graphics 4-Core iGPU (Arc)
107.2 (5min, 50.8P1) fps -50%
Lenovo ThinkPad X13 2-in-1 Gen 5
Intel Core Ultra 7 165U, Intel Graphics 4-Core iGPU (Arc)
78.5 (14.9min, 57.1P1) fps -64%
Lenovo ThinkPad X13 G3 21CM002UGE
AMD Ryzen 5 PRO 6650U, AMD Radeon 660M
99.5 (58.7min, 84.5P1) fps -54%
HP Dragonfly G4
Intel Core i7-1365U, Intel Iris Xe Graphics G7 96EUs
88.8 (19.5min, 29.6P1) fps -59%
Asus ZenBook S13 OLED UX5304
Intel Core i7-1355U, Intel Iris Xe Graphics G7 96EUs
88.4 (19.8min, 31.6P1) fps -59%
Dell Latitude 7350 Detachable
Intel Core Ultra 7 164U, Intel Graphics 4-Core iGPU (Arc)
85.6 (25.4min, 56.3P1) fps -60%
HP Elite Dragonfly G3
Intel Core i7-1265U, Intel Iris Xe Graphics G7 96EUs
84.9 (19.1min, 27.4P1) fps -61%
Lenovo Yoga 6 13ALC6
AMD Ryzen 7 5700U, AMD Radeon RX Vega 8 (Ryzen 4000/5000)
74.1 (52.5min, 62.9P1) fps -66%
Dell XPS 13 Plus 9320 i5-1240p
Intel Core i5-1240P, Intel Iris Xe Graphics G7 80EUs
67.7 (15.5min, 23.7P1) fps -69%
1920x1080 medium AA:medium AF:4
Asus ProArt PX13 HN7306
AMD Ryzen AI 9 HX 370, NVIDIA GeForce RTX 4070 Laptop GPU
268 (118.4min, 215P1) fps +259%
Dell XPS 13 9350
Intel Core Ultra 7 256V, Intel Arc Graphics 140V
84.4 (36.1min, 70.5P1) fps +13%
Усредн. модель с Intel Arc Graphics 140V
  (55.5 - 84.4, n=10)
75.6 fps +1%
MSI Prestige 13 AI Plus Evo A2VMG
Intel Core Ultra 7 258V, Intel Arc Graphics 140V
74.6 (50.7min, 64.1P1) fps
Framework Laptop 13.5 Core Ultra 7 155H
Intel Core Ultra 7 155H, Intel Arc 8-Core iGPU
70.6 (42.7min, 62.5P1) fps -5%
Lenovo ThinkPad Z13 Gen 2
AMD Ryzen 7 PRO 7840U, AMD Radeon 780M
61.2 (43.9min, 52P1) fps -18%
MSI Prestige 13 AI Evo
Intel Core Ultra 7 155H, Intel Arc 8-Core iGPU
53 fps -29%
Dell Latitude 13 7350
Intel Core Ultra 5 135U, Intel Graphics 4-Core iGPU (Arc)
49.1 (26.4min, 39.7P1) fps -34%
Dell Latitude 7350 Detachable
Intel Core Ultra 7 164U, Intel Graphics 4-Core iGPU (Arc)
41 (22.8min, 31.9P1) fps -45%
Lenovo ThinkPad X13 2-in-1 Gen 5
Intel Core Ultra 7 165U, Intel Graphics 4-Core iGPU (Arc)
40.9 (5min, 32P1) fps -45%
Lenovo ThinkPad X13 2-in-1 Gen 5
Intel Core Ultra 7 165U, Intel Graphics 4-Core iGPU (Arc)
38 (8.4min, 28.8P1) fps -49%
Lenovo ThinkPad X13 G3 21CM002UGE
AMD Ryzen 5 PRO 6650U, AMD Radeon 660M
40 (30.9min, 33.8P1) fps -46%
HP Elite Dragonfly G3
Intel Core i7-1265U, Intel Iris Xe Graphics G7 96EUs
39.3 (14.9min, 21.4P1) fps -47%
HP Dragonfly G4
Intel Core i7-1365U, Intel Iris Xe Graphics G7 96EUs
38.4 (17.6min, 22.1P1) fps -49%
Asus ZenBook S13 OLED UX5304
Intel Core i7-1355U, Intel Iris Xe Graphics G7 96EUs
37.8 (13.2min, 21.5P1) fps -49%
Dell XPS 13 Plus 9320 i5-1240p
Intel Core i5-1240P, Intel Iris Xe Graphics G7 80EUs
30.7 (10.4min, 16.6P1) fps -59%
Lenovo Yoga 6 13ALC6
AMD Ryzen 7 5700U, AMD Radeon RX Vega 8 (Ryzen 4000/5000)
28.9 (20.7min, 25.2P1) fps -61%
1920x1080 high AA:high AF:8
Asus ProArt PX13 HN7306
AMD Ryzen AI 9 HX 370, NVIDIA GeForce RTX 4070 Laptop GPU
217 (55min, 163.8P1) fps +244%
Dell XPS 13 9350
Intel Core Ultra 7 256V, Intel Arc Graphics 140V
65.2 (28.3min, 51P1) fps +3%
Усредн. модель с Intel Arc Graphics 140V
  (45.3 - 70.1, n=10)
63.2 fps 0%
MSI Prestige 13 AI Plus Evo A2VMG
Intel Core Ultra 7 258V, Intel Arc Graphics 140V
63 (24.5min, 48.1P1) fps
Framework Laptop 13.5 Core Ultra 7 155H
Intel Core Ultra 7 155H, Intel Arc 8-Core iGPU
59.6 (42.8min, 48.2P1) fps -5%
Lenovo ThinkPad Z13 Gen 2
AMD Ryzen 7 PRO 7840U, AMD Radeon 780M
50.4 (34.6min, 37.7P1) fps -20%
MSI Prestige 13 AI Evo
Intel Core Ultra 7 155H, Intel Arc 8-Core iGPU
41 fps -35%
Dell Latitude 13 7350
Intel Core Ultra 5 135U, Intel Graphics 4-Core iGPU (Arc)
39.6 (20.1min, 24.2P1) fps -37%
Dell Latitude 7350 Detachable
Intel Core Ultra 7 164U, Intel Graphics 4-Core iGPU (Arc)
33.1 (20min, 23.9P1) fps -47%
Lenovo ThinkPad X13 2-in-1 Gen 5
Intel Core Ultra 7 165U, Intel Graphics 4-Core iGPU (Arc)
31.8 (5min, 6.84P1) fps -50%
Lenovo ThinkPad X13 G3 21CM002UGE
AMD Ryzen 5 PRO 6650U, AMD Radeon 660M
31.5 (23.1min, 23.6P1) fps -50%
HP Elite Dragonfly G3
Intel Core i7-1265U, Intel Iris Xe Graphics G7 96EUs
31.4 (11.3min, 17.1P1) fps -50%
HP Dragonfly G4
Intel Core i7-1365U, Intel Iris Xe Graphics G7 96EUs
30.4 (8.5min, 15.4P1) fps -52%
Asus ZenBook S13 OLED UX5304
Intel Core i7-1355U, Intel Iris Xe Graphics G7 96EUs
29.1 (8.4min, 14.7P1) fps -54%
Dell XPS 13 Plus 9320 i5-1240p
Intel Core i5-1240P, Intel Iris Xe Graphics G7 80EUs
24.4 (8.4min, 13.2P1) fps -61%
Lenovo Yoga 6 13ALC6
AMD Ryzen 7 5700U, AMD Radeon RX Vega 8 (Ryzen 4000/5000)
24.3 (17min, 18.8P1) fps -61%
1920x1080 ultra AA:ultra AF:16
Asus ProArt PX13 HN7306
AMD Ryzen AI 9 HX 370, NVIDIA GeForce RTX 4070 Laptop GPU
191.7 (74.9min, 144.8P1) fps +246%
Dell XPS 13 9350
Intel Core Ultra 7 256V, Intel Arc Graphics 140V
58 (24.7min, 30.7P1) fps +5%
MSI Prestige 13 AI Plus Evo A2VMG
Intel Core Ultra 7 258V, Intel Arc Graphics 140V
55.4 (21.6min, 28.3P1) fps
Усредн. модель с Intel Arc Graphics 140V
  (39 - 62.5, n=10)
55.1 fps -1%
Framework Laptop 13.5 Core Ultra 7 155H
Intel Core Ultra 7 155H, Intel Arc 8-Core iGPU
48.5 (12.8min, 21.5P1) fps -12%
Lenovo ThinkPad Z13 Gen 2
AMD Ryzen 7 PRO 7840U, AMD Radeon 780M
43 (26.1min, 32.2P1) fps -22%
MSI Prestige 13 AI Evo
Intel Core Ultra 7 155H, Intel Arc 8-Core iGPU
32 fps -42%
Dell Latitude 13 7350
Intel Core Ultra 5 135U, Intel Graphics 4-Core iGPU (Arc)
29.9 (7.1min, 10P1) fps -46%
Lenovo ThinkPad X13 G3 21CM002UGE
AMD Ryzen 5 PRO 6650U, AMD Radeon 660M
26.7 (7.5min, 20.1P1) fps -52%
Lenovo ThinkPad X13 2-in-1 Gen 5
Intel Core Ultra 7 165U, Intel Graphics 4-Core iGPU (Arc)
26.6 (5min, 5.64P1) fps -52%
Dell Latitude 7350 Detachable
Intel Core Ultra 7 164U, Intel Graphics 4-Core iGPU (Arc)
25.9 (13.7min, 15P1) fps -53%
HP Elite Dragonfly G3
Intel Core i7-1265U, Intel Iris Xe Graphics G7 96EUs
25.4 (6.6min, 8.78P1) fps -54%
HP Dragonfly G4
Intel Core i7-1365U, Intel Iris Xe Graphics G7 96EUs
24.7 (5.3min, 6.86P1) fps -55%
Asus ZenBook S13 OLED UX5304
Intel Core i7-1355U, Intel Iris Xe Graphics G7 96EUs
23.6 (5min, 6.37P1) fps -57%
Lenovo Yoga 6 13ALC6
AMD Ryzen 7 5700U, AMD Radeon RX Vega 8 (Ryzen 4000/5000)
20.7 (13.6min, 15.6P1) fps -63%
F1 22
1280x720 Ultra Low Preset AA:T AF:16x
MSI Prestige 13 AI Plus Evo A2VMG
Intel Core Ultra 7 258V, Intel Arc Graphics 140V
149.5 (126min, 98P1) fps
Усредн. модель с Intel Arc Graphics 140V
  (132.4 - 154.8, n=4)
142.3 fps -5%
Lenovo ThinkPad Z13 Gen 2
AMD Ryzen 7 PRO 7840U, AMD Radeon 780M
141.8 (102min, 97P1) fps -5%
Dell XPS 13 9350
Intel Core Ultra 7 256V, Intel Arc Graphics 140V
132.4 (101min, 88P1) fps -11%
Framework Laptop 13.5 Core Ultra 7 155H
Intel Core Ultra 7 155H, Intel Arc 8-Core iGPU
120.9 (85min, 73P1) fps -19%
MSI Prestige 13 AI Evo
Intel Core Ultra 7 155H, Intel Arc 8-Core iGPU
86.6 (72min, 63P1) fps -42%
HP Dragonfly G4
Intel Core i7-1365U, Intel Iris Xe Graphics G7 96EUs
75.8 (55min, 56P1) fps -49%
Dell Latitude 7350 Detachable
Intel Core Ultra 7 164U, Intel Graphics 4-Core iGPU (Arc)
73.1 (47min, 47P1) fps -51%
Dell Latitude 13 7350
Intel Core Ultra 5 135U, Intel Graphics 4-Core iGPU (Arc)
72.5 (61min, 58P1) fps -52%
Lenovo ThinkPad X13 G3 21CM002UGE
AMD Ryzen 5 PRO 6650U, AMD Radeon 660M
72.1 (61min, 57P1) fps -52%
Asus ZenBook S13 OLED UX5304
Intel Core i7-1355U, Intel Iris Xe Graphics G7 96EUs
71.8 (54min, 54P1) fps -52%
1920x1080 Low Preset AA:T AF:16x
MSI Prestige 13 AI Plus Evo A2VMG
Intel Core Ultra 7 258V, Intel Arc Graphics 140V
96.2 (77min, 72P1) fps
Усредн. модель с Intel Arc Graphics 140V
  (79.1 - 101, n=4)
90.4 fps -6%
Lenovo ThinkPad Z13 Gen 2
AMD Ryzen 7 PRO 7840U, AMD Radeon 780M
84.2 (66min, 61P1) fps -12%
Dell XPS 13 9350
Intel Core Ultra 7 256V, Intel Arc Graphics 140V
79.1 (63min, 61P1) fps -18%
Framework Laptop 13.5 Core Ultra 7 155H
Intel Core Ultra 7 155H, Intel Arc 8-Core iGPU
73.9 (31min, 45P1) fps -23%
MSI Prestige 13 AI Evo
Intel Core Ultra 7 155H, Intel Arc 8-Core iGPU
59.1 (46min, 44P1) fps -39%
Dell Latitude 13 7350
Intel Core Ultra 5 135U, Intel Graphics 4-Core iGPU (Arc)
46.6 (36min, 35P1) fps -52%
HP Dragonfly G4
Intel Core i7-1365U, Intel Iris Xe Graphics G7 96EUs
43.6 (34min, 31P1) fps -55%
Dell Latitude 7350 Detachable
Intel Core Ultra 7 164U, Intel Graphics 4-Core iGPU (Arc)
43.3 (29min, 29P1) fps -55%
Lenovo ThinkPad X13 G3 21CM002UGE
AMD Ryzen 5 PRO 6650U, AMD Radeon 660M
42.4 (33min, 27P1) fps -56%
Asus ZenBook S13 OLED UX5304
Intel Core i7-1355U, Intel Iris Xe Graphics G7 96EUs
41.6 (33min, 31P1) fps -57%
1920x1080 Medium Preset AA:T AF:16x
MSI Prestige 13 AI Plus Evo A2VMG
Intel Core Ultra 7 258V, Intel Arc Graphics 140V
88.5 (75min, 69P1) fps
Усредн. модель с Intel Arc Graphics 140V
  (75.7 - 90, n=4)
83.3 fps -6%
Dell XPS 13 9350
Intel Core Ultra 7 256V, Intel Arc Graphics 140V
78.8 (37min, 40P1) fps -11%
Lenovo ThinkPad Z13 Gen 2
AMD Ryzen 7 PRO 7840U, AMD Radeon 780M
74.7 (43min, 45P1) fps -16%
Framework Laptop 13.5 Core Ultra 7 155H
Intel Core Ultra 7 155H, Intel Arc 8-Core iGPU
68.6 (50min, 44P1) fps -22%
MSI Prestige 13 AI Evo
Intel Core Ultra 7 155H, Intel Arc 8-Core iGPU
49.6 (41min, 37P1) fps -44%
Dell Latitude 13 7350
Intel Core Ultra 5 135U, Intel Graphics 4-Core iGPU (Arc)
41.9 (35min, 34P1) fps -53%
HP Dragonfly G4
Intel Core i7-1365U, Intel Iris Xe Graphics G7 96EUs
39.4 (33min, 30P1) fps -55%
Lenovo ThinkPad X13 G3 21CM002UGE
AMD Ryzen 5 PRO 6650U, AMD Radeon 660M
37 (31min, 24P1) fps -58%
Asus ZenBook S13 OLED UX5304
Intel Core i7-1355U, Intel Iris Xe Graphics G7 96EUs
36.6 (31min, 28P1) fps -59%
Dell Latitude 7350 Detachable
Intel Core Ultra 7 164U, Intel Graphics 4-Core iGPU (Arc)
34.1 (26min, 26P1) fps -61%
1920x1080 High Preset AA:T AF:16x
Dell XPS 13 9350
Intel Core Ultra 7 256V, Intel Arc Graphics 140V
64.5 (45min, 43P1) fps +1%
MSI Prestige 13 AI Plus Evo A2VMG
Intel Core Ultra 7 258V, Intel Arc Graphics 140V
63.9 (54min, 52P1) fps
Усредн. модель с Intel Arc Graphics 140V
  (54.8 - 66.5, n=4)
62.4 fps -2%
Lenovo ThinkPad Z13 Gen 2
AMD Ryzen 7 PRO 7840U, AMD Radeon 780M
53.6 (44min, 35P1) fps -16%
Framework Laptop 13.5 Core Ultra 7 155H
Intel Core Ultra 7 155H, Intel Arc 8-Core iGPU
52.9 (36min, 38P1) fps -17%
MSI Prestige 13 AI Evo
Intel Core Ultra 7 155H, Intel Arc 8-Core iGPU
36.8 (30min, 29P1) fps -42%
Dell Latitude 13 7350
Intel Core Ultra 5 135U, Intel Graphics 4-Core iGPU (Arc)
30.8 (25min, 25P1) fps -52%
Asus ZenBook S13 OLED UX5304
Intel Core i7-1355U, Intel Iris Xe Graphics G7 96EUs
27.6 (21min, 21P1) fps -57%
HP Dragonfly G4
Intel Core i7-1365U, Intel Iris Xe Graphics G7 96EUs
27.4 (22min, 22P1) fps -57%
Lenovo ThinkPad X13 G3 21CM002UGE
AMD Ryzen 5 PRO 6650U, AMD Radeon 660M
26.2 (20min, 18P1) fps -59%
Dell Latitude 7350 Detachable
Intel Core Ultra 7 164U, Intel Graphics 4-Core iGPU (Arc)
25 (16min, 17P1) fps -61%
1920x1080 Ultra High Preset AA:T AF:16x
HP Dragonfly G4
Intel Core i7-1365U, Intel Iris Xe Graphics G7 96EUs
22.2 (17min, 16P1) fps +12%
Asus ZenBook S13 OLED UX5304
Intel Core i7-1355U, Intel Iris Xe Graphics G7 96EUs
20.7 (17min, 15P1) fps +4%
MSI Prestige 13 AI Plus Evo A2VMG
Intel Core Ultra 7 258V, Intel Arc Graphics 140V
19.9 (15min, 15P1) fps
Усредн. модель с Intel Arc Graphics 140V
  (19.6 - 19.9, n=2)
19.8 fps -1%
Lenovo ThinkPad Z13 Gen 2
AMD Ryzen 7 PRO 7840U, AMD Radeon 780M
14.6 (10min, 9P1) fps -27%
MSI Prestige 13 AI Evo
Intel Core Ultra 7 155H, Intel Arc 8-Core iGPU
9.33 (7min, 7P1) fps -53%
Dell Latitude 13 7350
Intel Core Ultra 5 135U, Intel Graphics 4-Core iGPU (Arc)
8.03 (6min, 6P1) fps -60%
Dell Latitude 7350 Detachable
Intel Core Ultra 7 164U, Intel Graphics 4-Core iGPU (Arc)
6.95 (5min, 5P1) fps -65%
Lenovo ThinkPad X13 G3 21CM002UGE
AMD Ryzen 5 PRO 6650U, AMD Radeon 660M
5.13 (2min, 3P1) fps -74%
Baldur's Gate 3
1280x720 Low Preset
MSI Prestige 13 AI Plus Evo A2VMG
Intel Core Ultra 7 258V, Intel Arc Graphics 140V
58.8 fps
Усредн. модель с Intel Arc Graphics 140V
  (49.3 - 66.4, n=5)
56.9 fps -3%
Lenovo ThinkPad Z13 Gen 2
AMD Ryzen 7 PRO 7840U, AMD Radeon 780M
56.3 fps -4%
Framework Laptop 13.5 Core Ultra 7 155H
Intel Core Ultra 7 155H, Intel Arc 8-Core iGPU
53.9 fps -8%
Dell XPS 13 9350
Intel Core Ultra 7 256V, Intel Arc Graphics 140V
51.7 fps -12%
Lenovo ThinkPad X13 2-in-1 Gen 5
Intel Core Ultra 7 165U, Intel Graphics 4-Core iGPU (Arc)
33 fps -44%
Lenovo ThinkPad X13 Gen 4 21J3001VGE
AMD Ryzen 7 PRO 7840U, AMD Radeon 780M
30.7 (16.1min, 16.4P0.1, 21.1P1) fps -48%
Dell Latitude 13 7350
Intel Core Ultra 5 135U, Intel Graphics 4-Core iGPU (Arc)
28.5 fps -52%
Dell Latitude 7350 Detachable
Intel Core Ultra 7 164U, Intel Graphics 4-Core iGPU (Arc)
21.4 fps -64%
1920x1080 Low Preset
Asus ProArt PX13 HN7306
AMD Ryzen AI 9 HX 370, NVIDIA GeForce RTX 4070 Laptop GPU
127.4 fps +222%
MSI Prestige 13 AI Plus Evo A2VMG
Intel Core Ultra 7 258V, Intel Arc Graphics 140V
39.6 fps
Lenovo ThinkPad Z13 Gen 2
AMD Ryzen 7 PRO 7840U, AMD Radeon 780M
39.1 fps -1%
Framework Laptop 13.5 Core Ultra 7 155H
Intel Core Ultra 7 155H, Intel Arc 8-Core iGPU
36.9 fps -7%
Усредн. модель с Intel Arc Graphics 140V
  (23.7 - 43, n=12)
36.9 fps -7%
Dell XPS 13 9350
Intel Core Ultra 7 256V, Intel Arc Graphics 140V
36.6 fps -8%
Lenovo ThinkPad X13 2-in-1 Gen 5
Intel Core Ultra 7 165U, Intel Graphics 4-Core iGPU (Arc)
21.7 fps -45%
Lenovo ThinkPad X13 Gen 4 21J3001VGE
AMD Ryzen 7 PRO 7840U, AMD Radeon 780M
20.4 (14min, 14.7P0.1, 16.2P1) fps -48%
Dell Latitude 13 7350
Intel Core Ultra 5 135U, Intel Graphics 4-Core iGPU (Arc)
18.8 fps -53%
Dell Latitude 7350 Detachable
Intel Core Ultra 7 164U, Intel Graphics 4-Core iGPU (Arc)
14.7 fps -63%
1920x1080 Medium Preset
Asus ProArt PX13 HN7306
AMD Ryzen AI 9 HX 370, NVIDIA GeForce RTX 4070 Laptop GPU
109.7 fps +227%
MSI Prestige 13 AI Plus Evo A2VMG
Intel Core Ultra 7 258V, Intel Arc Graphics 140V
33.5 fps
Lenovo ThinkPad Z13 Gen 2
AMD Ryzen 7 PRO 7840U, AMD Radeon 780M
31.7 fps -5%
Framework Laptop 13.5 Core Ultra 7 155H
Intel Core Ultra 7 155H, Intel Arc 8-Core iGPU
30.7 fps -8%
Dell XPS 13 9350
Intel Core Ultra 7 256V, Intel Arc Graphics 140V
30.5 fps -9%
Усредн. модель с Intel Arc Graphics 140V
  (19.6 - 33.7, n=12)
29.9 fps -11%
Lenovo ThinkPad X13 2-in-1 Gen 5
Intel Core Ultra 7 165U, Intel Graphics 4-Core iGPU (Arc)
16.4 fps -51%
Lenovo ThinkPad X13 Gen 4 21J3001VGE
AMD Ryzen 7 PRO 7840U, AMD Radeon 780M
15.7 (2.29min, 3.59P0.1, 11.8P1) fps -53%
Dell Latitude 13 7350
Intel Core Ultra 5 135U, Intel Graphics 4-Core iGPU (Arc)
15.5 fps -54%
Dell Latitude 7350 Detachable
Intel Core Ultra 7 164U, Intel Graphics 4-Core iGPU (Arc)
12.4 fps -63%
1920x1080 High Preset
Asus ProArt PX13 HN7306
AMD Ryzen AI 9 HX 370, NVIDIA GeForce RTX 4070 Laptop GPU
72.7 fps +144%
MSI Prestige 13 AI Plus Evo A2VMG
Intel Core Ultra 7 258V, Intel Arc Graphics 140V
29.8 fps
Framework Laptop 13.5 Core Ultra 7 155H
Intel Core Ultra 7 155H, Intel Arc 8-Core iGPU
26.7 fps -10%
Усредн. модель с Intel Arc Graphics 140V
  (17 - 30, n=12)
26.7 fps -10%
Lenovo ThinkPad Z13 Gen 2
AMD Ryzen 7 PRO 7840U, AMD Radeon 780M
26.1 fps -12%
Dell XPS 13 9350
Intel Core Ultra 7 256V, Intel Arc Graphics 140V
25.8 fps -13%
Lenovo ThinkPad X13 2-in-1 Gen 5
Intel Core Ultra 7 165U, Intel Graphics 4-Core iGPU (Arc)
14.2 fps -52%
Lenovo ThinkPad X13 Gen 4 21J3001VGE
AMD Ryzen 7 PRO 7840U, AMD Radeon 780M
13.8 (9.35min, 9.36P0.1, 10.2P1) fps -54%
Dell Latitude 13 7350
Intel Core Ultra 5 135U, Intel Graphics 4-Core iGPU (Arc)
13.2 fps -56%
Dell Latitude 7350 Detachable
Intel Core Ultra 7 164U, Intel Graphics 4-Core iGPU (Arc)
12 fps -60%
1920x1080 Ultra Preset
Asus ProArt PX13 HN7306
AMD Ryzen AI 9 HX 370, NVIDIA GeForce RTX 4070 Laptop GPU
66.7 fps +129%
MSI Prestige 13 AI Plus Evo A2VMG
Intel Core Ultra 7 258V, Intel Arc Graphics 140V
29.1 fps
Усредн. модель с Intel Arc Graphics 140V
  (16.6 - 29.5, n=12)
25.9 fps -11%
Lenovo ThinkPad Z13 Gen 2
AMD Ryzen 7 PRO 7840U, AMD Radeon 780M
25.7 fps -12%
Framework Laptop 13.5 Core Ultra 7 155H
Intel Core Ultra 7 155H, Intel Arc 8-Core iGPU
25.7 fps -12%
Dell XPS 13 9350
Intel Core Ultra 7 256V, Intel Arc Graphics 140V
25.7 fps -12%
Lenovo ThinkPad X13 2-in-1 Gen 5
Intel Core Ultra 7 165U, Intel Graphics 4-Core iGPU (Arc)
13.5 fps -54%
Lenovo ThinkPad X13 Gen 4 21J3001VGE
AMD Ryzen 7 PRO 7840U, AMD Radeon 780M
13.4 (9.26min, 9.5P0.1, 10.3P1) fps -54%
Dell Latitude 13 7350
Intel Core Ultra 5 135U, Intel Graphics 4-Core iGPU (Arc)
12.1 fps -58%
Dell Latitude 7350 Detachable
Intel Core Ultra 7 164U, Intel Graphics 4-Core iGPU (Arc)
11.5 fps -60%
Cyberpunk 2077 2.1 Phantom Liberty
1280x720 Low Preset (FSR off)
MSI Prestige 13 AI Plus Evo A2VMG
Intel Core Ultra 7 258V, Intel Arc Graphics 140V
68.8 (52.9min) fps
Dell XPS 13 9350
Intel Core Ultra 7 256V, Intel Arc Graphics 140V
66.6 (50.2min) fps -3%
Усредн. модель с Intel Arc Graphics 140V
  (58.8 - 68.8, n=5)
66.1 fps -4%
Lenovo ThinkPad Z13 Gen 2
AMD Ryzen 7 PRO 7840U, AMD Radeon 780M
62.7 (23.5min) fps -9%
Lenovo ThinkPad X13 Gen 4 21J3001VGE
AMD Ryzen 7 PRO 7840U, AMD Radeon 780M
55.4 (44.6min) fps -19%
Framework Laptop 13.5 Core Ultra 7 155H
Intel Core Ultra 7 155H, Intel Arc 8-Core iGPU
47.4 (40.3min) fps -31%
Dell Latitude 13 7350
Intel Core Ultra 5 135U, Intel Graphics 4-Core iGPU (Arc)
28 (23min) fps -59%
Lenovo ThinkPad X13 2-in-1 Gen 5
Intel Core Ultra 7 165U, Intel Graphics 4-Core iGPU (Arc)
25.8 (21.2min) fps -62%
Dell Latitude 7350 Detachable
Intel Core Ultra 7 164U, Intel Graphics 4-Core iGPU (Arc)
25.6 (18min) fps -63%
1920x1080 Low Preset (FSR off)
Asus ProArt PX13 HN7306
AMD Ryzen AI 9 HX 370, NVIDIA GeForce RTX 4070 Laptop GPU
115.2 (93.5min) fps +147%
MSI Prestige 13 AI Plus Evo A2VMG
Intel Core Ultra 7 258V, Intel Arc Graphics 140V
46.6 (38.1min) fps
Dell XPS 13 9350
Intel Core Ultra 7 256V, Intel Arc Graphics 140V
45.7 (36.4min) fps -2%
Усредн. модель с Intel Arc Graphics 140V
  (30.5 - 47.3, n=12)
42.5 fps -9%
Lenovo ThinkPad Z13 Gen 2
AMD Ryzen 7 PRO 7840U, AMD Radeon 780M
38 (25min) fps -18%
Framework Laptop 13.5 Core Ultra 7 155H
Intel Core Ultra 7 155H, Intel Arc 8-Core iGPU
34.3 (29.3min) fps -26%
Lenovo ThinkPad X13 Gen 4 21J3001VGE
AMD Ryzen 7 PRO 7840U, AMD Radeon 780M
33.8 (28.7min) fps -27%
Dell Latitude 13 7350
Intel Core Ultra 5 135U, Intel Graphics 4-Core iGPU (Arc)
17.8 (13.6min) fps -62%
Dell Latitude 7350 Detachable
Intel Core Ultra 7 164U, Intel Graphics 4-Core iGPU (Arc)
17.6 (12.9min) fps -62%
Lenovo ThinkPad X13 2-in-1 Gen 5
Intel Core Ultra 7 165U, Intel Graphics 4-Core iGPU (Arc)
17.5 (14.2min) fps -62%
1920x1080 Medium Preset (FSR off)
Asus ProArt PX13 HN7306
AMD Ryzen AI 9 HX 370, NVIDIA GeForce RTX 4070 Laptop GPU
101.9 (85.8min) fps +172%
MSI Prestige 13 AI Plus Evo A2VMG
Intel Core Ultra 7 258V, Intel Arc Graphics 140V
37.4 (31.5min) fps
Dell XPS 13 9350
Intel Core Ultra 7 256V, Intel Arc Graphics 140V
37 (30.1min) fps -1%
Усредн. модель с Intel Arc Graphics 140V
  (24.3 - 39.3, n=12)
34.9 fps -7%
Lenovo ThinkPad Z13 Gen 2
AMD Ryzen 7 PRO 7840U, AMD Radeon 780M
29.4 (15.9min) fps -21%
Framework Laptop 13.5 Core Ultra 7 155H
Intel Core Ultra 7 155H, Intel Arc 8-Core iGPU
27.8 (24.1min) fps -26%
Lenovo ThinkPad X13 Gen 4 21J3001VGE
AMD Ryzen 7 PRO 7840U, AMD Radeon 780M
26.1 (22.4min) fps -30%
Dell Latitude 7350 Detachable
Intel Core Ultra 7 164U, Intel Graphics 4-Core iGPU (Arc)
15.1 (11.9min) fps -60%
Lenovo ThinkPad X13 2-in-1 Gen 5
Intel Core Ultra 7 165U, Intel Graphics 4-Core iGPU (Arc)
14 (11.9min) fps -63%
Dell Latitude 13 7350
Intel Core Ultra 5 135U, Intel Graphics 4-Core iGPU (Arc)
13.8 (11.9min) fps -63%
1920x1080 High Preset (FSR off)
Asus ProArt PX13 HN7306
AMD Ryzen AI 9 HX 370, NVIDIA GeForce RTX 4070 Laptop GPU
86.1 (72.3min) fps +165%
MSI Prestige 13 AI Plus Evo A2VMG
Intel Core Ultra 7 258V, Intel Arc Graphics 140V
32.5 (26.9min) fps
Dell XPS 13 9350
Intel Core Ultra 7 256V, Intel Arc Graphics 140V
32 (26.2min) fps -2%
Усредн. модель с Intel Arc Graphics 140V
  (20 - 34.4, n=12)
29.7 fps -9%
Lenovo ThinkPad Z13 Gen 2
AMD Ryzen 7 PRO 7840U, AMD Radeon 780M
23.5 (13.4min) fps -28%
Framework Laptop 13.5 Core Ultra 7 155H
Intel Core Ultra 7 155H, Intel Arc 8-Core iGPU
23.4 (20.1min) fps -28%
Lenovo ThinkPad X13 Gen 4 21J3001VGE
AMD Ryzen 7 PRO 7840U, AMD Radeon 780M
21 (17.8min) fps -35%
Dell Latitude 7350 Detachable
Intel Core Ultra 7 164U, Intel Graphics 4-Core iGPU (Arc)
12.8 (9.43min) fps -61%
Lenovo ThinkPad X13 2-in-1 Gen 5
Intel Core Ultra 7 165U, Intel Graphics 4-Core iGPU (Arc)
12.4 (10.3min) fps -62%
Dell Latitude 13 7350
Intel Core Ultra 5 135U, Intel Graphics 4-Core iGPU (Arc)
11.9 (10min) fps -63%
1920x1080 Ultra Preset (FSR off)
Asus ProArt PX13 HN7306
AMD Ryzen AI 9 HX 370, NVIDIA GeForce RTX 4070 Laptop GPU
74.1 (60.8min) fps +160%
MSI Prestige 13 AI Plus Evo A2VMG
Intel Core Ultra 7 258V, Intel Arc Graphics 140V
28.5 (23.3min) fps
Усредн. модель с Intel Arc Graphics 140V
  (17.5 - 30.1, n=12)
24.6 fps -14%
Framework Laptop 13.5 Core Ultra 7 155H
Intel Core Ultra 7 155H, Intel Arc 8-Core iGPU
21.1 (17.4min) fps -26%
Lenovo ThinkPad Z13 Gen 2
AMD Ryzen 7 PRO 7840U, AMD Radeon 780M
20.3 (10.1min) fps -29%
Dell XPS 13 9350
Intel Core Ultra 7 256V, Intel Arc Graphics 140V
19.1 (15.5min) fps -33%
Lenovo ThinkPad X13 Gen 4 21J3001VGE
AMD Ryzen 7 PRO 7840U, AMD Radeon 780M
18.9 (15.7min) fps -34%
Dell Latitude 7350 Detachable
Intel Core Ultra 7 164U, Intel Graphics 4-Core iGPU (Arc)
11.3 (8.63min) fps -60%
Lenovo ThinkPad X13 2-in-1 Gen 5
Intel Core Ultra 7 165U, Intel Graphics 4-Core iGPU (Arc)
10.7 (8.84min) fps -62%
Dell Latitude 13 7350
Intel Core Ultra 5 135U, Intel Graphics 4-Core iGPU (Arc)
10.3 (8.89min) fps -64%

Частота кадров, Cyberpunk 2077

0510152025Tooltip
MSI Prestige 13 AI Plus Evo A2VMG Core Ultra 7 258V, Arc 140V: Ø24.7 (22.9-25.7)
мин.сред.выс.макс.
GTA V (2015) 161.6 155.6 67.4 26.7
Dota 2 Reborn (2015) 97.2 87.8 72.1 83
Final Fantasy XV Benchmark (2018) 84 46.2 31.7
X-Plane 11.11 (2018) 56.6 42.6 36.9
Far Cry 5 (2018) 92 57 49 45
Strange Brigade (2018) 216 74.6 63 55.4
Tiny Tina's Wonderlands (2022) 72.1 53.3 36 28
F1 22 (2022) 96.2 88.5 63.9 19.9
Baldur's Gate 3 (2023) 39.6 33.5 29.8 29.1
Cyberpunk 2077 2.1 Phantom Liberty (2023) 46.6 37.4 32.5 28.5

Температурные и акустические показатели

Система охлаждения

Шум вентилятора в целом громче, чем раньше, при запуске более требовательных нагрузок, например, игр. При запуске Cyberpunk 2077 в режиме Performance уровень шума вентилятора составит 45 дБ(A) по сравнению с почти 51 дБ(A) в режиме Cooler Boost.

Профиль шума вентилятора (Белый: Фоновый, Красный: Простой системы, Синий: 3DMark 06, Оранжевый: Cyberpunk 2077, зеленый: Cooler Boost on)

Уровень шума

Ожидание
24.8 / 24.8 / 26.7 дБ
Нагрузка
36.8 / 50.8 дБ
  red to green bar
 
 
30 dB
бесшумно
40 dB(A)
различимо
50 dB(A)
громко
 
min: dark, med: mid, max: light   Earthworks M23R, Arta (15 см от источника шума)   фоновый шум: 24.1 dB(A)
dB(A) 0102030405060708090Deep BassMiddle BassHigh BassLower RangeMidsHigher MidsLower HighsMid HighsUpper HighsSuper Highs2032.838.132.139.633.82522.427.22430.823.13123.526.628.429.521.14021.42722.623.2225026.224.823.227.826.86328.728.62728.928.28024.7282321.825.210025.122.821.719.432.412526.919.916.916.128.216025.619.816.617.934.220025.222.71817.332.325027.431.517.515.934.731533.622.520.61936.840028.322.518.718.335.450029.721.916.514.734.963029.221.314.112.735.180030.122.911.410.536.1100030.823.59.71036.412503124.79.59.536.916003225.69.69.838.1200033.328.31010.139250034.127.910.110.239.431503425.710.810.539.5400034.125.211.911.340.8500035.923.51312.141.9630030.819.212.611.840.3800028.217.513.311.538.61000025.51512.111.535.71250022.113.811.811.433.11600018.112.311.910.628.6SPL44.536.824.824.150.8N4.82.50.60.67.8median 29.7median 22.7median 12.6median 11.5median 36.1Delta3.52.83.22.92.7hearing rangehide median Fan NoiseMSI Prestige 13 AI Plus Evo A2VMG
MSI Prestige 13 AI Plus Evo A2VMG
Arc 140V, Core Ultra 7 258V
MSI Prestige 13 AI Evo
Arc 8-Core, Ultra 7 155H, Samsung PM9A1 MZVL21T0HCLR
Dell XPS 13 9350
Arc 140V, Core Ultra 7 256V, Micron 2550 512GB
Framework Laptop 13.5 Core Ultra 7 155H
Arc 8-Core, Ultra 7 155H
Lenovo Yoga Book 9 13IMU9
Graphics 4-Core, Ultra 7 155U
HP Dragonfly G4
Iris Xe G7 96EUs, i7-1365U, Micron 3400 MTFDKBA512TFH 512GB
Уровень шума
6%
11%
1%
16%
12%
в выкл. виде (фон) *
24.1
23.4
3%
24.1
-0%
24
-0%
23.3
3%
23.3
3%
Мин. в простое *
24.8
23.4
6%
24.4
2%
24.1
3%
23.3
6%
23.5
5%
В простое, сред. *
24.8
26.9
-8%
24.4
2%
25.1
-1%
23.3
6%
23.5
5%
В простое, макс. *
26.7
26.9
-1%
24.4
9%
27
-1%
24.6
8%
26.8
-0%
Нагрузка, сред. *
36.8
32
13%
26.2
29%
38.4
-4%
26.2
29%
27.2
26%
Cyberpunk 2077 ultra *
44.5
34.2
23%
43.7
2%
Нагрузка, макс. *
50.8
40.3
21%
45.2
11%
45.8
10%
27.3
46%
35
31%
Witcher 3 ultra *
32
27.3
32.7

* ... меньше = лучше

Температура

Температура поверхности левой половины корпуса теплее, чем правой. Горячие точки нагреваются примерно так же, как и у оригинального Prestige 13 AI, несмотря на обновление процессора.

Горячий воздух отводится сзади
Температура адаптера переменного тока при нагрузке превышает 46 C
Макс.
 43.4 °C43.2 °C38.8 °C 
 39 °C39.6 °C30.4 °C 
 29.8 °C26 °C23.6 °C 
Макс.: 43.4 °C
Усредн.: 34.9 °C
26.8 °C42.4 °C41.8 °C
24.8 °C36.4 °C36.4 °C
24.2 °C28 °C28.4 °C
Макс.: 42.4 °C
Усредн.: 32.1 °C
ЗУ (макс.)  43.4 °C | Темп. воздуха 20 °C | Fluke 62 Mini IR Thermometer
(±) При нагрузочном тестировании верх корпуса нагревается в среднем до 34.9 град. Типичное значение для устройств этого же класса (Subnotebook) = 30.8 градуса (-ов).
(±) Макс. температура верха корпуса составила 43.4 град. Цельсия. Типичное значение для устройств этого же класса (Subnotebook) = 35.9 градуса (-ов) при минимуме в 21.4 град. и максимуме в 59 град.
(±) Макс. температура дна составила 42.4 град. Цельсия. Типичное значение для устройств этого же класса = 39.4 градуса (-ов).
(+) При отсутствии вычислительной нагрузки верх корпуса нагревается в среднем до 23.4 град. Типичное значение для устройств этого же класса = 30.8 градуса (-ов).
(+) Палуба на ощупь: Прохладно (29.8 град. Цельсия).
(±) Средняя температура палубы у похожих моделей составила 28.3 град. Цельсия, это -1.5 градуса (-ов) разницы.
Система простаивает (палуба ноутбука)
Система простаивает (днище ноутбука)
Prime95+FurMark  (палуба ноутбука)
Prime95+FurMark (палуба ноутбука)
Prime95+FurMark (днище ноутбука)
MSI Prestige 13 AI Plus Evo A2VMG
Intel Core Ultra 7 258V, Intel Arc Graphics 140V
MSI Prestige 13 AI Evo
Intel Core Ultra 7 155H, Intel Arc 8-Core iGPU
Dell XPS 13 9350
Intel Core Ultra 7 256V, Intel Arc Graphics 140V
Framework Laptop 13.5 Core Ultra 7 155H
Intel Core Ultra 7 155H, Intel Arc 8-Core iGPU
Lenovo Yoga Book 9 13IMU9
Intel Core Ultra 7 155U, Intel Graphics 4-Core iGPU (Arc)
HP Dragonfly G4
Intel Core i7-1365U, Intel Iris Xe Graphics G7 96EUs
Нагрев
3%
8%
-6%
-9%
-2%
Нагрузка, макс. сверху *
43.4
40.9
6%
34.8
20%
42.8
1%
39.2
10%
38.6
11%
Нагрузка, макс. на дне *
42.4
40.4
5%
37.4
12%
45.2
-7%
41
3%
40.4
5%
В простое сверху *
25.4
25
2%
25.4
-0%
27.2
-7%
32.2
-27%
28.2
-11%
В простое на дне *
25.6
25.5
-0%
26.2
-2%
28.6
-12%
31.6
-23%
29
-13%

* ... меньше = лучше

Стресс-тест

Система простаивает
Система простаивает

При выполнении стресса Prime95 процессор разгоняется до 3,6 ГГц, 40 Вт и 82 C в течение примерно 30 секунд. После этого он быстро снижается и стабилизируется на частоте 2,9 ГГц и 27 Вт, чтобы поддерживать температуру ядра на уровне 77 C. Если включить Cooler Boost, температура ядра немного снизится, а тактовые частоты останутся почти такими же.

В играх температура ядра стабилизируется на уровне 75 C по сравнению с 71 C на Dell XPS 13 с аналогичным процессором Lunar Lake.

Cyberpunk 2077
Cyberpunk 2077
Prime95+FurMark
Prime95+FurMark
Prime95  (Cooler Boost выключен)
Prime95 (Cooler Boost выключен)
Prime95 (Cooler Boost включен)
Средняя тактовая частота процессора (ГГц) Тактовая частота графического процессора (МГц) Средняя температура процессора (°C)
Простой системы -- 400 32
Prime95 (Cooler Boost off) 2.9 -- 77
Prime95 (Cooler Boost on) 3.0 -- 75
Prime95 + FurMark 1.6 1800 76
Cyberpunk 2077 1.5 1950 75

Акустическая система

Розовый шум показывает максимальную громкость для такой легкой системы
dB(A) 0102030405060708090Deep BassMiddle BassHigh BassLower RangeMidsHigher MidsLower HighsMid HighsUpper HighsSuper Highs2030.132.130.12521.62421.63121.728.421.74022.222.622.25023.423.223.4632827288024.12324.110029.821.729.812539.716.939.716051.616.651.620052185225054.217.554.231553.320.653.340054.618.754.650058.916.558.963060.814.160.880066.211.466.2100069.49.769.4125074.29.574.2160074.69.674.6200073.81073.8250071.610.171.6315073.610.873.6400073.911.973.9500076.21376.2630069.812.669.8800071.413.371.41000069.212.169.21250063.111.863.11600062.411.962.4SPL84.524.884.5N58.10.658.1median 66.2median 12.6median 66.2Delta8.83.28.826.325.821.422.12624.925.127.622.532.523.448.72655.818.860.922.167.2267019.372.317.674.217.774.319.575.31571.711.871.311.27410.574.21072.710.17210.67210.97511.374.811.671.71269.71269.612.371.112.669.61270.111.269.824.784.70.666.6median 12median 71.73.42.2hearing rangehide median Pink NoiseMSI Prestige 13 AI Plus Evo A2VMGApple MacBook Pro 16 2021 M1 Pro
АЧХ (если нужно отключить сравнение, нажмите на квадратики сверху)
Анализ АЧХ аудиосистемы MSI Prestige 13 AI Plus Evo A2VMG

(+) | отличный уровень макс. громкости (84.5 дБА)
Низкие частоты (100 Гц - 315 Гц)
(-) | баса почти нет (на 19.4% меньше медианы)
(±) | он умеренно сбалансирован
Средние частоты (400 Гц - 2000 Гц)
(±) | диапазон воспроизводится громче желаемого (отклонение 6.4% от медианы)
(+) | он ровный, без "горбов" или провалов
Высокие частоты (2 кГц - 16 кГц)
(±) | диапазон воспроизводится громче желаемого (отклонение 6.1% от медианы)
(+) | он ровный, без "горбов" или провалов
Весь диапазон (100 - 16000 Гц)
(±) | звук в целом не очень сбалансирован (18.2% отличия от медианы)
в сравнении с устройствами того же класса
» 50% прямо сравнимых устройств показал(и) себя лучше, 7% примерно так же, 43% значительно хуже
» Δ наилучшего устройства из прямо сравнимых: 5%, средняя Δ: 19%, худший результат: 53%
в сравнении со всеми тестированными устройствами
» 36% известных нам устройств показал(и) себя лучше, 8% примерно так же, 57% значительно хуже
» Δ наилучшего устройства среди известных нам: 4%, средняя Δ: 25%, худший результат: 134%

Анализ АЧХ аудиосистемы Apple MacBook Pro 16 2021 M1 Pro

(+) | отличный уровень макс. громкости (84.7 дБА)
Низкие частоты (100 Гц - 315 Гц)
(+) | бас отлично сбалансирован (отклонение лишь 3.8% от медианы)
(+) | он ровный, без "горбов" или провалов
Средние частоты (400 Гц - 2000 Гц)
(+) | диапазон не провален и не выпячен (отклонение лишь 1.3% от медианы)
(+) | он ровный, без "горбов" или провалов
Высокие частоты (2 кГц - 16 кГц)
(+) | диапазон отлично сбалансирован (отклонение лишь 1.9% от медианы)
(+) | он ровный, без "горбов" или провалов
Весь диапазон (100 - 16000 Гц)
(+) | звук в целом сбалансирован (4.6% отличия от медианы)
в сравнении с устройствами того же класса
» 0% прямо сравнимых устройств показал(и) себя лучше, 0% примерно так же, 100% значительно хуже
» Δ наилучшего устройства из прямо сравнимых: 5%, средняя Δ: 18%, худший результат: 45%
в сравнении со всеми тестированными устройствами
» 0% известных нам устройств показал(и) себя лучше, 0% примерно так же, 100% значительно хуже
» Δ наилучшего устройства среди известных нам: 4%, средняя Δ: 25%, худший результат: 134%

Энергопотребление и автономная работа

Энергопотребление

Система становится более требовательной, чем конфигурация Core Ultra 7 155H, при длительном выполнении задач с высокой нагрузкой на процессор, поскольку она не так сильно дросселируется. Потребление также выше примерно на 50% в играх, что согласуется с гораздо более высокой производительностью графики.

3DMark 06
3DMark 06
Cyberpunk 2077 1080p Ультра
Prime95
Prime95
Prime95+FurMark
Prime95+FurMark
Энергопотребление
Выкл.darklight 0.44 / 0.84 Вт
Ожиданиеdarkmidlight 3.5 / 5.9 / 10 Вт
Нагрузка midlight 38.7 / 61.5 Вт
 color bar
Легенда: min: dark, med: mid, max: light        Metrahit Energy
MSI Prestige 13 AI Plus Evo A2VMG
Core Ultra 7 258V, Arc 140V, , OLED, 2880x1800, 13.3"
MSI Prestige 13 AI Evo
Ultra 7 155H, Arc 8-Core, Samsung PM9A1 MZVL21T0HCLR, OLED, 2880x1800, 13.3"
Dell XPS 13 9350
Core Ultra 7 256V, Arc 140V, Micron 2550 512GB, IPS, 1920x1200, 13.4"
Framework Laptop 13.5 Core Ultra 7 155H
Ultra 7 155H, Arc 8-Core, , IPS, 2880x1920, 13.5"
Lenovo Yoga Book 9 13IMU9
Ultra 7 155U, Graphics 4-Core, , OLED, 2880x1800, 13.3"
HP Dragonfly G4
i7-1365U, Iris Xe G7 96EUs, Micron 3400 MTFDKBA512TFH 512GB, IPS, 1920x1280, 13.5"
Энергопотребление
-10%
27%
4%
-56%
-5%
В простое, мин. *
3.5
4.5
-29%
1.3
63%
2.5
29%
7.1
-103%
4.1
-17%
В простое, сред. *
5.9
8
-36%
2.5
58%
5.2
12%
9.1
-54%
7.5
-27%
В простое, макс. *
10
8.7
13%
4.1
59%
5.8
42%
18.4
-84%
8.2
18%
Нагрузка, сред. *
38.7
36.1
7%
40.1
-4%
47.5
-23%
51.3
-33%
35.5
8%
Cyberpunk 2077 ultra external monitor *
45.6
43.1
5%
52.4
-15%
Cyberpunk 2077 ultra *
46.3
46.1
-0%
54.5
-18%
Нагрузка, макс. *
61.5
65
-6%
57.3
7%
61.5
-0%
65.5
-7%
66.5
-8%
Witcher 3 ultra *
29.7
41.5
37.5

* ... меньше = лучше

Энергопотребление: Cyberpunk 2077, Стресс-тест

05101520253035404550556065Tooltip
MSI Prestige 13 AI Plus Evo A2VMG Core Ultra 7 258V, Arc 140V; 1280x720 Prime95 28.10 and Furmark 1.25: Ø50.4 (46.6-61.5)
MSI Prestige 13 AI Evo Ultra 7 155H, Arc 8-Core; 1280x720 Prime95 28.10 and Furmark 1.25: Ø43.1 (31.7-65.6)
MSI Prestige 13 AI Plus Evo A2VMG Core Ultra 7 258V, Arc 140V; Idle 150cd/m2: Ø4.06 (3.72-5.73)
MSI Prestige 13 AI Evo Ultra 7 155H, Arc 8-Core; Idle 150cd/m2: Ø6.9 (5.76-9.85)
MSI Prestige 13 AI Plus Evo A2VMG Core Ultra 7 258V, Arc 140V; Cyberpunk 2077 FHD ultra no FSR 150cd: Ø46.3 (44.4-56.6)

Энергопотребление с внешним монитором

05101520253035404550556065Tooltip
MSI Prestige 13 AI Plus Evo A2VMG Core Ultra 7 258V, Arc 140V; Prime95 V2810 Stress (external Monitor): Ø48 (44.2-60.6)
MSI Prestige 13 AI Evo Ultra 7 155H, Arc 8-Core; Prime95 V2810 Stress (external Monitor): Ø40.7 (30.2-65.8)
MSI Prestige 13 AI Plus Evo A2VMG Core Ultra 7 258V, Arc 140V; Cinebench R15 Multi (external Monitor): Ø56.9 (55.7-58.1)
MSI Prestige 13 AI Evo Ultra 7 155H, Arc 8-Core; Cinebench R15 Multi (external Monitor): Ø55.2 (54.2-56.2)
MSI Prestige 13 AI Plus Evo A2VMG Core Ultra 7 258V, Arc 140V; 1280x720 FurMark 1.19 GPU Stress Test (external Monitor): Ø36.6 (33.5-48.5)
MSI Prestige 13 AI Evo Ultra 7 155H, Arc 8-Core; 1280x720 FurMark 1.19 GPU Stress Test (external Monitor): Ø35.8 (34-37.9)
MSI Prestige 13 AI Plus Evo A2VMG Core Ultra 7 258V, Arc 140V; Idle 1min (external Monitor): Ø3.73 (3.4-6.51)
MSI Prestige 13 AI Evo Ultra 7 155H, Arc 8-Core; Idle 1min (external Monitor): Ø5.43 (4.24-7.51)
MSI Prestige 13 AI Plus Evo A2VMG Core Ultra 7 258V, Arc 140V; Cyberpunk 2077 FHD ultra no FSR (external Monitor): Ø45.6 (44.1-48.6)

Автономность

Время работы почти на два часа дольше, чем у конфигурации Core Ultra 7 155H, благодаря более производительному процессору Lunar Lake.

Автономная работа
WiFi Websurfing
13час. 24мин.
MSI Prestige 13 AI Plus Evo A2VMG
Core Ultra 7 258V, Arc 140V, 75 Вт⋅ч
MSI Prestige 13 AI Evo
Ultra 7 155H, Arc 8-Core, 75 Вт⋅ч
Dell XPS 13 9350
Core Ultra 7 256V, Arc 140V, 55 Вт⋅ч
Framework Laptop 13.5 Core Ultra 7 155H
Ultra 7 155H, Arc 8-Core, 61 Вт⋅ч
Lenovo Yoga Book 9 13IMU9
Ultra 7 155U, Graphics 4-Core, 80 Вт⋅ч
HP Dragonfly G4
i7-1365U, Iris Xe G7 96EUs, 68 Вт⋅ч
Время работы
-14%
54%
-22%
-24%
19%
Чтение сайтов по Wi-Fi v.2
804
694
-14%
1236
54%
630
-22%
608
-24%
954
19%
Воспр. видео H.264
1002
Нагрузка и 100% яркости
169
142
90
192
В простое
3407
2296
2550

Общая оценка Notebookcheck

MSI Prestige 13 AI Plus Evo A2VMG - 26 November 2024 v8
Allen Ngo

Корпус
77 / 98 → 78%
Клавиатура
78%
Трекпад
88%
Порты и связь
70 / 74 → 95%
Вес
76 / 20-77 → 97%
Время работы
90%
Дисплей
88%
3D-производительность
56 / 75 → 75%
Производительность ЦП
83 / 92 → 90%
AI Performance
89%
Нагрев
92%
Шумность
80%
Аудио
70 / 91 → 77%
Камера
39 / 75 → 52%
Средний балл
65%
85%
Subnotebook - Итоговый рейтинг
CO2 Emissions
No Data
Materials
50%
Packaging
50%
Power Use
82.4%
Repairability
40%
Software Updates
22.3%
Recycle Logo Total Sustainability Score: 40.8%

Декларация о непредвзятости

Протестированный экземпляр был выдан автору этого материала на короткое время для целей тестирования. Производитель товара или магазин, выдавший нам этот товар на время, не имели никакого влияния на результаты тестирования и не видели текст обзора до его публикации; статья написана не в качестве исполнения любых обязательств перед кем-либо.

This is how Notebookcheck is testing

Every year, Notebookcheck independently reviews hundreds of laptops and smartphones using standardized procedures to ensure that all results are comparable. We have continuously developed our test methods for around 20 years and set industry standards in the process. In our test labs, high-quality measuring equipment is utilized by experienced technicians and editors. These tests involve a multi-stage validation process. Our complex rating system is based on hundreds of well-founded measurements and benchmarks, which maintains objectivity. Further information on our test methods can be found here.

Этот важный материал точно понравится твоим друзьям в социальных сетях!
Mail Logo
'
> Обзоры Ноутбуков, Смартфонов, Планшетов. Тесты и Новости > Обзоры > Обзор ноутбука MSI Prestige 13 AI Plus Evo: Отличная графическая производительность весит менее 1 кг
Allen Ngo, 2024-12- 2 (Update: 2024-12- 2)