Notebookcheck Logo
Teaser

Обзор ноутбука Dell XPS 13 9350: Intel Lunar Lake идеально подходит этой модели

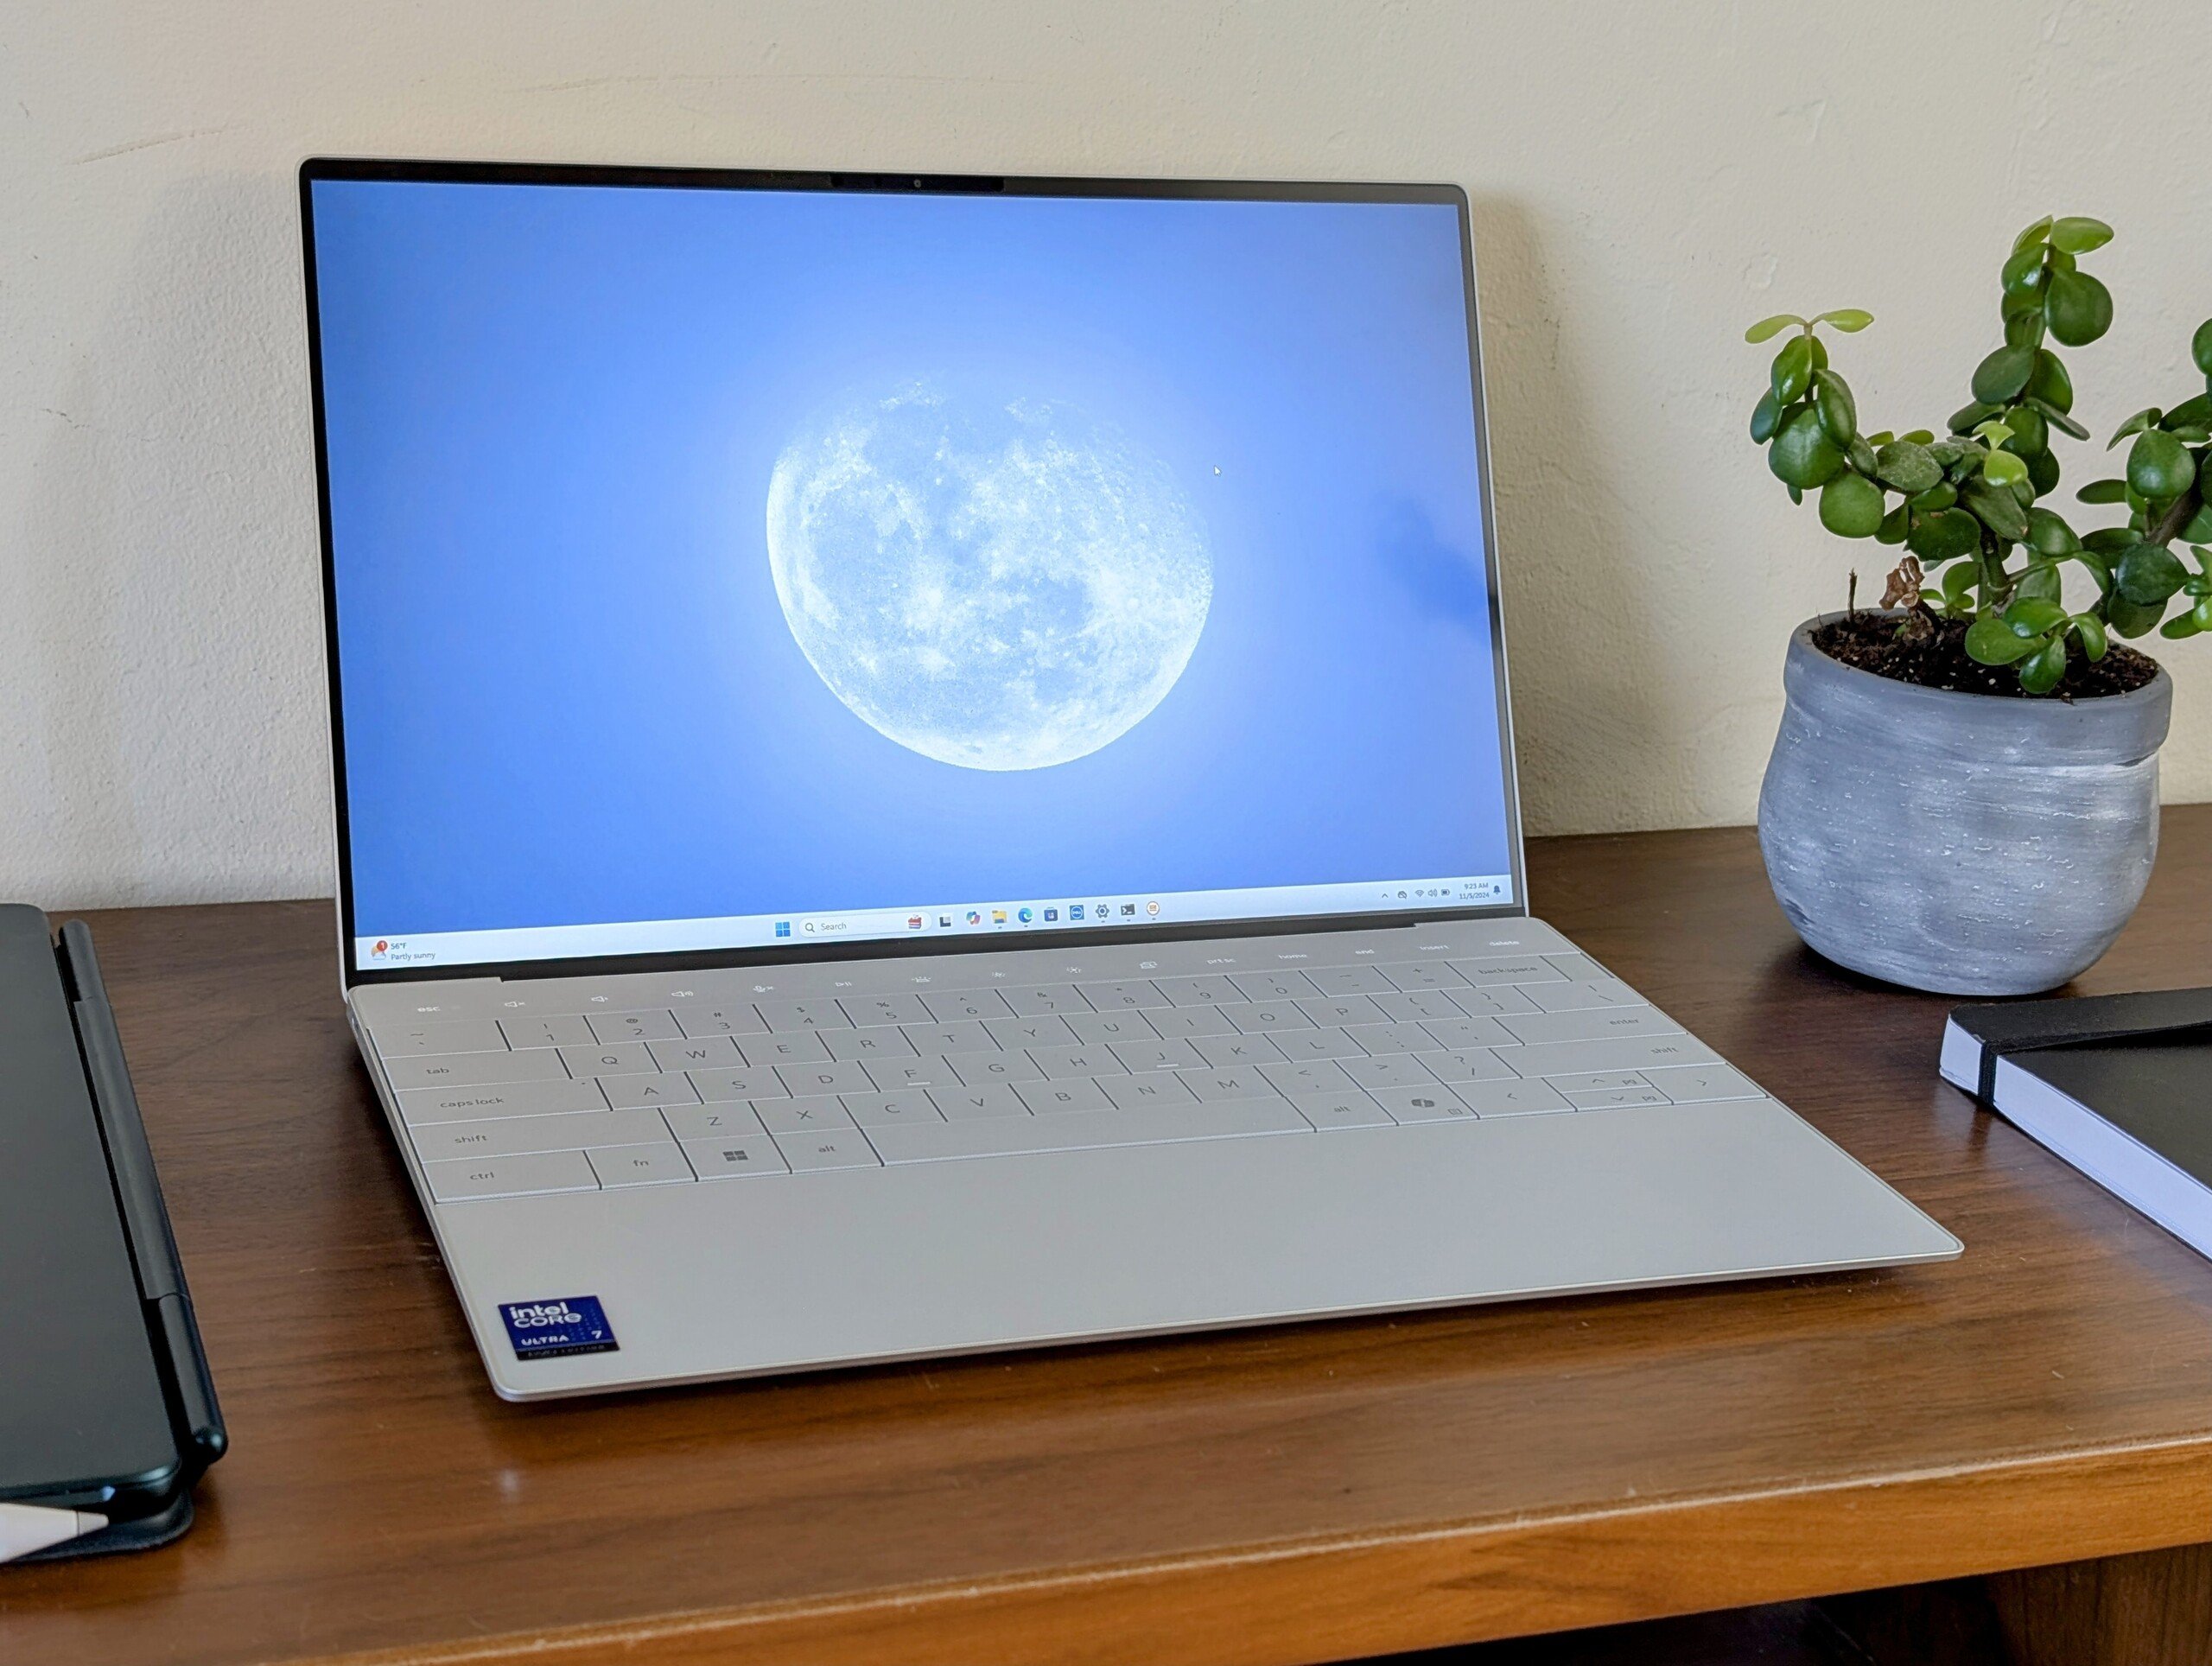
Самый сбалансированный XPS 13 на сегодняшний день.

Новый процессор Intel обеспечивает более стабильную производительность по сравнению с XPS 13 9340, при этом значительно увеличивая время автономной работы и производительность графики. Такие изменения помогли сделать XPS 13 еще более достойным соперником MacBook Air 13.
Allen Ngo, 👁 Allen Ngo (перевод DeepL) Опубликовано 🇺🇸 🇫🇷 ...
Lunar Lake ноутбуки XPS Intel Evo

Вердикт

В обзоре: Dell XPS 13 9350

Что бы Вы ни говорили о дизайне корпуса XPS 13, но новый процессор Lunar Lake определенно превратил систему в нечто с более стабильной производительностью и гораздо большим временем автономной работы. Процессор Core H-серии в XPS 13 9340 оказался слишком тяжелым для тонкого корпуса, и более производительный Core Ultra 7 256V решает эту проблему, одновременно повышая производительность графики. Эти изменения должны принести прямую пользу путешественникам и редакторам, которые смогут воспользоваться более длительным временем работы и более быстрым GPU, чтобы стать гораздо более привлекательной альтернативой MacBook Air 13.

Хорошо (85%) Dell XPS 13 9350 Intel Core Ultra 7 256VIntel Arc Graphics 140V Subnotebook - 05 November 2024 - v8
Тестовый образец выдан нам компанией Dell
Сохранить защищённую авторским правом картинку с итоговым рейтингом в формате PNG / SVG

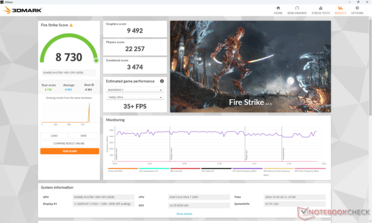
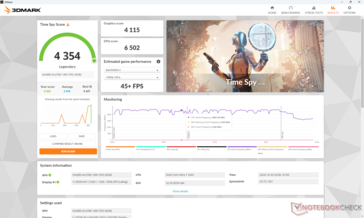
Производительность Turbo Boost немного страдает по сравнению с XPS 13 9340. Однако выигрыш в графической производительности и времени автономной работы от перехода на новую платформу Lunar Lake с лихвой перекрывает недостаток в многопоточной производительности.

За

+ высококачественный IPS-дисплей с частотой 120 Гц и полной цветовой гаммой sRGB
+ хорошая графическая производительность для XPS 13
+ более стабильная работа процессора
+ очень долгое время работы от батареи
+ очень узкие рамки

Против

- более слабая производительность Turbo Boost по сравнению с XPS 13 9340
- 2 МП веб-камера начинает показывать свой возраст
- нет поддержки переменной частоты обновления
- дизайн корпуса, который можно любить или ненавидеть
- нет других опций дисплея

Соперники

Image
Модель
Стоимость от
Вес
Height
Display
1.
85.3%
Dell XPS 13 9350
Dell XPS 13 9350
Intel Core Ultra 7 256V ⎘
Intel Arc Graphics 140V ⎘
16 Гбайт ОЗУ, 512 Гбайт SSD
1.2 килог.15.3 мм13.40"
1920x1200
169 PPI
IPS
2.
87.3% v7 (old)
Dell XPS 13 Plus 9320 i7-1280P OLED
Intel Core i7-1280P ⎘
Intel Iris Xe Graphics G7 96EUs ⎘
16 Гбайт ОЗУ, 512 Гбайт SSD
1.3 килог.15.28 мм13.40"
3456x2160
304 PPI
OLED
3.
90.1% v7 (old)
Lenovo ThinkBook 13x G4 21KR0008GE
Intel Core Ultra 5 125H ⎘
Intel Arc 7-Core iGPU ⎘
16 Гбайт ОЗУ, 512 Гбайт SSD
1.2 килог.12.9 мм13.50"
2880x1920
256 PPI
IPS
4.
91.9% v7 (old)
HP Dragonfly G4
HP Dragonfly G4
Intel Core i7-1365U ⎘
Intel Iris Xe Graphics G7 96EUs ⎘
16 Гбайт ОЗУ, 512 Гбайт SSD
1.1 килог.16.3 мм13.50"
1920x1280
171 PPI
IPS
5.
85.4% v7 (old)
Asus ZenBook S13 OLED UX5304
Intel Core i7-1355U ⎘
Intel Iris Xe Graphics G7 96EUs ⎘
16 Гбайт ОЗУ, 1024 Гбайт SSD
1 килог.11.8 мм13.30"
2880x1800
255 PPI
OLED
6.
86.6% v7 (old)
MSI Prestige 13 AI Evo
Intel Core Ultra 7 155H ⎘
Intel Arc 8-Core iGPU ⎘
32 Гбайт ОЗУ, 1024 Гбайт SSD
967 г16.9 мм13.30"
2880x1800
OLED

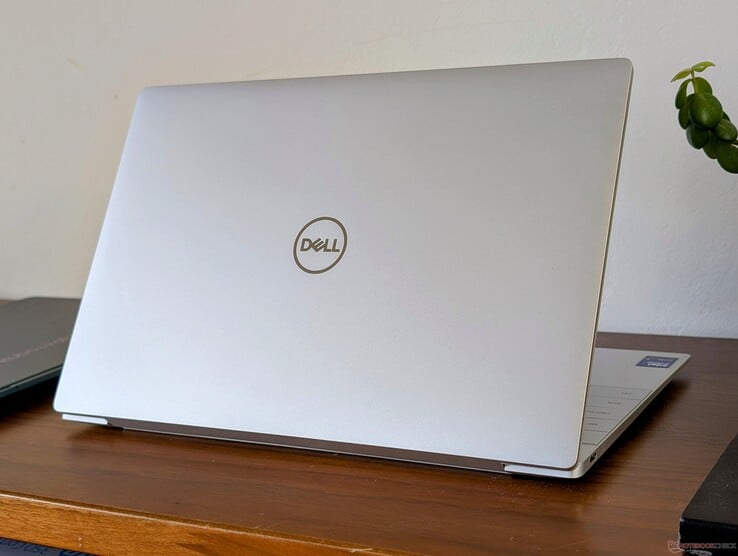
В этом сезоне компания Dell обновила свою линейку XPS 13, оснастив ее процессорами Intel серии Lunar Lake. Называемая XPS 13 9350, она пришла на смену XPS 13 9340 и ее вариантам Meteor Lake-H. В остальном физические характеристики системы идентичны модели 9340, поэтому мы рекомендуем ознакомиться с нашими обзорами XPS 13 9340 и 9320 чтобы узнать больше о корпусе и внешнем дизайне модели.

Наше тестовое устройство оснащено процессором Core Ultra 7 256V, 16 ГБ быстрой оперативной памяти LPDDR5x-8533, 512 ГБ NVMe SSD и 1200p IPS-дисплеем по цене около $1400. На момент написания статьи других конфигураций не было, но планируется выпуск SKU с сенсорным экраном 1800p.

Альтернативой XPS 13 являются другие высококлассные субноутбуки, такие как MSI Prestige 13 AI Evo, Asus ZenBook S13 OLED, HP Dragonfly G4или Apple Серия MacBook Air 13.

Другие обзоры Dell:

Характеристики

Dell XPS 13 9350 (XPS 13 Серия)
Процессор
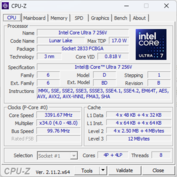
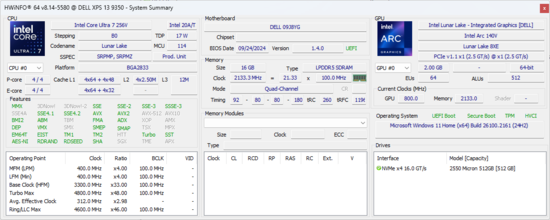
Intel Core Ultra 7 256V 8 x 2.2 - 4.8 GHz, 39 W PL2 / Short Burst, 32 W PL1 / Sustained, Lunar Lake
Графический адаптер
Intel Arc Graphics 140V, Видеопр-р: 1850 МГц, LPDDR5x, 32.0.101.5730
ОЗУ
16 Гбайт 
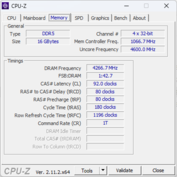
, Dual-Channel, LPDDR5x, 8533 MT/s, Soldered
Дисплей
13.40 дюйм. 16:10, 1920 x 1200 пикс. 169 точек/дюйм, LG Philips 134WU2, IPS, ID: LGD078B, Dell P/N: PF71N, глянцевое покрытие: Нет, 120 Hz
Хранение данных
Micron 2550 512GB, 512 Гбайт 
Звуковая плата
Intel Lunar Lake SOC - cAVS (Audio, Voice, Speech)
Интерфейсы
2 USB 4.0 40 Gbps, 2 Thunderbolt, USB-C Power Delivery (PD), 2 DisplayPort, 1 сканер подушечки пальца, датчик освещённости
Коммуникации
Intel BE201 320MHz (a/b/g/h/n = Wi-Fi 4/ac = Wi-Fi 5/ax = Wi-Fi 6/ Wi-Fi 6E 6 GHz be = Wi-Fi 7), Bluetooth 5.4
Габариты
толщина х ширина х глубина (мм): 15.3 x 295.3 x 199.1
Аккумулятор
55 Вт⋅ч литий-полимерн.
Операционная система
Microsoft Windows 11 Home
Камера
Фронтальная камера: 1080p + IR
осн. камера: 2 МП
Дополнительно
акустическая система: quad speakers, подсветка клавиатуры: ✔, MyDell, 12 мес. гарантии в Европе
Вес
1.21 килогр., адаптер питания: 291 г
Стоимость
1400 USD
Внимание: Разные образцы одной и той же модели часто используют неодинаковые компоненты! (Матрица AUO вместо BOE, память Hynix вместо Samsung, накопитель SATA вместо PCIe, ...)


Дизайн и особенности - Привлекательный универсальный набор

Шасси осталось неизменным по сравнению с первоначальным выпуском XPS 13 9320 в 2022 году. Дизайн с самого начала вызывал споры, так как в нем, похоже, форма превалирует над функциями; такие элементы, как сенсорная панель и безграничный кликпад, могут выглядеть гладкими и изящными, но им не хватает тактильной обратной связи, которую предлагают большинство других ноутбуков.

Дизайн все еще хорошо смотрится на фоне новых конкурентов в плане размера и внешнего вида. Dragonfly G4 и ThinkBook 13x G4например, больше и с более толстыми рамками, несмотря на схожие размеры 13-дюймового экрана.

2x USB-C/ Thunderbolt 4

Сравнение размеров

299 mm 210 mm 16.9 mm 967 g297 mm 220 mm 16.3 mm 1.1 kg295.3 mm 199.1 mm 15.3 mm 1.2 kg295.3 mm 199.04 mm 15.28 mm 1.3 kg296.2 mm 216.3 mm 11.8 mm 1 kg292.9 mm 205 mm 12.9 mm 1.2 kg297 mm 210 mm 1 mm 5.7 g

Сеть

В стандартную комплектацию Intel BE201 входит поддержка Wi-Fi 7 и Bluetooth 5.4. Тем не менее, большинство пользователей будут подключаться к Интернету через Wi-Fi 6 или 6E, поскольку Wi-Fi 7 остается относительно редким явлением в большинстве семей.

Networking
iperf3 transmit AXE11000
Lenovo ThinkBook 13x G4 21KR0008GE
Intel Wi-Fi 6E AX211
1666 (1537min, 1551.79P1 - 1751max) MBit/s +90%
MSI Prestige 13 AI Evo
Intel Killer Wi-Fi 7 BE1750W 320 MHz (BE200NGW)
1609 (1535min, 1544.86P1 - 1649max) MBit/s +84%
Asus ZenBook S13 OLED UX5304
Intel Wi-Fi 6E AX211
1555 (1319min - 1613max) MBit/s +78%
HP Dragonfly G4
Intel Wi-Fi 6E AX211
973 (879min - 1016max) MBit/s +11%
Dell XPS 13 9350
Intel BE201 320MHz
875 (599min - 1034max) MBit/s
iperf3 receive AXE11000
Lenovo ThinkBook 13x G4 21KR0008GE
Intel Wi-Fi 6E AX211
1709 (1689min, 1690.74P1 - 1723max) MBit/s +106%
MSI Prestige 13 AI Evo
Intel Killer Wi-Fi 7 BE1750W 320 MHz (BE200NGW)
1644 (1579min, 1581.03P1 - 1671max) MBit/s +99%
Asus ZenBook S13 OLED UX5304
Intel Wi-Fi 6E AX211
1439 (1353min - 1469max) MBit/s +74%
HP Dragonfly G4
Intel Wi-Fi 6E AX211
1200 (1059min - 1247max) MBit/s +45%
Dell XPS 13 9350
Intel BE201 320MHz
828 (763min - 865max) MBit/s
iperf3 transmit AXE11000 6GHz
HP Dragonfly G4
Intel Wi-Fi 6E AX211
1243 (776min - 1326max) MBit/s +10%
Dell XPS 13 9350
Intel BE201 320MHz
1127 (1037min - 1292max) MBit/s
iperf3 receive AXE11000 6GHz
Dell XPS 13 9350
Intel BE201 320MHz
1620 (1578min - 1652max) MBit/s
HP Dragonfly G4
Intel Wi-Fi 6E AX211
1234 (1042min - 1336max) MBit/s -24%
05010015020025030035040045050055060065070075080085090095010001050110011501200125013001350140014501500155016001650Tooltip
Dell XPS 13 9350; iperf3 transmit AXE11000 6GHz; iperf 3.1.3: Ø1127 (1037-1292)
Dell XPS 13 9350; iperf3 receive AXE11000 6GHz; iperf 3.1.3: Ø1620 (1578-1652)

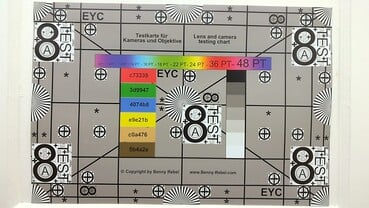
Веб-камера

Веб-камера с разрешением 1080p находится на нижней границе спектра разрешений по сравнению с 5 МП и более, предлагаемыми многими моделями Lenovo и HP. Что еще более раздражает, в системе по-прежнему нет защитной шторки, которая стала обычной особенностью большинства других ноутбуков независимо от цены.
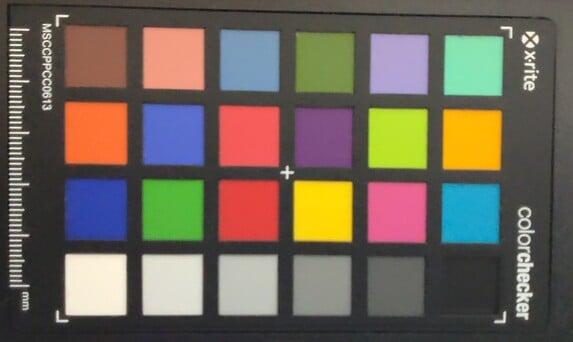
ColorChecker
9.6 ∆E
9.7 ∆E
11.7 ∆E
16.6 ∆E
12.4 ∆E
12.1 ∆E
11.4 ∆E
8.4 ∆E
11.9 ∆E
8.9 ∆E
10.4 ∆E
7.1 ∆E
4.3 ∆E
12.5 ∆E
13 ∆E
5 ∆E
12.7 ∆E
11.3 ∆E
9.5 ∆E
8.4 ∆E
11.4 ∆E
10.3 ∆E
8 ∆E
0.7 ∆E
ColorChecker Dell XPS 13 9350: 9.89 ∆E min: 0.7 - max: 16.58 ∆E

Обслуживание

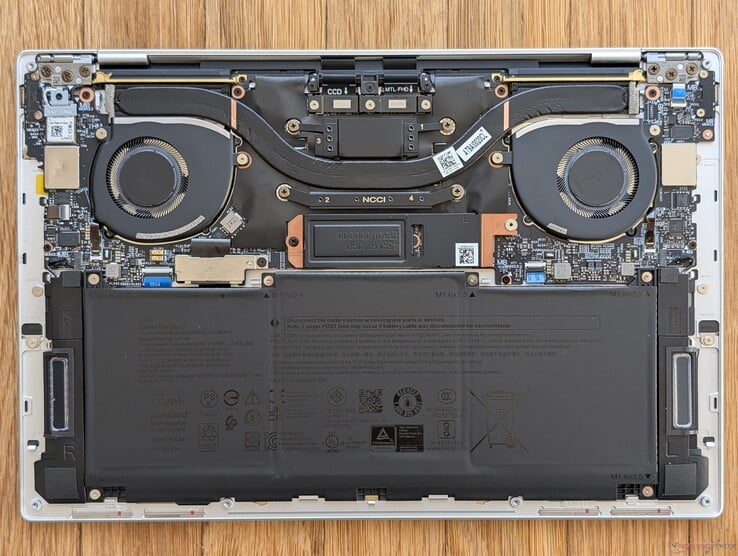
По сравнению с предыдущим поколением XPS 13 9340 или даже с моделью на базе Snapdragon серьезных внутренних изменений не произошло XPS 13 9345. WLAN и оперативная память по-прежнему припаяны, поэтому обновлению подлежит только единственный твердотельный накопитель M.2 2280.

Внутренние компоненты Dell XPS 13 9350

Эффективность

Модель производится с использованием возобновляемых источников энергии, работающих на гидроэлектростанциях, что позволяет сократить выбросы углекислого газа. Dell также утверждает, что система на 100% пригодна для вторичной переработки.

Упаковка состоит из 100% переработанной бумаги и картона, и в ней нет ни капли пластика.

Аксессуары и гарантия

В розничную упаковку входят только документы и адаптер переменного тока без переходника с USB-C на 3,5 мм аудиоразъем. В старых моделях XPS такой переходник был в комплекте, но Dell, возможно, отказывается от него.

При покупке в США действует стандартная годовая ограниченная гарантия.

Дисплей - Солидный IPS

На момент написания статьи единственным доступным вариантом дисплея является наша конфигурация 120 Гц 1200p. Хотя она была доступна и в предыдущих моделях, Dell поменяла поставщика панелей с Sharp на LG Philips. Коэффициент контрастности теперь выше, что помогает сделать цвета более яркими, но все остальное осталось почти таким же, как и раньше, включая полный охват sRGB, частоту обновления и среднее время отклика черно-белого изображения.

Кое-что, что мы хотели бы увидеть в будущих моделях, - это поддержка переменной частоты обновления Windows, или VRR. В настоящее время пользователи могут выбирать только между фиксированной частотой обновления 60 Гц или 120 Гц, в то время как некоторые дисплеи, как, например, в модели Framework Laptop 16 могут динамически изменяться до <60 Гц. Применение этой функции в XPS 13 помогло бы ему еще больше экономить энергию в режиме работы от батареи.

Матовая панель без поддержки сенсорного экрана
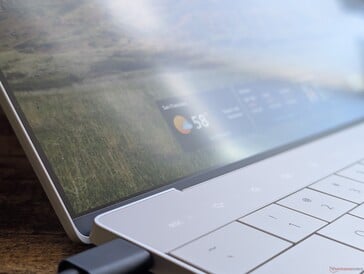
Одни из самых узких ободков среди всех субноутбуков
Дисплей очень четкий для матовой панели; сетка пикселей расположена близко к поверхности экрана, что уменьшает зернистость
Незначительные неравномерные потеки подсветки по верхним углам
428
cd/m²
440.5
cd/m²
446.5
cd/m²
422.9
cd/m²
462.8
cd/m²
458.4
cd/m²
402.5
cd/m²
418
cd/m²
436.3
cd/m²
Равномерность подсветки экрана
LG Philips 134WU2 замерено через: X-Rite i1Pro 2
Максимум: 462.8 cd/m² (Nits) В среднем: 435.1 cd/m² Minimum: 22.3 cd/m²
Равномерность подсветки: 87 %
От батареи: 462.8 cd/m²
Контрастность: 2436:1 (Уровень чёрного: 0.19 cd/m²)
ΔE Color 1.92 | 0.5-29.43 Ø4.91, calibrated: 0.48
ΔE Greyscale 0.6 | 0.5-98 Ø5.2
68.6% AdobeRGB 1998 (Argyll 2.2.0 3D)
99% sRGB (Argyll 2.2.0 3D)
67.3% Display P3 (Argyll 2.2.0 3D)
Gamma: 2.19
Dell XPS 13 9350
LG Philips 134WU2, IPS, 1920x1200, 13.4", 120 Hz
Dell XPS 13 Plus 9320 i7-1280P OLED
Samsung 134XK04, OLED, 3456x2160, 13.4", 60 Hz
Lenovo ThinkBook 13x G4 21KR0008GE
LEN135WQ+, IPS, 2880x1920, 13.5", 120 Hz
HP Dragonfly G4
Chi Mei CMN13C0, IPS, 1920x1280, 13.5", 60 Hz
Asus ZenBook S13 OLED UX5304
SDC417B, OLED, 2880x1800, 13.3", 60 Hz
MSI Prestige 13 AI Evo
ATNA33AA07-0, OLED, 2880x1800, 13.3", 60 Hz
Display
31%
-2%
1%
30%
31%
Display P3 Coverage
67.3
99.5
48%
65.5
-3%
68.4
2%
99.7
48%
99.9
48%
sRGB Coverage
99
100
1%
97.3
-2%
98.3
-1%
100
1%
100
1%
AdobeRGB 1998 Coverage
68.6
98.4
43%
67.7
-1%
70.4
3%
96.9
41%
97.8
43%
Response Times
93%
39%
-26%
95%
95%
Response Time Grey 50% / Grey 80% *
37.3 ?(17, 20.3)
2.6 ?(1.3, 1.3)
93%
27.3 ?(12.8, 14.5)
27%
48.8 ?(22.9, 25.9)
-31%
2 ?(1.1, 0.9)
95%
1.54 ?(0.79, 0.75)
96%
Response Time Black / White *
25.9 ?(12.5, 13.4)
2.1 ?(0.8, 1.3)
92%
12.8 ?(4.4, 8.4)
51%
31.3 ?(16.3, 15)
-21%
1.6 ?(0.8, 0.8)
94%
1.44 ?(0.73, 0.71)
94%
PWM Frequency
59.5
240 ?(57, 88)
240 ?(42)
Параметры экрана
-59%
-44%
-51%
-7%
-23%
Яркость в центре
462.8
371.8
-20%
539
16%
408.8
-12%
361
-22%
404
-13%
Brightness
435
374
-14%
513
18%
399
-8%
365
-16%
407
-6%
Brightness Distribution
87
98
13%
89
2%
90
3%
98
13%
98
13%
Уровень чёрного *
0.19
0.38
-100%
0.32
-68%
Контрастность
2436
1418
-42%
1278
-48%
Colorchecker Delta E *
1.92
2.37
-23%
1.4
27%
2.02
-5%
1.2
37%
2.1
-9%
Colorchecker dE 2000 max. *
3.45
6.1
-77%
3.5
-1%
3.84
-11%
1.9
45%
4.3
-25%
Colorchecker dE 2000 calibrated *
0.48
0.7
-46%
0.61
-27%
Delta E для серого *
0.6
2
-233%
2.2
-267%
2.3
-283%
1.2
-100%
1.2
-100%
Гамма
2.19 100%
2.29 96%
2.19 100%
2.2 100%
2.27 97%
2.16 102%
CCT
6539 99%
6261 104%
6710 97%
6203 105%
6486 100%
6465 101%
Среднее значение
22% / -7%
-2% / -23%
-25% / -36%
39% / 21%
34% / 13%

* ... меньше = лучше

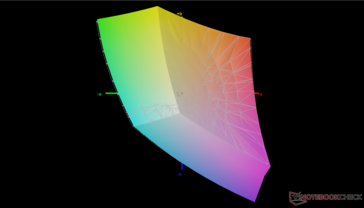
Охват sRGB
Охват sRGB
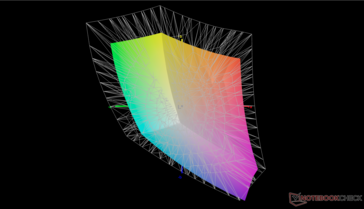
Охват P3
Охват P3

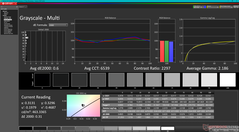
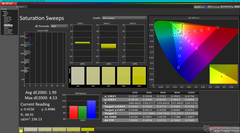
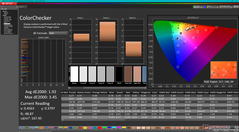
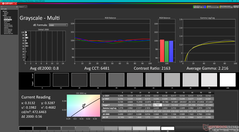
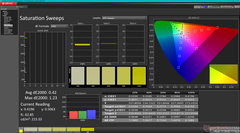
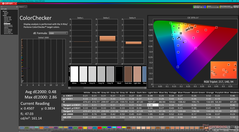
Дисплей поставляется предварительно откалиброванным из коробки со средними значениями дельтаЕ для оттенков серого и цветов, составляющими всего 0,6 и 1,92, соответственно. Если быть придирчивым, то цвета могли бы быть более точными на более высоких уровнях насыщенности, где DeltaE для некоторых цветов может достигать 3 или 4, как показано на наших скриншотах ниже. Самостоятельная калибровка панели с помощью колориметра X-Rite позволила бы устранить этот небольшой недостаток, но для большинства пользователей калибровка в данном случае не требуется.

Градации серого до калибровки
Насыщенные звуковые сигналы перед калибровкой
ColorChecker перед калибровкой
Градации серого после калибровки
Насыщенные звуковые сигналы после калибровки
ColorChecker после калибровки

Дисплей: тест на время отклика

Время отклика показывает, как быстро дисплей устройства способен сменить цвет изображения с одного на другой. Недостаточно быстрый отклик может привести к деформации подвижных фрагментов изображения, появлении теней и размытости. Отсутствие таких проблем особенно важно для просмотра фильмов и для игр.
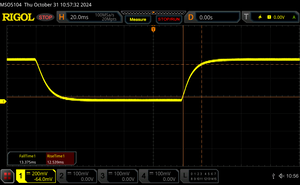
       Перемена цвета пикселей, чёрный - белый (1) и белый - чёрный (2)
25.9 ms ... стадия 1 ↗ и стадия 2 ↘ в сумме↗ 12.5 ms стадия 1
↘ 13.4 ms стадия 2
Это довольно большое время отклика. Экран явно не ориентирован на игры и подобные применения.
Для сравнения, самый лучший результат среди всех известных нам устройств равен 0.1 миллисек., самый худший - 240 миллисек. » 59% экранов из нашей базы данных показали более хороший результат.
Таким образом, тестируемое устройство находится в нижней половине рейтинга (оно отстаёт от среднего результата, равного 20.9 миллисек.)
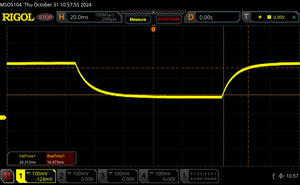
       Перемена цвета пикселей, серый 50% - серый 80% (1) и серый 80% - серый 50% (2)
37.3 ms ... стадия 1 ↗ и стадия 2 ↘ в сумме↗ 17 ms стадия 1
↘ 20.3 ms стадия 2
Это очень большое время отклика. Экран явно не ориентирован на игры и подобные применения.
Для сравнения, самый лучший результат среди всех известных нам устройств равен 0.165 миллисек., самый худший - 636 миллисек. » 50% экранов из нашей базы данных показали более хороший результат.
Таким образом, тестируемое устройство находится в нижней половине рейтинга (оно отстаёт от среднего результата, равного 32.8 миллисек.)

Тест на мерцание

Некоторые устройства устанавливают яркость экрана при помощи быстрого включения-выключения светодиодов вместо простого понижения напряжения их питания. Такой метод обозначается аббревиатурой ШИМ (или PWM). Он часто приводит к полоскам или ряби на изображении, а также к быстрой усталости глаз и головной боли. Мы проверяем, используется ли PWM в тестируемом устройстве, и если да, то при каких условиях.
Ура! ШИМ не обнаружено

Для сравнения, 53 % известных нам устройств не применяют PWM для изменения яркости, а среди тех, где PWM используется, типичная частота модуляции составляет 8715 Гц (мин. 5 Гц, макс. 343500 Гц).

Видимость на улице неплохая, но все же немного хуже, чем у MacBook Air 13 которая может достигать чуть более 500 нит по сравнению с ~435 нит у нашего Dell. Блики на нашей матовой панели отвлекают гораздо меньше, чем на OLED, но цвета все равно будут выглядеть размытыми при работе в ярких условиях.

На открытом воздухе под солнечными лучами
На открытом воздухе в тени
На открытом воздухе под солнечными лучами
Широкие углы обзора IPS

Производительность - Стабильнее и надежнее


Условия тестирования

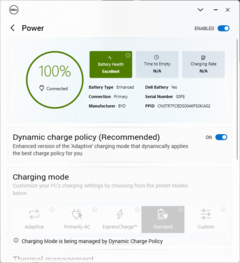
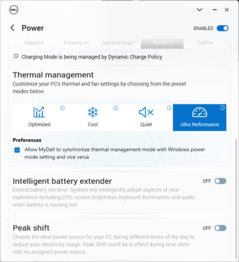
Мы перевели ноутбук MyDell в режим ультрапроизводительности перед тем, как запустить приведенные ниже бенчмарки. Настройки питания MyDell удобно синхронизируются с настройками питания Windows, в отличие от большинства других ноутбуков. Это позволяет избежать неловких ситуаций, когда Windows может быть установлена в режим энергосбережения, в то время как настройки питания производителя установлены в режим производительности

Главный экран MyDell
Меню настроек питания показывает поведение заряда
Настройки профиля питания Dell

Процессор

Производительность процессора интересна, особенно если сравнивать с XPS 13 9340 и его Core Ultra 7 155H. Наш Core Ultra 7 256V работает медленнее, как и ожидалось, на 20-30% в большинстве многопоточных бенчмарков, поскольку его потенциал Turbo Boost и количество ядер меньше, чем у Core Ultra 7 155H. Тем не менее, наш Core Ultra 7 256V также дросселируется значительно меньше, чем Core Ultra 7 155H в XPS 9340. После учета дросселирования многопоточная производительность XPS 13 9340 и 9350 становится практически одинаковой, как показывают результаты нашего циклического теста CineBench R15 xT, представленные ниже.

Стоит отметить, что потребуется не менее дюжины запусков CineBench R15 xT, прежде чем Core Ultra 7 155H снизит дросселирование и станет более похожим на наш Core Ultra 7 256V. Таким образом, преимущество Meteor Lake-H в производительности остается значительным в краткосрочной и среднесрочной перспективе.

Многопоточный тест Cinebench R15

011523034546057569080592010351150126513801495161017251840195520702185Tooltip
Dell XPS 13 9350 Intel Core Ultra 7 256V: Ø1415 (1369.16-1569.86)
Dell XPS 13 Plus 9320 i7-1280P OLED Intel Core i7-1280P: Ø1467 (1369.16-1905.49)
Lenovo ThinkBook 13x G4 21KR0008GE Intel Core Ultra 5 125H: Ø1373 (1247-1702.49)
HP Dragonfly G4 Intel Core i7-1365U: Ø1060 (1014.74-1347.89)
Asus ZenBook S13 OLED UX5304 Intel Core i7-1355U: Ø1024 (989.63-1358.19)
MSI Prestige 13 AI Evo Intel Core Ultra 7 155H: Ø1302 (1245.56-2032.83)
Dell XPS 13 9340 Core Ultra 7 Intel Core Ultra 7 155H: Ø1635 (1358.56-2230.28)
CPU Performance Rating: Percent
Cinebench R23: Multi Core | Single Core
Cinebench R20: CPU (Multi Core) | CPU (Single Core)
Cinebench R15: CPU Multi 64Bit | CPU Single 64Bit
Blender: v2.79 BMW27 CPU
7-Zip 18.03: 7z b 4 | 7z b 4 -mmt1
Geekbench 6.3: Multi-Core | Single-Core
Geekbench 5.5: Multi-Core | Single-Core
HWBOT x265 Benchmark v2.2: 4k Preset
LibreOffice : 20 Documents To PDF
R Benchmark 2.5: Overall mean
CPU Performance Rating
Framework Laptop 13.5 Ryzen 7 7840U
AMD Ryzen 7 7840U
82.1 pt
HP EliteBook x360 1040 G11
Intel Core Ultra 7 165H
81.3 pt
Dell XPS 13 9340 Core Ultra 7
Intel Core Ultra 7 155H
79 pt
Dell XPS 13 Plus 9320 Core i7-1360P -2!
Intel Core i7-1360P
73.4 pt
Dell XPS 13 9350
Intel Core Ultra 7 256V
72.3 pt
Усредн. модель с Intel Core Ultra 7 256V
 
72.3 pt
Dell XPS 13 Plus 9320 i7-1280P OLED -2!
Intel Core i7-1280P
70.6 pt
MSI Prestige 13 AI Evo
Intel Core Ultra 7 155H
69.6 pt
Asus Zenbook S 14 UX5406
Intel Core Ultra 7 258V
66.3 pt
Dell XPS 13 Plus 9320 4K -2!
Intel Core i7-1260P
66.3 pt
Lenovo ThinkBook 13x G4 21KR0008GE -1!
Intel Core Ultra 5 125H
66.1 pt
Asus Zenbook S 13 OLED -2!
AMD Ryzen 7 6800U
62.9 pt
HP Dragonfly G4 -2!
Intel Core i7-1365U
61.8 pt
Asus ZenBook S13 OLED UX5304 -2!
Intel Core i7-1355U
58.1 pt
Dell XPS 13 Plus 9320 i5-1240p -2!
Intel Core i5-1240P
56.6 pt
Lenovo ThinkBook 13s G3 20YA0005GE -2!
AMD Ryzen 7 5800U
56.2 pt
Lenovo Yoga 6 13 83B2001SGE -2!
AMD Ryzen 7 7730U
55.2 pt
Dell XPS 13 9315 2-in-1 Core i5-1230U -2!
Intel Core i5-1230U
51.8 pt
Dell XPS 13 9315, i5-1230U -6!
Intel Core i5-1230U
51 pt
Cinebench R23 / Multi Core
HP EliteBook x360 1040 G11
Intel Core Ultra 7 165H
14551 (13047.9min - 14551max) Points +40%
Framework Laptop 13.5 Ryzen 7 7840U
AMD Ryzen 7 7840U
13981 (12822.5min - 13981.2max) Points +35%
Dell XPS 13 9340 Core Ultra 7
Intel Core Ultra 7 155H
13511 Points +30%
Dell XPS 13 Plus 9320 i7-1280P OLED
Intel Core i7-1280P
11852 (9209.64min - 11852max) Points +14%
Dell XPS 13 Plus 9320 Core i7-1360P
Intel Core i7-1360P
11503 (9427.43min - 11502.9max) Points +11%
Усредн. модель с Intel Core Ultra 7 256V
  (10391 - 10768, n=2)
10580 Points +2%
Asus Zenbook S 13 OLED
AMD Ryzen 7 6800U
10468 Points +1%
Dell XPS 13 9350
Intel Core Ultra 7 256V
10391 (9371.44min - 10390.8max) Points
MSI Prestige 13 AI Evo
Intel Core Ultra 7 155H
9769 Points -6%
Dell XPS 13 Plus 9320 4K
Intel Core i7-1260P
9743 Points -6%
Dell XPS 13 Plus 9320 i5-1240p
Intel Core i5-1240P
9392 Points -10%
Lenovo ThinkBook 13x G4 21KR0008GE
Intel Core Ultra 5 125H
9194 Points -12%
Asus Zenbook S 14 UX5406
Intel Core Ultra 7 258V
9114 Points -12%
Lenovo ThinkBook 13s G3 20YA0005GE
AMD Ryzen 7 5800U
8068 Points -22%
HP Dragonfly G4
Intel Core i7-1365U
7532 (5307.67min - 7531.78max) Points -28%
Lenovo Yoga 6 13 83B2001SGE
AMD Ryzen 7 7730U
7286 Points -30%
Dell XPS 13 9315 2-in-1 Core i5-1230U
Intel Core i5-1230U
7264 (4444.94min - 7264.12max) Points -30%
Asus ZenBook S13 OLED UX5304
Intel Core i7-1355U
7015 Points -32%
Dell XPS 13 9315, i5-1230U
Intel Core i5-1230U
4402 Points -58%
Cinebench R23 / Single Core
HP Dragonfly G4
Intel Core i7-1365U
1891 Points +1%
Усредн. модель с Intel Core Ultra 7 256V
  (1875 - 1902, n=2)
1889 Points +1%
Dell XPS 13 9350
Intel Core Ultra 7 256V
1875 Points
Asus Zenbook S 14 UX5406
Intel Core Ultra 7 258V
1865 Points -1%
Dell XPS 13 Plus 9320 Core i7-1360P
Intel Core i7-1360P
1848 Points -1%
HP EliteBook x360 1040 G11
Intel Core Ultra 7 165H
1759 Points -6%
Asus ZenBook S13 OLED UX5304
Intel Core i7-1355U
1730 Points -8%
Dell XPS 13 9340 Core Ultra 7
Intel Core Ultra 7 155H
1685 Points -10%
Dell XPS 13 Plus 9320 4K
Intel Core i7-1260P
1678 Points -11%
MSI Prestige 13 AI Evo
Intel Core Ultra 7 155H
1671 Points -11%
Framework Laptop 13.5 Ryzen 7 7840U
AMD Ryzen 7 7840U
1647 Points -12%
Dell XPS 13 Plus 9320 i5-1240p
Intel Core i5-1240P
1621 Points -14%
Dell XPS 13 Plus 9320 i7-1280P OLED
Intel Core i7-1280P
1615 Points -14%
Lenovo ThinkBook 13x G4 21KR0008GE
Intel Core Ultra 5 125H
1549 Points -17%
Dell XPS 13 9315 2-in-1 Core i5-1230U
Intel Core i5-1230U
1512 Points -19%
Asus Zenbook S 13 OLED
AMD Ryzen 7 6800U
1488 Points -21%
Lenovo ThinkBook 13s G3 20YA0005GE
AMD Ryzen 7 5800U
1430 Points -24%
Lenovo Yoga 6 13 83B2001SGE
AMD Ryzen 7 7730U
1335 Points -29%
Dell XPS 13 9315, i5-1230U
Intel Core i5-1230U
1310 Points -30%
Cinebench R20 / CPU (Multi Core)
HP EliteBook x360 1040 G11
Intel Core Ultra 7 165H
5545 Points +37%
Framework Laptop 13.5 Ryzen 7 7840U
AMD Ryzen 7 7840U
5425 Points +34%
Dell XPS 13 9340 Core Ultra 7
Intel Core Ultra 7 155H
5181 Points +28%
Dell XPS 13 Plus 9320 i7-1280P OLED
Intel Core i7-1280P
4571 Points +13%
Dell XPS 13 Plus 9320 Core i7-1360P
Intel Core i7-1360P
4424 Points +10%
Усредн. модель с Intel Core Ultra 7 256V
  (4038 - 4162, n=2)
4100 Points +2%
Asus Zenbook S 13 OLED
AMD Ryzen 7 6800U
4060 Points +1%
Dell XPS 13 9350
Intel Core Ultra 7 256V
4038 Points
Dell XPS 13 Plus 9320 4K
Intel Core i7-1260P
3909 Points -3%
MSI Prestige 13 AI Evo
Intel Core Ultra 7 155H
3798 Points -6%
Lenovo ThinkBook 13x G4 21KR0008GE
Intel Core Ultra 5 125H
3673 Points -9%
Asus Zenbook S 14 UX5406
Intel Core Ultra 7 258V
3530 Points -13%
Dell XPS 13 Plus 9320 i5-1240p
Intel Core i5-1240P
3424 Points -15%
Lenovo ThinkBook 13s G3 20YA0005GE
AMD Ryzen 7 5800U
2995 Points -26%
HP Dragonfly G4
Intel Core i7-1365U
2902 Points -28%
Lenovo Yoga 6 13 83B2001SGE
AMD Ryzen 7 7730U
2849 Points -29%
Asus ZenBook S13 OLED UX5304
Intel Core i7-1355U
2849 Points -29%
Dell XPS 13 9315 2-in-1 Core i5-1230U
Intel Core i5-1230U
2802 Points -31%
Dell XPS 13 9315, i5-1230U
Intel Core i5-1230U
1653 Points -59%
Cinebench R20 / CPU (Single Core)
Усредн. модель с Intel Core Ultra 7 256V
  (720 - 727, n=2)
724 Points +1%
Dell XPS 13 9350
Intel Core Ultra 7 256V
720 Points
Dell XPS 13 Plus 9320 Core i7-1360P
Intel Core i7-1360P
707 Points -2%
HP Dragonfly G4
Intel Core i7-1365U
703 Points -2%
HP EliteBook x360 1040 G11
Intel Core Ultra 7 165H
683 Points -5%
Asus ZenBook S13 OLED UX5304
Intel Core i7-1355U
679 Points -6%
Dell XPS 13 9340 Core Ultra 7
Intel Core Ultra 7 155H
656 Points -9%
Lenovo ThinkBook 13x G4 21KR0008GE
Intel Core Ultra 5 125H
655 Points -9%
Framework Laptop 13.5 Ryzen 7 7840U
AMD Ryzen 7 7840U
651 Points -10%
Dell XPS 13 Plus 9320 4K
Intel Core i7-1260P
648 Points -10%
Asus Zenbook S 14 UX5406
Intel Core Ultra 7 258V
643 Points -11%
MSI Prestige 13 AI Evo
Intel Core Ultra 7 155H
632 Points -12%
Dell XPS 13 Plus 9320 i7-1280P OLED
Intel Core i7-1280P
622 Points -14%
Dell XPS 13 Plus 9320 i5-1240p
Intel Core i5-1240P
616 Points -14%
Dell XPS 13 9315 2-in-1 Core i5-1230U
Intel Core i5-1230U
580 Points -19%
Asus Zenbook S 13 OLED
AMD Ryzen 7 6800U
564 Points -22%
Lenovo ThinkBook 13s G3 20YA0005GE
AMD Ryzen 7 5800U
560 Points -22%
Lenovo Yoga 6 13 83B2001SGE
AMD Ryzen 7 7730U
533 Points -26%
Dell XPS 13 9315, i5-1230U
Intel Core i5-1230U
469 Points -35%
Cinebench R15 / CPU Multi 64Bit
HP EliteBook x360 1040 G11
Intel Core Ultra 7 165H
2467 (1713.06min - 2466.7max) Points +57%
Dell XPS 13 9340 Core Ultra 7
Intel Core Ultra 7 155H
2230 (1358.56min - 2230.28max) Points +42%
Framework Laptop 13.5 Ryzen 7 7840U
AMD Ryzen 7 7840U
2205 (2124.16min - 2204.83max) Points +40%
MSI Prestige 13 AI Evo
Intel Core Ultra 7 155H
2033 (1245.56min - 2032.83max) Points +29%
Dell XPS 13 Plus 9320 Core i7-1360P
Intel Core i7-1360P
1951 (1397.72min - 1950.55max) Points +24%
Lenovo ThinkBook 13s G3 20YA0005GE
AMD Ryzen 7 5800U
1925 Points +23%
Lenovo ThinkBook 13s G3 20YA0005GE
AMD Ryzen 7 5800U
1691 Points +8%
Dell XPS 13 Plus 9320 i7-1280P OLED
Intel Core i7-1280P
1905 (1369.16min - 1905.49max) Points +21%
Asus Zenbook S 13 OLED
AMD Ryzen 7 6800U
1742 Points +11%
Lenovo ThinkBook 13x G4 21KR0008GE
Intel Core Ultra 5 125H
1702 (1247min - 1702.49max) Points +8%
Dell XPS 13 Plus 9320 4K
Intel Core i7-1260P
1677 (1481.98min - 1677.36max) Points +7%
Dell XPS 13 Plus 9320 4K
Intel Core i7-1260P
1626 (983.94min - 1625.95max) Points +4%
Dell XPS 13 Plus 9320 i5-1240p
Intel Core i5-1240P
1592 Points +1%
Lenovo Yoga 6 13 83B2001SGE
AMD Ryzen 7 7730U
1588 (1265.06min - 1588.12max) Points +1%
Dell XPS 13 9350
Intel Core Ultra 7 256V
1570 (1369.16min - 1569.86max) Points
Усредн. модель с Intel Core Ultra 7 256V
  ()
1570 Points 0%
Asus Zenbook S 14 UX5406
Intel Core Ultra 7 258V
1550 (1108.49min - 1550.27max) Points -1%
Asus ZenBook S13 OLED UX5304
Intel Core i7-1355U
1358 (989.63min - 1358.19max) Points -14%
HP Dragonfly G4
Intel Core i7-1365U
1348 (1014.74min - 1347.89max) Points -14%
Dell XPS 13 9315 2-in-1 Core i5-1230U
Intel Core i5-1230U
1254 (632min - 1254.35max) Points -20%
Dell XPS 13 9315, i5-1230U
Intel Core i5-1230U
514 (482min - 513.59max) Points -67%
Cinebench R15 / CPU Single 64Bit
Dell XPS 13 9350
Intel Core Ultra 7 256V
285 Points
Усредн. модель с Intel Core Ultra 7 256V
  ()
285 Points 0%
Dell XPS 13 Plus 9320 Core i7-1360P
Intel Core i7-1360P
263 Points -8%
HP Dragonfly G4
Intel Core i7-1365U
261 Points -8%
Asus Zenbook S 14 UX5406
Intel Core Ultra 7 258V
258 Points -9%
HP EliteBook x360 1040 G11
Intel Core Ultra 7 165H
257 Points -10%
Dell XPS 13 9340 Core Ultra 7
Intel Core Ultra 7 155H
253 Points -11%
Framework Laptop 13.5 Ryzen 7 7840U
AMD Ryzen 7 7840U
249 Points -13%
Lenovo ThinkBook 13x G4 21KR0008GE
Intel Core Ultra 5 125H
247 Points -13%
Asus ZenBook S13 OLED UX5304
Intel Core i7-1355U
245 Points -14%
MSI Prestige 13 AI Evo
Intel Core Ultra 7 155H
242 Points -15%
Dell XPS 13 Plus 9320 4K
Intel Core i7-1260P
240 Points -16%
Asus Zenbook S 13 OLED
AMD Ryzen 7 6800U
237 Points -17%
Lenovo ThinkBook 13s G3 20YA0005GE
AMD Ryzen 7 5800U
229 Points -20%
Dell XPS 13 Plus 9320 i7-1280P OLED
Intel Core i7-1280P
229 Points -20%
Dell XPS 13 Plus 9320 i5-1240p
Intel Core i5-1240P
226 Points -21%
Dell XPS 13 9315 2-in-1 Core i5-1230U
Intel Core i5-1230U
221 Points -22%
Lenovo Yoga 6 13 83B2001SGE
AMD Ryzen 7 7730U
221 Points -22%
Dell XPS 13 9315, i5-1230U
Intel Core i5-1230U
186.8 Points -34%
Blender / v2.79 BMW27 CPU
Dell XPS 13 9315 2-in-1 Core i5-1230U
Intel Core i5-1230U
503 Seconds * -48%
Asus ZenBook S13 OLED UX5304
Intel Core i7-1355U
450 Seconds * -33%
Asus ZenBook S13 OLED UX5304
Intel Core i7-1355U
448 Seconds * -32%
HP Dragonfly G4
Intel Core i7-1365U
430 Seconds * -27%
Asus Zenbook S 14 UX5406
Intel Core Ultra 7 258V
414 Seconds * -22%
Lenovo ThinkBook 13s G3 20YA0005GE
AMD Ryzen 7 5800U
391 Seconds * -15%
Lenovo Yoga 6 13 83B2001SGE
AMD Ryzen 7 7730U
374 Seconds * -10%
Dell XPS 13 Plus 9320 i5-1240p
Intel Core i5-1240P
369 Seconds * -9%
Lenovo ThinkBook 13x G4 21KR0008GE
Intel Core Ultra 5 125H
357 Seconds * -5%
MSI Prestige 13 AI Evo
Intel Core Ultra 7 155H
349 Seconds * -3%
Dell XPS 13 9350
Intel Core Ultra 7 256V
339 Seconds *
Усредн. модель с Intel Core Ultra 7 256V
  (324 - 339, n=2)
332 Seconds * +2%
Dell XPS 13 Plus 9320 4K
Intel Core i7-1260P
319 Seconds * +6%
Asus Zenbook S 13 OLED
AMD Ryzen 7 6800U
310 Seconds * +9%
Dell XPS 13 Plus 9320 Core i7-1360P
Intel Core i7-1360P
279 Seconds * +18%
Dell XPS 13 Plus 9320 i7-1280P OLED
Intel Core i7-1280P
268 Seconds * +21%
Dell XPS 13 9340 Core Ultra 7
Intel Core Ultra 7 155H
243 Seconds * +28%
HP EliteBook x360 1040 G11
Intel Core Ultra 7 165H
231 Seconds * +32%
Framework Laptop 13.5 Ryzen 7 7840U
AMD Ryzen 7 7840U
230 Seconds * +32%
7-Zip 18.03 / 7z b 4
Framework Laptop 13.5 Ryzen 7 7840U
AMD Ryzen 7 7840U
61902 MIPS +72%
Dell XPS 13 9340 Core Ultra 7
Intel Core Ultra 7 155H
58233 MIPS +62%
HP EliteBook x360 1040 G11
Intel Core Ultra 7 165H
56997 MIPS +59%
Dell XPS 13 Plus 9320 i7-1280P OLED
Intel Core i7-1280P
49572 MIPS +38%
Dell XPS 13 Plus 9320 Core i7-1360P
Intel Core i7-1360P
47737 MIPS +33%
Asus Zenbook S 13 OLED
AMD Ryzen 7 6800U
47500 MIPS +32%
Dell XPS 13 Plus 9320 4K
Intel Core i7-1260P
43056 MIPS +20%
MSI Prestige 13 AI Evo
Intel Core Ultra 7 155H
42601 MIPS +19%
Dell XPS 13 Plus 9320 i5-1240p
Intel Core i5-1240P
40777 MIPS +13%
Lenovo Yoga 6 13 83B2001SGE
AMD Ryzen 7 7730U
40263 MIPS +12%
Lenovo ThinkBook 13s G3 20YA0005GE
AMD Ryzen 7 5800U
39618 MIPS +10%
Усредн. модель с Intel Core Ultra 7 256V
  (35950 - 35978, n=2)
35964 MIPS 0%
Dell XPS 13 9350
Intel Core Ultra 7 256V
35950 MIPS
Dell XPS 13 9315 2-in-1 Core i5-1230U
Intel Core i5-1230U
34505 MIPS -4%
HP Dragonfly G4
Intel Core i7-1365U
33476 MIPS -7%
Asus Zenbook S 14 UX5406
Intel Core Ultra 7 258V
32198 MIPS -10%
Asus ZenBook S13 OLED UX5304
Intel Core i7-1355U
31233 MIPS -13%
Dell XPS 13 9315, i5-1230U
Intel Core i5-1230U
20092 MIPS -44%
7-Zip 18.03 / 7z b 4 -mmt1
Framework Laptop 13.5 Ryzen 7 7840U
AMD Ryzen 7 7840U
6408 MIPS +12%
HP Dragonfly G4
Intel Core i7-1365U
5835 MIPS +2%
Dell XPS 13 9350
Intel Core Ultra 7 256V
5727 MIPS
Asus ZenBook S13 OLED UX5304
Intel Core i7-1355U
5689 MIPS -1%
Усредн. модель с Intel Core Ultra 7 256V
  (5616 - 5727, n=2)
5672 MIPS -1%
Asus Zenbook S 14 UX5406
Intel Core Ultra 7 258V
5551 MIPS -3%
Dell XPS 13 Plus 9320 Core i7-1360P
Intel Core i7-1360P
5526 MIPS -4%
MSI Prestige 13 AI Evo
Intel Core Ultra 7 155H
5458 MIPS -5%
Asus Zenbook S 13 OLED
AMD Ryzen 7 6800U
5431 MIPS -5%
Dell XPS 13 9340 Core Ultra 7
Intel Core Ultra 7 155H
5410 MIPS -6%
Dell XPS 13 Plus 9320 4K
Intel Core i7-1260P
5325 MIPS -7%
Lenovo ThinkBook 13s G3 20YA0005GE
AMD Ryzen 7 5800U
5285 MIPS -8%
HP EliteBook x360 1040 G11
Intel Core Ultra 7 165H
5273 MIPS -8%
Lenovo Yoga 6 13 83B2001SGE
AMD Ryzen 7 7730U
5222 MIPS -9%
Lenovo ThinkBook 13x G4 21KR0008GE
Intel Core Ultra 5 125H
5082 MIPS -11%
Dell XPS 13 Plus 9320 i7-1280P OLED
Intel Core i7-1280P
4995 MIPS -13%
Dell XPS 13 9315 2-in-1 Core i5-1230U
Intel Core i5-1230U
4870 MIPS -15%
Dell XPS 13 Plus 9320 i5-1240p
Intel Core i5-1240P
4791 MIPS -16%
Dell XPS 13 9315, i5-1230U
Intel Core i5-1230U
3873 MIPS -32%
Geekbench 6.3 / Multi-Core
HP EliteBook x360 1040 G11
Intel Core Ultra 7 165H
12265 Points +12%
Dell XPS 13 9340 Core Ultra 7
Intel Core Ultra 7 155H
11982 Points +9%
Framework Laptop 13.5 Ryzen 7 7840U
AMD Ryzen 7 7840U
11489 Points +5%
Lenovo ThinkBook 13x G4 21KR0008GE
Intel Core Ultra 5 125H
11192 Points +2%
Dell XPS 13 9350
Intel Core Ultra 7 256V
10972 Points
Asus Zenbook S 14 UX5406
Intel Core Ultra 7 258V
10730 Points -2%
MSI Prestige 13 AI Evo
Intel Core Ultra 7 155H
10696 Points -3%
Усредн. модель с Intel Core Ultra 7 256V
  (9852 - 10972, n=3)
10592 Points -3%
Geekbench 6.3 / Single-Core
Dell XPS 13 9350
Intel Core Ultra 7 256V
2778 Points
Усредн. модель с Intel Core Ultra 7 256V
  (2680 - 2784, n=3)
2747 Points -1%
Asus Zenbook S 14 UX5406
Intel Core Ultra 7 258V
2679 Points -4%
Framework Laptop 13.5 Ryzen 7 7840U
AMD Ryzen 7 7840U
2553 Points -8%
MSI Prestige 13 AI Evo
Intel Core Ultra 7 155H
2441 Points -12%
HP EliteBook x360 1040 G11
Intel Core Ultra 7 165H
2437 Points -12%
Dell XPS 13 9340 Core Ultra 7
Intel Core Ultra 7 155H
2408 Points -13%
Lenovo ThinkBook 13x G4 21KR0008GE
Intel Core Ultra 5 125H
2279 Points -18%
Geekbench 5.5 / Multi-Core
HP EliteBook x360 1040 G11
Intel Core Ultra 7 165H
12204 Points +31%
Dell XPS 13 Plus 9320 i7-1280P OLED
Intel Core i7-1280P
11434 Points +23%
Dell XPS 13 9340 Core Ultra 7
Intel Core Ultra 7 155H
11279 Points +21%
Dell XPS 13 Plus 9320 Core i7-1360P
Intel Core i7-1360P
10817 Points +16%
Framework Laptop 13.5 Ryzen 7 7840U
AMD Ryzen 7 7840U
10558 Points +14%
Lenovo ThinkBook 13x G4 21KR0008GE
Intel Core Ultra 5 125H
10309 Points +11%
MSI Prestige 13 AI Evo
Intel Core Ultra 7 155H
10017 Points +8%
Dell XPS 13 Plus 9320 4K
Intel Core i7-1260P
9817 Points +6%
Усредн. модель с Intel Core Ultra 7 256V
  (9302 - 9618, n=2)
9460 Points +2%
Asus Zenbook S 14 UX5406
Intel Core Ultra 7 258V
9330 Points 0%
Dell XPS 13 9350
Intel Core Ultra 7 256V
9302 Points
HP Dragonfly G4
Intel Core i7-1365U
8778 Points -6%
Asus ZenBook S13 OLED UX5304
Intel Core i7-1355U
8117 Points -13%
Asus Zenbook S 13 OLED
AMD Ryzen 7 6800U
7613 Points -18%
Lenovo Yoga 6 13 83B2001SGE
AMD Ryzen 7 7730U
7423 Points -20%
Dell XPS 13 9315 2-in-1 Core i5-1230U
Intel Core i5-1230U
7309 Points -21%
Lenovo ThinkBook 13s G3 20YA0005GE
AMD Ryzen 7 5800U
6995 Points -25%
Dell XPS 13 9315, i5-1230U
Intel Core i5-1230U
6755 Points -27%
Dell XPS 13 Plus 9320 i5-1240p
Intel Core i5-1240P
4286 Points -54%
Geekbench 5.5 / Single-Core
Dell XPS 13 9350
Intel Core Ultra 7 256V
2010 Points
Усредн. модель с Intel Core Ultra 7 256V
  (1972 - 2010, n=2)
1991 Points -1%
Asus Zenbook S 14 UX5406
Intel Core Ultra 7 258V
1956 Points -3%
Framework Laptop 13.5 Ryzen 7 7840U
AMD Ryzen 7 7840U
1912 Points -5%
HP Dragonfly G4
Intel Core i7-1365U
1902 Points -5%
Dell XPS 13 Plus 9320 Core i7-1360P
Intel Core i7-1360P
1825 Points -9%
HP EliteBook x360 1040 G11
Intel Core Ultra 7 165H
1806 Points -10%
Dell XPS 13 Plus 9320 i7-1280P OLED
Intel Core i7-1280P
1802 Points -10%
Asus ZenBook S13 OLED UX5304
Intel Core i7-1355U
1775 Points -12%
Dell XPS 13 9340 Core Ultra 7
Intel Core Ultra 7 155H
1775 Points -12%
MSI Prestige 13 AI Evo
Intel Core Ultra 7 155H
1771 Points -12%
Dell XPS 13 Plus 9320 4K
Intel Core i7-1260P
1723 Points -14%
Lenovo ThinkBook 13x G4 21KR0008GE
Intel Core Ultra 5 125H
1684 Points -16%
Dell XPS 13 9315, i5-1230U
Intel Core i5-1230U
1640 Points -18%
Dell XPS 13 Plus 9320 i5-1240p
Intel Core i5-1240P
1588 Points -21%
Dell XPS 13 9315 2-in-1 Core i5-1230U
Intel Core i5-1230U
1529 Points -24%
Asus Zenbook S 13 OLED
AMD Ryzen 7 6800U
1514 Points -25%
Lenovo Yoga 6 13 83B2001SGE
AMD Ryzen 7 7730U
1471 Points -27%
Lenovo ThinkBook 13s G3 20YA0005GE
AMD Ryzen 7 5800U
1436 Points -29%
HWBOT x265 Benchmark v2.2 / 4k Preset
Framework Laptop 13.5 Ryzen 7 7840U
AMD Ryzen 7 7840U
17.4 fps +33%
HP EliteBook x360 1040 G11
Intel Core Ultra 7 165H
16 fps +22%
Dell XPS 13 9340 Core Ultra 7
Intel Core Ultra 7 155H
15.5 fps +18%
Dell XPS 13 Plus 9320 i7-1280P OLED
Intel Core i7-1280P
13.8 fps +5%
Усредн. модель с Intel Core Ultra 7 256V
  (13.1 - 13.5, n=2)
13.3 fps +2%
Dell XPS 13 Plus 9320 Core i7-1360P
Intel Core i7-1360P
13.2 fps +1%
Dell XPS 13 9350
Intel Core Ultra 7 256V
13.1 fps
Asus Zenbook S 13 OLED
AMD Ryzen 7 6800U
12.6 fps -4%
Dell XPS 13 Plus 9320 4K
Intel Core i7-1260P
11.8 fps -10%
Dell XPS 13 Plus 9320 i5-1240p
Intel Core i5-1240P
11.5 fps -12%
Asus Zenbook S 14 UX5406
Intel Core Ultra 7 258V
10.5 fps -20%
MSI Prestige 13 AI Evo
Intel Core Ultra 7 155H
10.4 fps -21%
Lenovo Yoga 6 13 83B2001SGE
AMD Ryzen 7 7730U
9.91 fps -24%
Lenovo ThinkBook 13x G4 21KR0008GE
Intel Core Ultra 5 125H
9.7 fps -26%
Lenovo ThinkBook 13s G3 20YA0005GE
AMD Ryzen 7 5800U
9.68 fps -26%
HP Dragonfly G4
Intel Core i7-1365U
8.61 fps -34%
Dell XPS 13 9315 2-in-1 Core i5-1230U
Intel Core i5-1230U
8.33 fps -36%
Asus ZenBook S13 OLED UX5304
Intel Core i7-1355U
7.83 fps -40%
LibreOffice / 20 Documents To PDF
Dell XPS 13 Plus 9320 i5-1240p
Intel Core i5-1240P
61.8 s * -16%
Asus Zenbook S 14 UX5406
Intel Core Ultra 7 258V
59.3 s * -11%
HP EliteBook x360 1040 G11
Intel Core Ultra 7 165H
54.8 s * -3%
Усредн. модель с Intel Core Ultra 7 256V
  (53.2 - 55.6, n=2)
54.4 s * -2%
Asus Zenbook S 13 OLED
AMD Ryzen 7 6800U
54.1 s * -2%
Dell XPS 13 9350
Intel Core Ultra 7 256V
53.2 s *
Dell XPS 13 9315 2-in-1 Core i5-1230U
Intel Core i5-1230U
51.2 s * +4%
Lenovo ThinkBook 13s G3 20YA0005GE
AMD Ryzen 7 5800U
50.9 s * +4%
Dell XPS 13 Plus 9320 i7-1280P OLED
Intel Core i7-1280P
49.2 s * +8%
Lenovo ThinkBook 13x G4 21KR0008GE
Intel Core Ultra 5 125H
49.2 s * +8%
Lenovo Yoga 6 13 83B2001SGE
AMD Ryzen 7 7730U
48.4 s * +9%
Dell XPS 13 9340 Core Ultra 7
Intel Core Ultra 7 155H
47.8 s * +10%
Asus ZenBook S13 OLED UX5304
Intel Core i7-1355U
47.5 s * +11%
Dell XPS 13 Plus 9320 Core i7-1360P
Intel Core i7-1360P
46.5 s * +13%
HP Dragonfly G4
Intel Core i7-1365U
45.3 s * +15%
Dell XPS 13 Plus 9320 4K
Intel Core i7-1260P
44.6 s * +16%
Framework Laptop 13.5 Ryzen 7 7840U
AMD Ryzen 7 7840U
44.1 s * +17%
MSI Prestige 13 AI Evo
Intel Core Ultra 7 155H
43.5 s * +18%
R Benchmark 2.5 / Overall mean
Lenovo ThinkBook 13s G3 20YA0005GE
AMD Ryzen 7 5800U
0.546 sec * -19%
Lenovo Yoga 6 13 83B2001SGE
AMD Ryzen 7 7730U
0.543 sec * -19%
Asus Zenbook S 13 OLED
AMD Ryzen 7 6800U
0.529 sec * -16%
Dell XPS 13 9315 2-in-1 Core i5-1230U
Intel Core i5-1230U
0.527 sec * -15%
Dell XPS 13 Plus 9320 i5-1240p
Intel Core i5-1240P
0.524 sec * -14%
Lenovo ThinkBook 13x G4 21KR0008GE
Intel Core Ultra 5 125H
0.503 sec * -10%
Dell XPS 13 Plus 9320 i7-1280P OLED
Intel Core i7-1280P
0.4998 sec * -9%
Dell XPS 13 Plus 9320 4K
Intel Core i7-1260P
0.4928 sec * -8%
Dell XPS 13 9340 Core Ultra 7
Intel Core Ultra 7 155H
0.4829 sec * -5%
Asus ZenBook S13 OLED UX5304
Intel Core i7-1355U
0.469 sec * -2%
HP EliteBook x360 1040 G11
Intel Core Ultra 7 165H
0.4686 sec * -2%
Dell XPS 13 Plus 9320 Core i7-1360P
Intel Core i7-1360P
0.4675 sec * -2%
MSI Prestige 13 AI Evo
Intel Core Ultra 7 155H
0.4629 sec * -1%
Усредн. модель с Intel Core Ultra 7 256V
  (0.4578 - 0.4645, n=2)
0.4612 sec * -1%
Asus Zenbook S 14 UX5406
Intel Core Ultra 7 258V
0.4593 sec * -0%
HP Dragonfly G4
Intel Core i7-1365U
0.4586 sec * -0%
Dell XPS 13 9350
Intel Core Ultra 7 256V
0.4578 sec *
Framework Laptop 13.5 Ryzen 7 7840U
AMD Ryzen 7 7840U
0.456 sec * -0%
CPU Performance Rating: Percent
Cinebench R23: Multi Core | Single Core
Cinebench R20: CPU (Multi Core) | CPU (Single Core)
Cinebench R15: CPU Multi 64Bit | CPU Single 64Bit
Blender: v2.79 BMW27 CPU
7-Zip 18.03: 7z b 4 | 7z b 4 -mmt1
Geekbench 6.3: Multi-Core | Single-Core
Geekbench 5.5: Multi-Core | Single-Core
HWBOT x265 Benchmark v2.2: 4k Preset
LibreOffice : 20 Documents To PDF
R Benchmark 2.5: Overall mean

* ... меньше = лучше

Cinebench R15 CPU Multi 64Bit
1570 Points
Cinebench R15 OpenGL 64Bit
170.5 fps
Cinebench R15 Ref. Match 64Bit
97.8 %
Cinebench R15 CPU Single 64Bit
285 Points
Cinebench R20 CPU (Multi Core)
4038 Points
Cinebench R20 CPU (Single Core)
720 Points
Cinebench R23 Single Core
1875 Points
Cinebench R23 Multi Core
10391 Points
Cinebench 2024 CPU Multi Core
582 Points
Cinebench 2024 CPU Single Core
117.4 Points
?
Performance Rating
Dell XPS 13 Plus 9320 i7-1280P OLED
Intel Core i7-1280P, Iris Xe G7 96EUs
93.9 pt
Усредн. модель с Intel Core Ultra 7 256V
 
86.6 pt
Dell XPS 13 9350
Intel Core Ultra 7 256V, Arc 140V
85.4 pt
Lenovo ThinkBook 13x G4 21KR0008GE
Intel Core Ultra 5 125H, Arc 7-Core
78.3 pt
MSI Prestige 13 AI Evo
Intel Core Ultra 7 155H, Arc 8-Core
71.2 pt
HP Dragonfly G4
Intel Core i7-1365U, Iris Xe G7 96EUs
62.1 pt
Asus ZenBook S13 OLED UX5304
Intel Core i7-1355U, Iris Xe G7 96EUs
58 pt
AIDA64 / FP32 Ray-Trace
Усредн. модель с Intel Core Ultra 7 256V
  (12287 - 12812, n=2)
12550 KRay/s +2%
Dell XPS 13 9350
Intel Core Ultra 7 256V, Arc 140V
12287 KRay/s
Dell XPS 13 Plus 9320 i7-1280P OLED
Intel Core i7-1280P, Iris Xe G7 96EUs
10787 KRay/s -12%
Lenovo ThinkBook 13x G4 21KR0008GE
Intel Core Ultra 5 125H, Arc 7-Core
8430 KRay/s -31%
HP Dragonfly G4
Intel Core i7-1365U, Iris Xe G7 96EUs
6720 KRay/s -45%
MSI Prestige 13 AI Evo
Intel Core Ultra 7 155H, Arc 8-Core
6670 KRay/s -46%
Asus ZenBook S13 OLED UX5304
Intel Core i7-1355U, Iris Xe G7 96EUs
5981 KRay/s -51%
AIDA64 / FPU Julia
Dell XPS 13 9350
Intel Core Ultra 7 256V, Arc 140V
61131 Points
Усредн. модель с Intel Core Ultra 7 256V
  (60345 - 61131, n=2)
60738 Points -1%
Dell XPS 13 Plus 9320 i7-1280P OLED
Intel Core i7-1280P, Iris Xe G7 96EUs
56649 Points -7%
MSI Prestige 13 AI Evo
Intel Core Ultra 7 155H, Arc 8-Core
45123 Points -26%
Lenovo ThinkBook 13x G4 21KR0008GE
Intel Core Ultra 5 125H, Arc 7-Core
44947 Points -26%
HP Dragonfly G4
Intel Core i7-1365U, Iris Xe G7 96EUs
33777 Points -45%
Asus ZenBook S13 OLED UX5304
Intel Core i7-1355U, Iris Xe G7 96EUs
31092 Points -49%
AIDA64 / CPU SHA3
Усредн. модель с Intel Core Ultra 7 256V
  (2713 - 2814, n=2)
2764 MB/s +2%
Dell XPS 13 9350
Intel Core Ultra 7 256V, Arc 140V
2713 MB/s
Dell XPS 13 Plus 9320 i7-1280P OLED
Intel Core i7-1280P, Iris Xe G7 96EUs
2683 MB/s -1%
Lenovo ThinkBook 13x G4 21KR0008GE
Intel Core Ultra 5 125H, Arc 7-Core
2047 MB/s -25%
MSI Prestige 13 AI Evo
Intel Core Ultra 7 155H, Arc 8-Core
2039 MB/s -25%
HP Dragonfly G4
Intel Core i7-1365U, Iris Xe G7 96EUs
1754 MB/s -35%
Asus ZenBook S13 OLED UX5304
Intel Core i7-1355U, Iris Xe G7 96EUs
1632 MB/s -40%
AIDA64 / CPU Queen
Dell XPS 13 Plus 9320 i7-1280P OLED
Intel Core i7-1280P, Iris Xe G7 96EUs
94234 Points +90%
Lenovo ThinkBook 13x G4 21KR0008GE
Intel Core Ultra 5 125H, Arc 7-Core
79986 Points +61%
HP Dragonfly G4
Intel Core i7-1365U, Iris Xe G7 96EUs
69991 Points +41%
Asus ZenBook S13 OLED UX5304
Intel Core i7-1355U, Iris Xe G7 96EUs
66531 Points +34%
MSI Prestige 13 AI Evo
Intel Core Ultra 7 155H, Arc 8-Core
64698 Points +30%
Усредн. модель с Intel Core Ultra 7 256V
  (49622 - 49794, n=2)
49708 Points 0%
Dell XPS 13 9350
Intel Core Ultra 7 256V, Arc 140V
49622 Points
AIDA64 / FPU SinJulia
Dell XPS 13 Plus 9320 i7-1280P OLED
Intel Core i7-1280P, Iris Xe G7 96EUs
7547 Points +70%
Lenovo ThinkBook 13x G4 21KR0008GE
Intel Core Ultra 5 125H, Arc 7-Core
6588 Points +49%
MSI Prestige 13 AI Evo
Intel Core Ultra 7 155H, Arc 8-Core
5639 Points +27%
HP Dragonfly G4
Intel Core i7-1365U, Iris Xe G7 96EUs
4589 Points +4%
Dell XPS 13 9350
Intel Core Ultra 7 256V, Arc 140V
4428 Points
Усредн. модель с Intel Core Ultra 7 256V
  (4425 - 4428, n=2)
4427 Points 0%
Asus ZenBook S13 OLED UX5304
Intel Core i7-1355U, Iris Xe G7 96EUs
4216 Points -5%
AIDA64 / FPU Mandel
Dell XPS 13 9350
Intel Core Ultra 7 256V, Arc 140V
32410 Points
Усредн. модель с Intel Core Ultra 7 256V
  (32020 - 32410, n=2)
32215 Points -1%
Dell XPS 13 Plus 9320 i7-1280P OLED
Intel Core i7-1280P, Iris Xe G7 96EUs
26694 Points -18%
MSI Prestige 13 AI Evo
Intel Core Ultra 7 155H, Arc 8-Core
21671 Points -33%
Lenovo ThinkBook 13x G4 21KR0008GE
Intel Core Ultra 5 125H, Arc 7-Core
21210 Points -35%
HP Dragonfly G4
Intel Core i7-1365U, Iris Xe G7 96EUs
16808 Points -48%
Asus ZenBook S13 OLED UX5304
Intel Core i7-1355U, Iris Xe G7 96EUs
15222 Points -53%
AIDA64 / CPU AES
Dell XPS 13 Plus 9320 i7-1280P OLED
Intel Core i7-1280P, Iris Xe G7 96EUs
54261 MB/s +33%
Lenovo ThinkBook 13x G4 21KR0008GE
Intel Core Ultra 5 125H, Arc 7-Core
48373 MB/s +18%
MSI Prestige 13 AI Evo
Intel Core Ultra 7 155H, Arc 8-Core
46211 MB/s +13%
Dell XPS 13 9350
Intel Core Ultra 7 256V, Arc 140V
40828 MB/s
Усредн. модель с Intel Core Ultra 7 256V
  (40415 - 40828, n=2)
40622 MB/s -1%
HP Dragonfly G4
Intel Core i7-1365U, Iris Xe G7 96EUs
34968 MB/s -14%
Asus ZenBook S13 OLED UX5304
Intel Core i7-1355U, Iris Xe G7 96EUs
32647 MB/s -20%
AIDA64 / CPU ZLib
Dell XPS 13 Plus 9320 i7-1280P OLED
Intel Core i7-1280P, Iris Xe G7 96EUs
725 MB/s +35%
Lenovo ThinkBook 13x G4 21KR0008GE
Intel Core Ultra 5 125H, Arc 7-Core
612 MB/s +14%
Усредн. модель с Intel Core Ultra 7 256V
  (536 - 632, n=2)
584 MB/s +9%
MSI Prestige 13 AI Evo
Intel Core Ultra 7 155H, Arc 8-Core
582 MB/s +9%
Dell XPS 13 9350
Intel Core Ultra 7 256V, Arc 140V
536 MB/s
HP Dragonfly G4
Intel Core i7-1365U, Iris Xe G7 96EUs
519 MB/s -3%
Asus ZenBook S13 OLED UX5304
Intel Core i7-1355U, Iris Xe G7 96EUs
488 MB/s -9%
AIDA64 / FP64 Ray-Trace
Усредн. модель с Intel Core Ultra 7 256V
  (6506 - 6832, n=2)
6669 KRay/s +3%
Dell XPS 13 9350
Intel Core Ultra 7 256V, Arc 140V
6506 KRay/s
Dell XPS 13 Plus 9320 i7-1280P OLED
Intel Core i7-1280P, Iris Xe G7 96EUs
5993 KRay/s -8%
Lenovo ThinkBook 13x G4 21KR0008GE
Intel Core Ultra 5 125H, Arc 7-Core
4421 KRay/s -32%
MSI Prestige 13 AI Evo
Intel Core Ultra 7 155H, Arc 8-Core
3569 KRay/s -45%
HP Dragonfly G4
Intel Core i7-1365U, Iris Xe G7 96EUs
3513 KRay/s -46%
Asus ZenBook S13 OLED UX5304
Intel Core i7-1355U, Iris Xe G7 96EUs
3134 KRay/s -52%
AIDA64 / CPU PhotoWorxx
Усредн. модель с Intel Core Ultra 7 256V
  (51767 - 52282, n=2)
52025 MPixel/s 0%
Dell XPS 13 9350
Intel Core Ultra 7 256V, Arc 140V
51767 MPixel/s
Dell XPS 13 Plus 9320 i7-1280P OLED
Intel Core i7-1280P, Iris Xe G7 96EUs
47506 MPixel/s -8%
Lenovo ThinkBook 13x G4 21KR0008GE
Intel Core Ultra 5 125H, Arc 7-Core
47353 MPixel/s -9%
MSI Prestige 13 AI Evo
Intel Core Ultra 7 155H, Arc 8-Core
42674 MPixel/s -18%
Asus ZenBook S13 OLED UX5304
Intel Core i7-1355U, Iris Xe G7 96EUs
38665 MPixel/s -25%
HP Dragonfly G4
Intel Core i7-1365U, Iris Xe G7 96EUs
37846 MPixel/s -27%

Стресс-тест

Система простаивает
Система простаивает

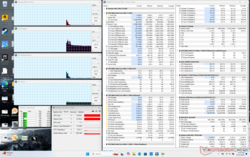
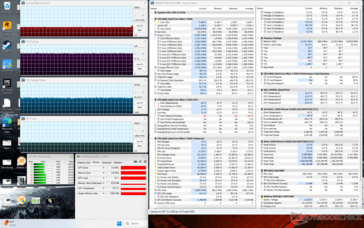
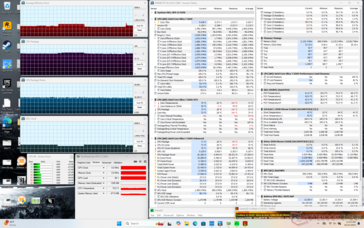
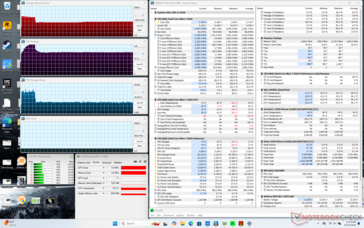
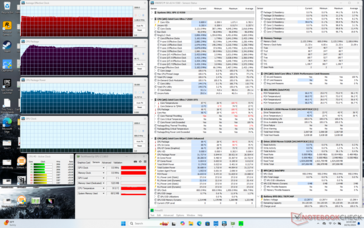
При запуске Prime95 в стрессовом режиме CPU увеличивал частоту до 3,4 ГГц и 38 Вт в течение примерно минуты, пока не достигал температуры ядра 100 C. Затем он стабилизировался на частоте 3,2 ГГц и 32 Вт, чтобы поддерживать немного более низкую температуру ядра 90 C. Если вместо этого использовать сбалансированный режим, CPU стабилизируется на гораздо более низких значениях 2,5 ГГц, 76 C и 18 Вт, что соответствует более низкой производительности нашего процессора, как отмечено в разделе "Производительность GPU" ниже.

Температура ядра при работе Prime95 в режиме Performance теплее, чем та, которую мы зафиксировали на более старой модели XPS 13 9320 при выполнении того же стресс-теста. С другой стороны, температура ядра при запуске игр оказывается ниже, чем у нашего более нового XPS 13 9350 почти на 10 C.

Cyberpunk 2077
Cyberpunk 2077
Prime95+FurMark
Prime95+FurMark
Prime95 (сбалансированный режим)
Prime95 (режим производительности)
Средняя тактовая частота процессора (ГГц) Тактовая частота графического процессора (МГц) Средняя температура процессора (°C)
Простой системы -- -- 29
Нагрузка Prime95 (режим производительности) 3.2 -- 90
Prime95 Stress (сбалансированный режим) 2.5 -- 76
Prime95 + FurMark Stress ~1.8 ~1400 72
Cyberpunk 2077 Stress 1.7 1850 71

Производительность системы

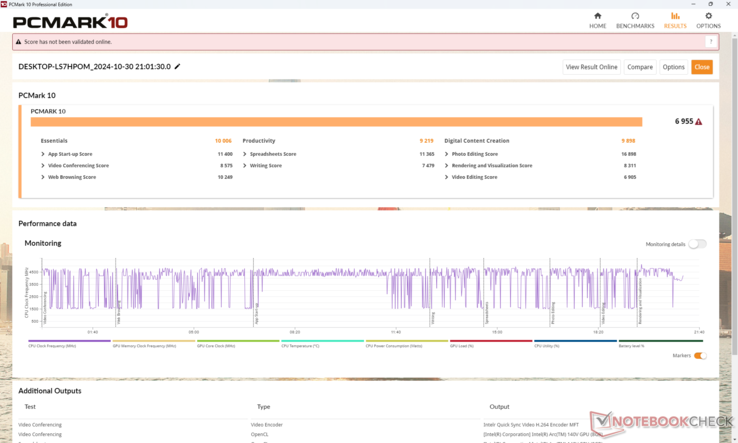
Средние результаты PCMark значительно выше, чем у всех предыдущих конфигураций XPS 13, несмотря на более медленные результаты процессора по сравнению с Core Ultra 7 155H, как было отмечено выше. Это можно объяснить как более быстрой оперативной памятью, так и интегрированным графическим процессором, уравновешивающим дефицит процессора. Результаты AIDA64 по памяти, например, заметно быстрее, чем у большинства других субноутбуков, поскольку производительность и эффективность оперативной памяти были приоритетными при разработке Lunar Lake.

PCMark 10 Standard
PCMark 10 Standard
PCMark 10 / Score
Dell XPS 13 9350
Arc 140V, Core Ultra 7 256V, Micron 2550 512GB
6955 Points
Усредн. модель с Intel Core Ultra 7 256V, Intel Arc Graphics 140V
  (6771 - 6955, n=2)
6863 Points -1%
Dell XPS 13 9340 Core Ultra 7
Arc 8-Core, Ultra 7 155H, Micron 2550 512GB
6555 Points -6%
Lenovo ThinkBook 13x G4 21KR0008GE
Arc 7-Core, Ultra 5 125H, Samsung PM9C1a MZAL8512HDLU
6293 Points -10%
MSI Prestige 13 AI Evo
Arc 8-Core, Ultra 7 155H, Samsung PM9A1 MZVL21T0HCLR
5952 Points -14%
HP Dragonfly G4
Iris Xe G7 96EUs, i7-1365U, Micron 3400 MTFDKBA512TFH 512GB
5690 Points -18%
Dell XPS 13 Plus 9320 i7-1280P OLED
Iris Xe G7 96EUs, i7-1280P, WDC PC SN810 512GB
5644 Points -19%
Asus ZenBook S13 OLED UX5304
Iris Xe G7 96EUs, i7-1355U, Samsung PM9A1 MZVL21T0HCLR
5576 Points -20%
PCMark 10 / Essentials
HP Dragonfly G4
Iris Xe G7 96EUs, i7-1365U, Micron 3400 MTFDKBA512TFH 512GB
10853 Points +8%
Dell XPS 13 9340 Core Ultra 7
Arc 8-Core, Ultra 7 155H, Micron 2550 512GB
10752 Points +7%
Asus ZenBook S13 OLED UX5304
Iris Xe G7 96EUs, i7-1355U, Samsung PM9A1 MZVL21T0HCLR
10605 Points +6%
Dell XPS 13 Plus 9320 i7-1280P OLED
Iris Xe G7 96EUs, i7-1280P, WDC PC SN810 512GB
10435 Points +4%
Lenovo ThinkBook 13x G4 21KR0008GE
Arc 7-Core, Ultra 5 125H, Samsung PM9C1a MZAL8512HDLU
10159 Points +2%
Dell XPS 13 9350
Arc 140V, Core Ultra 7 256V, Micron 2550 512GB
10006 Points
MSI Prestige 13 AI Evo
Arc 8-Core, Ultra 7 155H, Samsung PM9A1 MZVL21T0HCLR
9833 Points -2%
Усредн. модель с Intel Core Ultra 7 256V, Intel Arc Graphics 140V
  (9627 - 10006, n=2)
9817 Points -2%
PCMark 10 / Productivity
Dell XPS 13 9350
Arc 140V, Core Ultra 7 256V, Micron 2550 512GB
9219 Points
Усредн. модель с Intel Core Ultra 7 256V, Intel Arc Graphics 140V
  (8997 - 9219, n=2)
9108 Points -1%
MSI Prestige 13 AI Evo
Arc 8-Core, Ultra 7 155H, Samsung PM9A1 MZVL21T0HCLR
8643 Points -6%
Dell XPS 13 9340 Core Ultra 7
Arc 8-Core, Ultra 7 155H, Micron 2550 512GB
8440 Points -8%
Lenovo ThinkBook 13x G4 21KR0008GE
Arc 7-Core, Ultra 5 125H, Samsung PM9C1a MZAL8512HDLU
8000 Points -13%
HP Dragonfly G4
Iris Xe G7 96EUs, i7-1365U, Micron 3400 MTFDKBA512TFH 512GB
7206 Points -22%
Asus ZenBook S13 OLED UX5304
Iris Xe G7 96EUs, i7-1355U, Samsung PM9A1 MZVL21T0HCLR
7182 Points -22%
Dell XPS 13 Plus 9320 i7-1280P OLED
Iris Xe G7 96EUs, i7-1280P, WDC PC SN810 512GB
6698 Points -27%
PCMark 10 / Digital Content Creation
Dell XPS 13 9350
Arc 140V, Core Ultra 7 256V, Micron 2550 512GB
9898 Points
Усредн. модель с Intel Core Ultra 7 256V, Intel Arc Graphics 140V
  (9727 - 9898, n=2)
9813 Points -1%
Dell XPS 13 9340 Core Ultra 7
Arc 8-Core, Ultra 7 155H, Micron 2550 512GB
8423 Points -15%
Lenovo ThinkBook 13x G4 21KR0008GE
Arc 7-Core, Ultra 5 125H, Samsung PM9C1a MZAL8512HDLU
8321 Points -16%
Dell XPS 13 Plus 9320 i7-1280P OLED
Iris Xe G7 96EUs, i7-1280P, WDC PC SN810 512GB
6983 Points -29%
MSI Prestige 13 AI Evo
Arc 8-Core, Ultra 7 155H, Samsung PM9A1 MZVL21T0HCLR
6735 Points -32%
HP Dragonfly G4
Iris Xe G7 96EUs, i7-1365U, Micron 3400 MTFDKBA512TFH 512GB
6392 Points -35%
Asus ZenBook S13 OLED UX5304
Iris Xe G7 96EUs, i7-1355U, Samsung PM9A1 MZVL21T0HCLR
6177 Points -38%
CrossMark / Overall
Dell XPS 13 Plus 9320 i7-1280P OLED
Iris Xe G7 96EUs, i7-1280P, WDC PC SN810 512GB
1747 Points +1%
Dell XPS 13 9350
Arc 140V, Core Ultra 7 256V, Micron 2550 512GB
1736 Points
Усредн. модель с Intel Core Ultra 7 256V, Intel Arc Graphics 140V
  (1663 - 1736, n=2)
1700 Points -2%
Dell XPS 13 9340 Core Ultra 7
Arc 8-Core, Ultra 7 155H, Micron 2550 512GB
1680 Points -3%
HP Dragonfly G4
Iris Xe G7 96EUs, i7-1365U, Micron 3400 MTFDKBA512TFH 512GB
1628 Points -6%
Asus ZenBook S13 OLED UX5304
Iris Xe G7 96EUs, i7-1355U, Samsung PM9A1 MZVL21T0HCLR
1592 Points -8%
Lenovo ThinkBook 13x G4 21KR0008GE
Arc 7-Core, Ultra 5 125H, Samsung PM9C1a MZAL8512HDLU
1548 Points -11%
MSI Prestige 13 AI Evo
Arc 8-Core, Ultra 7 155H, Samsung PM9A1 MZVL21T0HCLR
1455 Points -16%
CrossMark / Productivity
Dell XPS 13 9350
Arc 140V, Core Ultra 7 256V, Micron 2550 512GB
1682 Points
Dell XPS 13 Plus 9320 i7-1280P OLED
Iris Xe G7 96EUs, i7-1280P, WDC PC SN810 512GB
1658 Points -1%
Усредн. модель с Intel Core Ultra 7 256V, Intel Arc Graphics 140V
  (1612 - 1682, n=2)
1647 Points -2%
HP Dragonfly G4
Iris Xe G7 96EUs, i7-1365U, Micron 3400 MTFDKBA512TFH 512GB
1620 Points -4%
Dell XPS 13 9340 Core Ultra 7
Arc 8-Core, Ultra 7 155H, Micron 2550 512GB
1618 Points -4%
Asus ZenBook S13 OLED UX5304
Iris Xe G7 96EUs, i7-1355U, Samsung PM9A1 MZVL21T0HCLR
1566 Points -7%
Lenovo ThinkBook 13x G4 21KR0008GE
Arc 7-Core, Ultra 5 125H, Samsung PM9C1a MZAL8512HDLU
1483 Points -12%
MSI Prestige 13 AI Evo
Arc 8-Core, Ultra 7 155H, Samsung PM9A1 MZVL21T0HCLR
1454 Points -14%
CrossMark / Creativity
Dell XPS 13 9350
Arc 140V, Core Ultra 7 256V, Micron 2550 512GB
1953 Points
Dell XPS 13 Plus 9320 i7-1280P OLED
Iris Xe G7 96EUs, i7-1280P, WDC PC SN810 512GB
1928 Points -1%
Усредн. модель с Intel Core Ultra 7 256V, Intel Arc Graphics 140V
  (1862 - 1953, n=2)
1908 Points -2%
Dell XPS 13 9340 Core Ultra 7
Arc 8-Core, Ultra 7 155H, Micron 2550 512GB
1854 Points -5%
HP Dragonfly G4
Iris Xe G7 96EUs, i7-1365U, Micron 3400 MTFDKBA512TFH 512GB
1731 Points -11%
Lenovo ThinkBook 13x G4 21KR0008GE
Arc 7-Core, Ultra 5 125H, Samsung PM9C1a MZAL8512HDLU
1727 Points -12%
Asus ZenBook S13 OLED UX5304
Iris Xe G7 96EUs, i7-1355U, Samsung PM9A1 MZVL21T0HCLR
1696 Points -13%
MSI Prestige 13 AI Evo
Arc 8-Core, Ultra 7 155H, Samsung PM9A1 MZVL21T0HCLR
1519 Points -22%
CrossMark / Responsiveness
Dell XPS 13 Plus 9320 i7-1280P OLED
Iris Xe G7 96EUs, i7-1280P, WDC PC SN810 512GB
1520 Points +13%
Dell XPS 13 9340 Core Ultra 7
Arc 8-Core, Ultra 7 155H, Micron 2550 512GB
1397 Points +4%
Asus ZenBook S13 OLED UX5304
Iris Xe G7 96EUs, i7-1355U, Samsung PM9A1 MZVL21T0HCLR
1386 Points +3%
HP Dragonfly G4
Iris Xe G7 96EUs, i7-1365U, Micron 3400 MTFDKBA512TFH 512GB
1373 Points +2%
Dell XPS 13 9350
Arc 140V, Core Ultra 7 256V, Micron 2550 512GB
1343 Points
Усредн. модель с Intel Core Ultra 7 256V, Intel Arc Graphics 140V
  (1301 - 1343, n=2)
1322 Points -2%
MSI Prestige 13 AI Evo
Arc 8-Core, Ultra 7 155H, Samsung PM9A1 MZVL21T0HCLR
1283 Points -4%
Lenovo ThinkBook 13x G4 21KR0008GE
Arc 7-Core, Ultra 5 125H, Samsung PM9C1a MZAL8512HDLU
1270 Points -5%
WebXPRT 3 / Overall
Dell XPS 13 9350
Arc 140V, Core Ultra 7 256V, Micron 2550 512GB
310 Points
Усредн. модель с Intel Core Ultra 7 256V, Intel Arc Graphics 140V
  (306 - 310, n=2)
308 Points -1%
HP Dragonfly G4
Iris Xe G7 96EUs, i7-1365U, Micron 3400 MTFDKBA512TFH 512GB
305 Points -2%
Asus ZenBook S13 OLED UX5304
Iris Xe G7 96EUs, i7-1355U, Samsung PM9A1 MZVL21T0HCLR
291 Points -6%
Dell XPS 13 Plus 9320 i7-1280P OLED
Iris Xe G7 96EUs, i7-1280P, WDC PC SN810 512GB
288 Points -7%
Dell XPS 13 9340 Core Ultra 7
Arc 8-Core, Ultra 7 155H, Micron 2550 512GB
272 Points -12%
MSI Prestige 13 AI Evo
Arc 8-Core, Ultra 7 155H, Samsung PM9A1 MZVL21T0HCLR
261 Points -16%
Lenovo ThinkBook 13x G4 21KR0008GE
Arc 7-Core, Ultra 5 125H, Samsung PM9C1a MZAL8512HDLU
250 Points -19%
WebXPRT 4 / Overall
Dell XPS 13 9350
Arc 140V, Core Ultra 7 256V, Micron 2550 512GB
286 Points
Усредн. модель с Intel Core Ultra 7 256V, Intel Arc Graphics 140V
  (284 - 286, n=2)
285 Points 0%
HP Dragonfly G4
Iris Xe G7 96EUs, i7-1365U, Micron 3400 MTFDKBA512TFH 512GB
266 Points -7%
Dell XPS 13 9340 Core Ultra 7
Arc 8-Core, Ultra 7 155H, Micron 2550 512GB
257 Points -10%
Asus ZenBook S13 OLED UX5304
Iris Xe G7 96EUs, i7-1355U, Samsung PM9A1 MZVL21T0HCLR
252 Points -12%
Dell XPS 13 Plus 9320 i7-1280P OLED
Iris Xe G7 96EUs, i7-1280P, WDC PC SN810 512GB
251 Points -12%
MSI Prestige 13 AI Evo
Arc 8-Core, Ultra 7 155H, Samsung PM9A1 MZVL21T0HCLR
241 Points -16%
Lenovo ThinkBook 13x G4 21KR0008GE
Arc 7-Core, Ultra 5 125H, Samsung PM9C1a MZAL8512HDLU
240 Points -16%
Mozilla Kraken 1.1 / Total
Lenovo ThinkBook 13x G4 21KR0008GE
Arc 7-Core, Ultra 5 125H, Samsung PM9C1a MZAL8512HDLU
560 ms * -19%
MSI Prestige 13 AI Evo
Arc 8-Core, Ultra 7 155H, Samsung PM9A1 MZVL21T0HCLR
542 ms * -15%
Dell XPS 13 Plus 9320 i7-1280P OLED
Iris Xe G7 96EUs, i7-1280P, WDC PC SN810 512GB
538 ms * -14%
Dell XPS 13 9340 Core Ultra 7
Arc 8-Core, Ultra 7 155H, Micron 2550 512GB
528 ms * -12%
Asus ZenBook S13 OLED UX5304
Iris Xe G7 96EUs, i7-1355U, Samsung PM9A1 MZVL21T0HCLR
515 ms * -9%
HP Dragonfly G4
Iris Xe G7 96EUs, i7-1365U, Micron 3400 MTFDKBA512TFH 512GB
494 ms * -5%
Усредн. модель с Intel Core Ultra 7 256V, Intel Arc Graphics 140V
  (472 - 474, n=2)
473 ms * -0%
Dell XPS 13 9350
Arc 140V, Core Ultra 7 256V, Micron 2550 512GB
472 ms *

* ... меньше = лучше

PCMark 10 Score
6955 баллов
?
AIDA64 / Memory Copy
Усредн. модель с Intel Core Ultra 7 256V
  (101642 - 104459, n=2)
103051 MB/s +1%
Dell XPS 13 9350
Intel Core Ultra 7 256V, Arc 140V
101642 MB/s
Lenovo ThinkBook 13x G4 21KR0008GE
Intel Core Ultra 5 125H, Arc 7-Core
87473 MB/s -14%
MSI Prestige 13 AI Evo
Intel Core Ultra 7 155H, Arc 8-Core
81600 MB/s -20%
Dell XPS 13 Plus 9320 i7-1280P OLED
Intel Core i7-1280P, Iris Xe G7 96EUs
72478 MB/s -29%
Asus ZenBook S13 OLED UX5304
Intel Core i7-1355U, Iris Xe G7 96EUs
59942 MB/s -41%
HP Dragonfly G4
Intel Core i7-1365U, Iris Xe G7 96EUs
58331 MB/s -43%
AIDA64 / Memory Read
Усредн. модель с Intel Core Ultra 7 256V
  (88013 - 89144, n=2)
88579 MB/s +1%
Dell XPS 13 9350
Intel Core Ultra 7 256V, Arc 140V
88013 MB/s
Lenovo ThinkBook 13x G4 21KR0008GE
Intel Core Ultra 5 125H, Arc 7-Core
76803 MB/s -13%
MSI Prestige 13 AI Evo
Intel Core Ultra 7 155H, Arc 8-Core
74299 MB/s -16%
Dell XPS 13 Plus 9320 i7-1280P OLED
Intel Core i7-1280P, Iris Xe G7 96EUs
73719 MB/s -16%
Asus ZenBook S13 OLED UX5304
Intel Core i7-1355U, Iris Xe G7 96EUs
49758 MB/s -43%
HP Dragonfly G4
Intel Core i7-1365U, Iris Xe G7 96EUs
49203 MB/s -44%
AIDA64 / Memory Write
Усредн. модель с Intel Core Ultra 7 256V
  (112340 - 117933, n=2)
115137 MB/s +2%
Dell XPS 13 9350
Intel Core Ultra 7 256V, Arc 140V
112340 MB/s
MSI Prestige 13 AI Evo
Intel Core Ultra 7 155H, Arc 8-Core
75825 MB/s -33%
Asus ZenBook S13 OLED UX5304
Intel Core i7-1355U, Iris Xe G7 96EUs
72418 MB/s -36%
HP Dragonfly G4
Intel Core i7-1365U, Iris Xe G7 96EUs
70434 MB/s -37%
Lenovo ThinkBook 13x G4 21KR0008GE
Intel Core Ultra 5 125H, Arc 7-Core
69575 MB/s -38%
Dell XPS 13 Plus 9320 i7-1280P OLED
Intel Core i7-1280P, Iris Xe G7 96EUs
63969 MB/s -43%
AIDA64 / Memory Latency
MSI Prestige 13 AI Evo
Intel Core Ultra 7 155H, Arc 8-Core
146.1 ns * -47%
Lenovo ThinkBook 13x G4 21KR0008GE
Intel Core Ultra 5 125H, Arc 7-Core
133.4 ns * -34%
Dell XPS 13 Plus 9320 i7-1280P OLED
Intel Core i7-1280P, Iris Xe G7 96EUs
103 ns * -3%
Dell XPS 13 9350
Intel Core Ultra 7 256V, Arc 140V
99.6 ns *
Усредн. модель с Intel Core Ultra 7 256V
  (99.6 - 99.6, n=2)
99.6 ns * -0%
HP Dragonfly G4
Intel Core i7-1365U, Iris Xe G7 96EUs
90.2 ns * +9%
Asus ZenBook S13 OLED UX5304
Intel Core i7-1355U, Iris Xe G7 96EUs
90.1 ns * +10%

* ... меньше = лучше

Задержка DPC

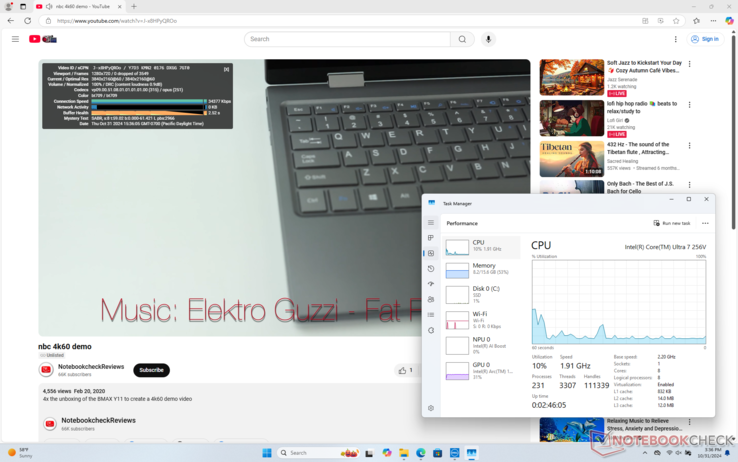
LatencyMon несовместим с этой моделью и ее новым процессором Lunar Lake. воспроизведение 4K-видео при 60 FPS в остальном безупречно, не зафиксировано ни одного выпавшего кадра.

тест воспроизведения 4K60

Накопитель

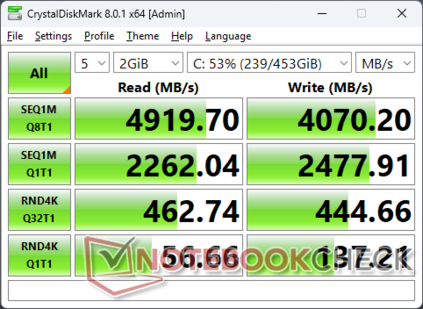
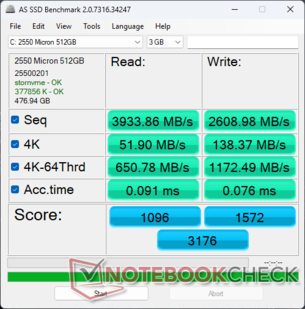
Система поставляется с одним и тем же Твердотельный накопитель Micron 2550 PCIe4 NVMe что и в моделях XPS 13 серий 9340 и 9345. Пиковая скорость передачи данных составляет ~5000 МБ/с без признаков дросселирования при нагрузке. Тем не менее, чуть более крупные ноутбуки, такие как Lenovo ThinkPad T14s обычно поставляются с Samsung PM9A1a, который может достигать скорости более 7000 МБ/с.

CDM 8
CDM 8
AS SSD
AS SSD
Micron 2550 512GB
CDM 5/6 Read Seq Q32T1: 5036 MB/s
CDM 5/6 Write Seq Q32T1: 4060 MB/s
CDM 5/6 Read 4K Q32T1: 467.7 MB/s
CDM 5/6 Write 4K Q32T1: 452.4 MB/s
CDM 5 Read Seq: 2284 MB/s
CDM 5 Write Seq: 2548 MB/s
CDM 5/6 Read 4K: 55.42 MB/s
CDM 5/6 Write 4K: 133 MB/s
Drive Performance Rating - Percent
MSI Prestige 13 AI Evo
Samsung PM9A1 MZVL21T0HCLR
95.1 pt
Dell XPS 13 Plus 9320 i7-1280P OLED
WDC PC SN810 512GB
72.6 pt
Asus ZenBook S13 OLED UX5304
Samsung PM9A1 MZVL21T0HCLR
71.8 pt
Lenovo ThinkBook 13x G4 21KR0008GE
Samsung PM9C1a MZAL8512HDLU
66.2 pt
HP Dragonfly G4
Micron 3400 MTFDKBA512TFH 512GB
63.6 pt
Dell XPS 13 9350
Micron 2550 512GB
50.4 pt
DiskSpd
seq read
MSI Prestige 13 AI Evo
Samsung PM9A1 MZVL21T0HCLR
4501 (4492.31min - 4501.34max) MB/s +86%
Asus ZenBook S13 OLED UX5304
Samsung PM9A1 MZVL21T0HCLR
4001 (3943.69min - 4000.53max) MB/s +66%
Dell XPS 13 Plus 9320 i7-1280P OLED
WDC PC SN810 512GB
3747 (3711.67min - 3747.4max) MB/s +55%
HP Dragonfly G4
Micron 3400 MTFDKBA512TFH 512GB
3312 (3304.27min - 3312.03max) MB/s +37%
Lenovo ThinkBook 13x G4 21KR0008GE
Samsung PM9C1a MZAL8512HDLU
2565 (1389.73min - 2564.61max) MB/s +6%
Dell XPS 13 9350
Micron 2550 512GB
2416 (2299.74min - 2415.91max) MB/s
seq write
MSI Prestige 13 AI Evo
Samsung PM9A1 MZVL21T0HCLR
4460 (4450.9min - 4460.43max) MB/s +80%
Dell XPS 13 Plus 9320 i7-1280P OLED
WDC PC SN810 512GB
3470 (3416.05min - 3470.37max) MB/s +40%
HP Dragonfly G4
Micron 3400 MTFDKBA512TFH 512GB
3342 (3270.72min - 3341.6max) MB/s +35%
Asus ZenBook S13 OLED UX5304
Samsung PM9A1 MZVL21T0HCLR
3321 (3143.21min - 3321.26max) MB/s +34%
Lenovo ThinkBook 13x G4 21KR0008GE
Samsung PM9C1a MZAL8512HDLU
2983 (2793.48min - 2982.57max) MB/s +20%
Dell XPS 13 9350
Micron 2550 512GB
2477 (2281.75min - 2476.53max) MB/s
seq q8 t1 read
MSI Prestige 13 AI Evo
Samsung PM9A1 MZVL21T0HCLR
7100 (6554.33min - 7100.12max) MB/s +40%
Asus ZenBook S13 OLED UX5304
Samsung PM9A1 MZVL21T0HCLR
7036 (6223.64min - 7035.55max) MB/s +39%
Dell XPS 13 Plus 9320 i7-1280P OLED
WDC PC SN810 512GB
6656 (5809.03min - 6655.73max) MB/s +32%
HP Dragonfly G4
Micron 3400 MTFDKBA512TFH 512GB
6628 (6115.78min - 6627.63max) MB/s +31%
Lenovo ThinkBook 13x G4 21KR0008GE
Samsung PM9C1a MZAL8512HDLU
6068 (5239.11min - 6068.32max) MB/s +20%
Dell XPS 13 9350
Micron 2550 512GB
5057 (4337.25min - 5057.07max) MB/s
seq q8 t1 write
MSI Prestige 13 AI Evo
Samsung PM9A1 MZVL21T0HCLR
5281 (5261.13min - 5280.63max) MB/s +30%
Asus ZenBook S13 OLED UX5304
Samsung PM9A1 MZVL21T0HCLR
5179 (4831.64min - 5178.79max) MB/s +27%
Lenovo ThinkBook 13x G4 21KR0008GE
Samsung PM9C1a MZAL8512HDLU
4715 (4689.23min - 4715.24max) MB/s +16%
Dell XPS 13 Plus 9320 i7-1280P OLED
WDC PC SN810 512GB
4468 (4431.23min - 4467.85max) MB/s +10%
Dell XPS 13 9350
Micron 2550 512GB
4062 (3975.8min - 4061.61max) MB/s
HP Dragonfly G4
Micron 3400 MTFDKBA512TFH 512GB
3965 (3820.5min - 3965.05max) MB/s -2%
4k q1 t1 read
MSI Prestige 13 AI Evo
Samsung PM9A1 MZVL21T0HCLR
85.9 (85.31min - 85.9max) MB/s +61%
Asus ZenBook S13 OLED UX5304
Samsung PM9A1 MZVL21T0HCLR
83.3 (77.84min - 83.26max) MB/s +57%
Dell XPS 13 Plus 9320 i7-1280P OLED
WDC PC SN810 512GB
67.5 (65.71min - 67.48max) MB/s +27%
HP Dragonfly G4
Micron 3400 MTFDKBA512TFH 512GB
67.2 (66.32min - 67.16max) MB/s +26%
Lenovo ThinkBook 13x G4 21KR0008GE
Samsung PM9C1a MZAL8512HDLU
63 (61.94min - 62.98max) MB/s +18%
Dell XPS 13 9350
Micron 2550 512GB
53.2 (50.58min - 53.24max) MB/s
4k q1 t1 write
MSI Prestige 13 AI Evo
Samsung PM9A1 MZVL21T0HCLR
204 (200.8min - 203.91max) MB/s +47%
Dell XPS 13 Plus 9320 i7-1280P OLED
WDC PC SN810 512GB
170.9 (165.47min - 170.92max) MB/s +23%
Asus ZenBook S13 OLED UX5304
Samsung PM9A1 MZVL21T0HCLR
140.8 (131.23min - 140.77max) MB/s +1%
Dell XPS 13 9350
Micron 2550 512GB
139.2 (136.33min - 139.15max) MB/s
HP Dragonfly G4
Micron 3400 MTFDKBA512TFH 512GB
138.9 (137.35min - 138.92max) MB/s 0%
Lenovo ThinkBook 13x G4 21KR0008GE
Samsung PM9C1a MZAL8512HDLU
119.2 (114.62min - 119.17max) MB/s -14%
4k q32 t16 read
MSI Prestige 13 AI Evo
Samsung PM9A1 MZVL21T0HCLR
3215 (2358.16min - 3214.63max) MB/s +402%
Lenovo ThinkBook 13x G4 21KR0008GE
Samsung PM9C1a MZAL8512HDLU
703 (627.88min - 703.14max) MB/s +10%
HP Dragonfly G4
Micron 3400 MTFDKBA512TFH 512GB
690 (550.07min - 689.62max) MB/s +8%
Dell XPS 13 9350
Micron 2550 512GB
640 (630.5min - 640.27max) MB/s
Dell XPS 13 Plus 9320 i7-1280P OLED
WDC PC SN810 512GB
540 (532.43min - 540.23max) MB/s -16%
Asus ZenBook S13 OLED UX5304
Samsung PM9A1 MZVL21T0HCLR
494 (392.19min - 494.04max) MB/s -23%
4k q32 t16 write
MSI Prestige 13 AI Evo
Samsung PM9A1 MZVL21T0HCLR
2288 (1575.7min - 2287.8max) MB/s +512%
Dell XPS 13 Plus 9320 i7-1280P OLED
WDC PC SN810 512GB
416 (398.57min - 416.29max) MB/s +11%
Lenovo ThinkBook 13x G4 21KR0008GE
Samsung PM9C1a MZAL8512HDLU
397 (338.3min - 396.83max) MB/s +6%
HP Dragonfly G4
Micron 3400 MTFDKBA512TFH 512GB
389 (345.44min - 388.55max) MB/s +4%
Dell XPS 13 9350
Micron 2550 512GB
374 (359.04min - 373.65max) MB/s
Asus ZenBook S13 OLED UX5304
Samsung PM9A1 MZVL21T0HCLR
372 (323.75min - 372.35max) MB/s -1%
AS SSD
Score Total
MSI Prestige 13 AI Evo
Samsung PM9A1 MZVL21T0HCLR
5770 Points +82%
Dell XPS 13 Plus 9320 i7-1280P OLED
WDC PC SN810 512GB
5114 Points +61%
Lenovo ThinkBook 13x G4 21KR0008GE
Samsung PM9C1a MZAL8512HDLU
4180 Points +32%
HP Dragonfly G4
Micron 3400 MTFDKBA512TFH 512GB
4171 Points +31%
Asus ZenBook S13 OLED UX5304
Samsung PM9A1 MZVL21T0HCLR
4048 Points +27%
Dell XPS 13 9350
Micron 2550 512GB
3176 Points
Score Read
MSI Prestige 13 AI Evo
Samsung PM9A1 MZVL21T0HCLR
1756 Points +60%
Dell XPS 13 Plus 9320 i7-1280P OLED
WDC PC SN810 512GB
1451 Points +32%
Lenovo ThinkBook 13x G4 21KR0008GE
Samsung PM9C1a MZAL8512HDLU
1211 Points +10%
HP Dragonfly G4
Micron 3400 MTFDKBA512TFH 512GB
1169 Points +7%
Dell XPS 13 9350
Micron 2550 512GB
1096 Points
Asus ZenBook S13 OLED UX5304
Samsung PM9A1 MZVL21T0HCLR
1040 Points -5%
Score Write
MSI Prestige 13 AI Evo
Samsung PM9A1 MZVL21T0HCLR
3156 Points +101%
Dell XPS 13 Plus 9320 i7-1280P OLED
WDC PC SN810 512GB
3046 Points +94%
Asus ZenBook S13 OLED UX5304
Samsung PM9A1 MZVL21T0HCLR
2568 Points +63%
HP Dragonfly G4
Micron 3400 MTFDKBA512TFH 512GB
2506 Points +59%
Lenovo ThinkBook 13x G4 21KR0008GE
Samsung PM9C1a MZAL8512HDLU
2426 Points +54%
Dell XPS 13 9350
Micron 2550 512GB
1572 Points
Seq Read
MSI Prestige 13 AI Evo
Samsung PM9A1 MZVL21T0HCLR
5470 MB/s +39%
Dell XPS 13 Plus 9320 i7-1280P OLED
WDC PC SN810 512GB
5411.56 MB/s +38%
Asus ZenBook S13 OLED UX5304
Samsung PM9A1 MZVL21T0HCLR
5107 MB/s +30%
HP Dragonfly G4
Micron 3400 MTFDKBA512TFH 512GB
4510.61 MB/s +15%
Lenovo ThinkBook 13x G4 21KR0008GE
Samsung PM9C1a MZAL8512HDLU
4488 MB/s +14%
Dell XPS 13 9350
Micron 2550 512GB
3933.86 MB/s
Seq Write
MSI Prestige 13 AI Evo
Samsung PM9A1 MZVL21T0HCLR
4344 MB/s +67%
Asus ZenBook S13 OLED UX5304
Samsung PM9A1 MZVL21T0HCLR
2849 MB/s +9%
Dell XPS 13 9350
Micron 2550 512GB
2608.98 MB/s
Lenovo ThinkBook 13x G4 21KR0008GE
Samsung PM9C1a MZAL8512HDLU
2595 MB/s -1%
Dell XPS 13 Plus 9320 i7-1280P OLED
WDC PC SN810 512GB
2530.01 MB/s -3%
HP Dragonfly G4
Micron 3400 MTFDKBA512TFH 512GB
2127.08 MB/s -18%
4K Read
MSI Prestige 13 AI Evo
Samsung PM9A1 MZVL21T0HCLR
72 MB/s +39%
Dell XPS 13 Plus 9320 i7-1280P OLED
WDC PC SN810 512GB
70.31 MB/s +35%
Lenovo ThinkBook 13x G4 21KR0008GE
Samsung PM9C1a MZAL8512HDLU
65.3 MB/s +26%
Asus ZenBook S13 OLED UX5304
Samsung PM9A1 MZVL21T0HCLR
64.1 MB/s +24%
HP Dragonfly G4
Micron 3400 MTFDKBA512TFH 512GB
61.53 MB/s +19%
Dell XPS 13 9350
Micron 2550 512GB
51.9 MB/s
4K Write
Dell XPS 13 Plus 9320 i7-1280P OLED
WDC PC SN810 512GB
232.86 MB/s +68%
Asus ZenBook S13 OLED UX5304
Samsung PM9A1 MZVL21T0HCLR
198.7 MB/s +44%
HP Dragonfly G4
Micron 3400 MTFDKBA512TFH 512GB
185.58 MB/s +34%
MSI Prestige 13 AI Evo
Samsung PM9A1 MZVL21T0HCLR
179.9 MB/s +30%
Lenovo ThinkBook 13x G4 21KR0008GE
Samsung PM9C1a MZAL8512HDLU
156.9 MB/s +13%
Dell XPS 13 9350
Micron 2550 512GB
138.37 MB/s
4K-64 Read
MSI Prestige 13 AI Evo
Samsung PM9A1 MZVL21T0HCLR
1137 MB/s +75%
Dell XPS 13 Plus 9320 i7-1280P OLED
WDC PC SN810 512GB
839.87 MB/s +29%
Lenovo ThinkBook 13x G4 21KR0008GE
Samsung PM9C1a MZAL8512HDLU
697 MB/s +7%
HP Dragonfly G4
Micron 3400 MTFDKBA512TFH 512GB
656.17 MB/s +1%
Dell XPS 13 9350
Micron 2550 512GB
650.78 MB/s
Asus ZenBook S13 OLED UX5304
Samsung PM9A1 MZVL21T0HCLR
466 MB/s -28%
4K-64 Write
Dell XPS 13 Plus 9320 i7-1280P OLED
WDC PC SN810 512GB
2560.31 MB/s +118%
MSI Prestige 13 AI Evo
Samsung PM9A1 MZVL21T0HCLR
2542 MB/s +117%
HP Dragonfly G4
Micron 3400 MTFDKBA512TFH 512GB
2107.89 MB/s +80%
Asus ZenBook S13 OLED UX5304
Samsung PM9A1 MZVL21T0HCLR
2084 MB/s +78%
Lenovo ThinkBook 13x G4 21KR0008GE
Samsung PM9C1a MZAL8512HDLU
2010 MB/s +71%
Dell XPS 13 9350
Micron 2550 512GB
1172.49 MB/s
Access Time Read
Dell XPS 13 9350
Micron 2550 512GB
0.091 ms *
Dell XPS 13 Plus 9320 i7-1280P OLED
WDC PC SN810 512GB
0.082 ms * +10%
HP Dragonfly G4
Micron 3400 MTFDKBA512TFH 512GB
0.055 ms * +40%
Lenovo ThinkBook 13x G4 21KR0008GE
Samsung PM9C1a MZAL8512HDLU
0.036 ms * +60%
MSI Prestige 13 AI Evo
Samsung PM9A1 MZVL21T0HCLR
0.033 ms * +64%
Asus ZenBook S13 OLED UX5304
Samsung PM9A1 MZVL21T0HCLR
0.025 ms * +73%
Access Time Write
Dell XPS 13 9350
Micron 2550 512GB
0.076 ms *
HP Dragonfly G4
Micron 3400 MTFDKBA512TFH 512GB
0.067 ms * +12%
Dell XPS 13 Plus 9320 i7-1280P OLED
WDC PC SN810 512GB
0.049 ms * +36%
Asus ZenBook S13 OLED UX5304
Samsung PM9A1 MZVL21T0HCLR
0.025 ms * +67%
MSI Prestige 13 AI Evo
Samsung PM9A1 MZVL21T0HCLR
0.025 ms * +67%
Lenovo ThinkBook 13x G4 21KR0008GE
Samsung PM9C1a MZAL8512HDLU
0.023 ms * +70%

* ... меньше = лучше

Чтение в DiskSpd, Глубина запроса 8

02605207801040130015601820208023402600286031203380364039004160442046804940Tooltip
Dell XPS 13 9350 Micron 2550 512GB; diskspd 2.0.17 f: Ø5043 (4553.97-5060.22)
Dell XPS 13 9345  ; diskspd 2.0.17 f: Ø5089 (4590.46-5102.16)

Видеокарта

результаты 3DMark от нашего Arc Graphics 140V довольно высоки, особенно для субноутбука. Наше устройство превосходит большинство, если не все другие субноутбуки серии U, представленные в настоящее время на рынке, работающие на интегрированной графике, включая даже те, которые оснащены конкурирующей Radeon 780M GPU. Особенно заметно, что результаты на 20-40% выше, чем у Arc 8 в ноутбуке XPS 13 9340, которому едва исполнилось 6 месяцев. Результаты действительно удивительны, учитывая, что серия XPS 13 исторически была довольно слабой, когда дело касалось графической производительности.

Профиль питанияОценка графикиФизический баллКомбинированный балл
Режим производительности9492222573474
Сбалансированный режим9555 (-0%)19598 (-12%)2932 (-16%)
Питание от батареи9200 (-3%)17818 (-20%)2754 (-21%)

Переход в сбалансированный режим или режим питания от батареи из режима Производительность влияет на производительность процессора больше, чем на производительность графики, как показано в нашей таблице результатов Fire Strike выше. Таким образом, чтобы получить максимальную отдачу от системы, Вам следует переходить в режим Performance при запуске требовательных приложений.

3DMark 11
3DMark 11
Fire Strike
Fire Strike
Стальной кочевник
Стальной кочевник
Time Spy
Time Spy
3DMark Performance Rating - Percent
Dell XPS 13 9350
Intel Arc Graphics 140V, Intel Core Ultra 7 256V
96.4 pt
Усредн. модель с Intel Arc Graphics 140V
 
93.2 pt
HP EliteBook x360 1040 G11
Intel Arc 8-Core iGPU, Intel Core Ultra 7 165H
91.5 pt
Asus Zenbook S 14 UX5406
Intel Arc Graphics 140V, Intel Core Ultra 7 258V
90.7 pt
Lenovo ThinkBook 13x G4 21KR0008GE
Intel Arc 7-Core iGPU, Intel Core Ultra 5 125H
85.2 pt
Dell XPS 13 9340 Core Ultra 7
Intel Arc 8-Core iGPU, Intel Core Ultra 7 155H
77.8 pt
Framework Laptop 13.5 Ryzen 7 7840U
AMD Radeon 780M, AMD Ryzen 7 7840U
75.3 pt
Asus Zenbook S 13 OLED
AMD Radeon 680M, AMD Ryzen 7 6800U
64.4 pt
MSI Prestige 13 AI Evo
Intel Arc 8-Core iGPU, Intel Core Ultra 7 155H
55.6 pt
Dell XPS 13 Plus 9320 Core i7-1360P
Intel Iris Xe Graphics G7 96EUs, Intel Core i7-1360P
51.9 pt
Dell XPS 13 Plus 9320 i7-1280P OLED
Intel Iris Xe Graphics G7 96EUs, Intel Core i7-1280P
50.4 pt
Dell XPS 13 Plus 9320 4K
Intel Iris Xe Graphics G7 96EUs, Intel Core i7-1260P
50.3 pt
HP Dragonfly G4
Intel Iris Xe Graphics G7 96EUs, Intel Core i7-1365U
46.3 pt
Asus ZenBook S13 OLED UX5304
Intel Iris Xe Graphics G7 96EUs, Intel Core i7-1355U
45 pt
Lenovo Yoga 6 13 83B2001SGE
AMD Radeon RX Vega 8 (Ryzen 4000/5000), AMD Ryzen 7 7730U
38.4 pt
Dell XPS 13 Plus 9320 i5-1240p
Intel Iris Xe Graphics G7 80EUs, Intel Core i5-1240P
35.3 pt
Lenovo ThinkBook 13s G3 20YA0005GE
AMD Radeon RX Vega 8 (Ryzen 4000/5000), AMD Ryzen 7 5800U
34.6 pt
Dell XPS 13 9315, i5-1230U
Intel Iris Xe Graphics G7 80EUs, Intel Core i5-1230U
28.1 pt
Dell XPS 13 9315 2-in-1 Core i5-1230U
Intel Iris Xe Graphics G7 80EUs, Intel Core i5-1230U
28 pt
3DMark 11 - 1280x720 Performance GPU
HP EliteBook x360 1040 G11
Intel Arc 8-Core iGPU, Intel Core Ultra 7 165H
12457 Points +17%
Framework Laptop 13.5 Ryzen 7 7840U
AMD Radeon 780M, AMD Ryzen 7 7840U
11695 Points +10%
Lenovo ThinkBook 13x G4 21KR0008GE
Intel Arc 7-Core iGPU, Intel Core Ultra 5 125H
11467 Points +8%
Усредн. модель с Intel Arc Graphics 140V
  (10499 - 11335, n=8)
10810 Points +1%
Asus Zenbook S 14 UX5406
Intel Arc Graphics 140V, Intel Core Ultra 7 258V
10722 Points +1%
Dell XPS 13 9350
Intel Arc Graphics 140V, Intel Core Ultra 7 256V
10651 Points
Dell XPS 13 9340 Core Ultra 7
Intel Arc 8-Core iGPU, Intel Core Ultra 7 155H
10624 Points 0%
Asus Zenbook S 13 OLED
AMD Radeon 680M, AMD Ryzen 7 6800U
9095 Points -15%
MSI Prestige 13 AI Evo
Intel Arc 8-Core iGPU, Intel Core Ultra 7 155H
8064 Points -24%
Dell XPS 13 Plus 9320 i7-1280P OLED
Intel Iris Xe Graphics G7 96EUs, Intel Core i7-1280P
7016 Points -34%
Dell XPS 13 Plus 9320 4K
Intel Iris Xe Graphics G7 96EUs, Intel Core i7-1260P
6956 Points -35%
Dell XPS 13 Plus 9320 Core i7-1360P
Intel Iris Xe Graphics G7 96EUs, Intel Core i7-1360P
6815 Points -36%
HP Dragonfly G4
Intel Iris Xe Graphics G7 96EUs, Intel Core i7-1365U
6440 Points -40%
Asus ZenBook S13 OLED UX5304
Intel Iris Xe Graphics G7 96EUs, Intel Core i7-1355U
6334 Points -41%
Lenovo ThinkBook 13s G3 20YA0005GE
AMD Radeon RX Vega 8 (Ryzen 4000/5000), AMD Ryzen 7 5800U
6174 Points -42%
Lenovo Yoga 6 13 83B2001SGE
AMD Radeon RX Vega 8 (Ryzen 4000/5000), AMD Ryzen 7 7730U
5656 Points -47%
Dell XPS 13 Plus 9320 i5-1240p
Intel Iris Xe Graphics G7 80EUs, Intel Core i5-1240P
5104 Points -52%
Dell XPS 13 9315, i5-1230U
Intel Iris Xe Graphics G7 80EUs, Intel Core i5-1230U
3847 Points -64%
Dell XPS 13 9315 2-in-1 Core i5-1230U
Intel Iris Xe Graphics G7 80EUs, Intel Core i5-1230U
3844 Points -64%
3DMark
1920x1080 Fire Strike Graphics
Dell XPS 13 9350
Intel Arc Graphics 140V, Intel Core Ultra 7 256V
9492 Points
Asus Zenbook S 14 UX5406
Intel Arc Graphics 140V, Intel Core Ultra 7 258V
9414 Points -1%
Усредн. модель с Intel Arc Graphics 140V
  (6790 - 9930, n=9)
9167 Points -3%
HP EliteBook x360 1040 G11
Intel Arc 8-Core iGPU, Intel Core Ultra 7 165H
8961 Points -6%
Lenovo ThinkBook 13x G4 21KR0008GE
Intel Arc 7-Core iGPU, Intel Core Ultra 5 125H
8503 Points -10%
Dell XPS 13 9340 Core Ultra 7
Intel Arc 8-Core iGPU, Intel Core Ultra 7 155H
7946 Points -16%
Framework Laptop 13.5 Ryzen 7 7840U
AMD Radeon 780M, AMD Ryzen 7 7840U
7455 Points -21%
Asus Zenbook S 13 OLED
AMD Radeon 680M, AMD Ryzen 7 6800U
6683 Points -30%
Dell XPS 13 Plus 9320 Core i7-1360P
Intel Iris Xe Graphics G7 96EUs, Intel Core i7-1360P
5981 Points -37%
MSI Prestige 13 AI Evo
Intel Arc 8-Core iGPU, Intel Core Ultra 7 155H
5568 Points -41%
Dell XPS 13 Plus 9320 4K
Intel Iris Xe Graphics G7 96EUs, Intel Core i7-1260P
5421 Points -43%
Dell XPS 13 Plus 9320 i7-1280P OLED
Intel Iris Xe Graphics G7 96EUs, Intel Core i7-1280P
5393 Points -43%
HP Dragonfly G4
Intel Iris Xe Graphics G7 96EUs, Intel Core i7-1365U
5175 Points -45%
Asus ZenBook S13 OLED UX5304
Intel Iris Xe Graphics G7 96EUs, Intel Core i7-1355U
5101 Points -46%
Lenovo Yoga 6 13 83B2001SGE
AMD Radeon RX Vega 8 (Ryzen 4000/5000), AMD Ryzen 7 7730U
4147 Points -56%
Dell XPS 13 Plus 9320 i5-1240p
Intel Iris Xe Graphics G7 80EUs, Intel Core i5-1240P
4086 Points -57%
Lenovo ThinkBook 13s G3 20YA0005GE
AMD Radeon RX Vega 8 (Ryzen 4000/5000), AMD Ryzen 7 5800U
3335 Points -65%
Dell XPS 13 9315, i5-1230U
Intel Iris Xe Graphics G7 80EUs, Intel Core i5-1230U
3247 Points -66%
Dell XPS 13 9315 2-in-1 Core i5-1230U
Intel Iris Xe Graphics G7 80EUs, Intel Core i5-1230U
3227 Points -66%
2560x1440 Time Spy Graphics
Dell XPS 13 9350
Intel Arc Graphics 140V, Intel Core Ultra 7 256V
4115 Points
Усредн. модель с Intel Arc Graphics 140V
  (2955 - 4227, n=12)
3867 Points -6%
Asus Zenbook S 14 UX5406
Intel Arc Graphics 140V, Intel Core Ultra 7 258V
3669 Points -11%
HP EliteBook x360 1040 G11
Intel Arc 8-Core iGPU, Intel Core Ultra 7 165H
3458 Points -16%
Lenovo ThinkBook 13x G4 21KR0008GE
Intel Arc 7-Core iGPU, Intel Core Ultra 5 125H
3248 Points -21%
Dell XPS 13 9340 Core Ultra 7
Intel Arc 8-Core iGPU, Intel Core Ultra 7 155H
2911 Points -29%
Framework Laptop 13.5 Ryzen 7 7840U
AMD Radeon 780M, AMD Ryzen 7 7840U
2575 Points -37%
Asus Zenbook S 13 OLED
AMD Radeon 680M, AMD Ryzen 7 6800U
2287 Points -44%
MSI Prestige 13 AI Evo
Intel Arc 8-Core iGPU, Intel Core Ultra 7 155H
2018 Points -51%
Dell XPS 13 Plus 9320 Core i7-1360P
Intel Iris Xe Graphics G7 96EUs, Intel Core i7-1360P
1791 Points -56%
Dell XPS 13 Plus 9320 i7-1280P OLED
Intel Iris Xe Graphics G7 96EUs, Intel Core i7-1280P
1760 Points -57%
Dell XPS 13 Plus 9320 4K
Intel Iris Xe Graphics G7 96EUs, Intel Core i7-1260P
1758 Points -57%
HP Dragonfly G4
Intel Iris Xe Graphics G7 96EUs, Intel Core i7-1365U
1579 Points -62%
Asus ZenBook S13 OLED UX5304
Intel Iris Xe Graphics G7 96EUs, Intel Core i7-1355U
1505 Points -63%
Lenovo Yoga 6 13 83B2001SGE
AMD Radeon RX Vega 8 (Ryzen 4000/5000), AMD Ryzen 7 7730U
1283 Points -69%
Dell XPS 13 Plus 9320 i5-1240p
Intel Iris Xe Graphics G7 80EUs, Intel Core i5-1240P
1134 Points -72%
Lenovo ThinkBook 13s G3 20YA0005GE
AMD Radeon RX Vega 8 (Ryzen 4000/5000), AMD Ryzen 7 5800U
1066 Points -74%
Dell XPS 13 9315, i5-1230U
Intel Iris Xe Graphics G7 80EUs, Intel Core i5-1230U
945 Points -77%
Dell XPS 13 9315 2-in-1 Core i5-1230U
Intel Iris Xe Graphics G7 80EUs, Intel Core i5-1230U
936 Points -77%
2560x1440 Time Spy Score
Dell XPS 13 9350
Intel Arc Graphics 140V, Intel Core Ultra 7 256V
4354 Points
Усредн. модель с Intel Arc Graphics 140V
  (3336 - 4502, n=9)
4158 Points -5%
Asus Zenbook S 14 UX5406
Intel Arc Graphics 140V, Intel Core Ultra 7 258V
3857 Points -11%
HP EliteBook x360 1040 G11
Intel Arc 8-Core iGPU, Intel Core Ultra 7 165H
3807 Points -13%
Lenovo ThinkBook 13x G4 21KR0008GE
Intel Arc 7-Core iGPU, Intel Core Ultra 5 125H
3498 Points -20%
Dell XPS 13 9340 Core Ultra 7
Intel Arc 8-Core iGPU, Intel Core Ultra 7 155H
3106 Points -29%
Framework Laptop 13.5 Ryzen 7 7840U
AMD Radeon 780M, AMD Ryzen 7 7840U
2891 Points -34%
Asus Zenbook S 13 OLED
AMD Radeon 680M, AMD Ryzen 7 6800U
2548 Points -41%
MSI Prestige 13 AI Evo
Intel Arc 8-Core iGPU, Intel Core Ultra 7 155H
2178 Points -50%
Dell XPS 13 Plus 9320 Core i7-1360P
Intel Iris Xe Graphics G7 96EUs, Intel Core i7-1360P
2021 Points -54%
Dell XPS 13 Plus 9320 i7-1280P OLED
Intel Iris Xe Graphics G7 96EUs, Intel Core i7-1280P
1986 Points -54%
Dell XPS 13 Plus 9320 4K
Intel Iris Xe Graphics G7 96EUs, Intel Core i7-1260P
1974 Points -55%
HP Dragonfly G4
Intel Iris Xe Graphics G7 96EUs, Intel Core i7-1365U
1768 Points -59%
Asus ZenBook S13 OLED UX5304
Intel Iris Xe Graphics G7 96EUs, Intel Core i7-1355U
1683 Points -61%
Lenovo Yoga 6 13 83B2001SGE
AMD Radeon RX Vega 8 (Ryzen 4000/5000), AMD Ryzen 7 7730U
1456 Points -67%
Dell XPS 13 Plus 9320 i5-1240p
Intel Iris Xe Graphics G7 80EUs, Intel Core i5-1240P
1290 Points -70%
Lenovo ThinkBook 13s G3 20YA0005GE
AMD Radeon RX Vega 8 (Ryzen 4000/5000), AMD Ryzen 7 5800U
1212 Points -72%
Dell XPS 13 9315 2-in-1 Core i5-1230U
Intel Iris Xe Graphics G7 80EUs, Intel Core i5-1230U
1055 Points -76%
Dell XPS 13 9315, i5-1230U
Intel Iris Xe Graphics G7 80EUs, Intel Core i5-1230U
1053 Points -76%
3DMark 11 Performance
11161 баллов
3DMark Cloud Gate Standard Score
33853 баллов
3DMark Fire Strike Score
8730 баллов
3DMark Time Spy Score
4354 баллов
3DMark Steel Nomad Score
580 баллов
?
Blender
v3.3 Classroom HIP/AMD
Lenovo Yoga 6 13 83B2001SGE
AMD Radeon RX Vega 8 (Ryzen 4000/5000), AMD Ryzen 7 7730U
634 Seconds *
v3.3 Classroom CPU
Dell XPS 13 9315 2-in-1 Core i5-1230U
Intel Iris Xe Graphics G7 80EUs, Intel Core i5-1230U
1023 Seconds * -76%
Asus ZenBook S13 OLED UX5304
Intel Iris Xe Graphics G7 96EUs, Intel Core i7-1355U
839 Seconds * -45%
HP Dragonfly G4
Intel Iris Xe Graphics G7 96EUs, Intel Core i7-1365U
796 Seconds * -37%
Asus Zenbook S 14 UX5406
Intel Arc Graphics 140V, Intel Core Ultra 7 258V
700 Seconds * -21%
Lenovo ThinkBook 13x G4 21KR0008GE
Intel Arc 7-Core iGPU, Intel Core Ultra 5 125H
667 Seconds * -15%
Lenovo Yoga 6 13 83B2001SGE
AMD Radeon RX Vega 8 (Ryzen 4000/5000), AMD Ryzen 7 7730U
648 Seconds * -12%
MSI Prestige 13 AI Evo
Intel Arc 8-Core iGPU, Intel Core Ultra 7 155H
637 Seconds * -10%
Dell XPS 13 Plus 9320 4K
Intel Iris Xe Graphics G7 96EUs, Intel Core i7-1260P
598 Seconds * -3%
Усредн. модель с Intel Arc Graphics 140V
  (532 - 700, n=7)
583 Seconds * -1%
Dell XPS 13 9350
Intel Arc Graphics 140V, Intel Core Ultra 7 256V
580 Seconds *
Dell XPS 13 Plus 9320 i7-1280P OLED
Intel Iris Xe Graphics G7 96EUs, Intel Core i7-1280P
537 Seconds * +7%
Dell XPS 13 Plus 9320 Core i7-1360P
Intel Iris Xe Graphics G7 96EUs, Intel Core i7-1360P
531 Seconds * +8%
Dell XPS 13 9340 Core Ultra 7
Intel Arc 8-Core iGPU, Intel Core Ultra 7 155H
481 Seconds * +17%
HP EliteBook x360 1040 G11
Intel Arc 8-Core iGPU, Intel Core Ultra 7 165H
406 Seconds * +30%
Framework Laptop 13.5 Ryzen 7 7840U
AMD Radeon 780M, AMD Ryzen 7 7840U
371 Seconds * +36%
v3.3 Classroom oneAPI/Intel
HP EliteBook x360 1040 G11
Intel Arc 8-Core iGPU, Intel Core Ultra 7 165H
213 Seconds * -1%
Усредн. модель с Intel Arc Graphics 140V
  (210 - 217, n=5)
212 Seconds * -0%
Dell XPS 13 9350
Intel Arc Graphics 140V, Intel Core Ultra 7 256V
211 Seconds *

* ... меньше = лучше

Игровая производительность

Производительность в играх выросла больше, чем ожидалось, по сравнению с XPS 13 9340 и его процессором Core Ultra H-серии с графикой Arc 8. В этом случае наш Arc 140V почти постоянно превосходит XPS 13 9340 на 10 процентов или на 85 процентов в зависимости от игры и настроек. Более высокие отклонения наблюдаются при запуске таких игр, как GTA V или F1 22 на высоких настройках, в то время как меньшие отклонения наблюдаются при запуске DOTA 2 Reborn или Baldur's Gate 3. Средние результаты сопоставимы с конкурирующими Radeon 780M для тех, кто переходит с более старого ноутбука с Iris Xe 96 EUs, это будет огромным скачком.

Однако не все игры работают идеально. Наша система всегда падала при запуске Tiny Tina's Wonderlands или F1 22 с включенными определенными графическими настройками.

Performance Rating - Percent
Dell XPS 13 9350
Intel Core Ultra 7 256V, Intel Arc Graphics 140V
96.7 pt
Lenovo ThinkBook 13x G4 21KR0008GE -1!
Intel Core Ultra 5 125H, Intel Arc 7-Core iGPU
77.1 pt
Dell XPS 13 Plus 9320 i7-1280P OLED -1!
Intel Core i7-1280P, Intel Iris Xe Graphics G7 96EUs
64.9 pt
MSI Prestige 13 AI Evo -1!
Intel Core Ultra 7 155H, Intel Arc 8-Core iGPU
59.9 pt
HP Dragonfly G4 -1!
Intel Core i7-1365U, Intel Iris Xe Graphics G7 96EUs
55.5 pt
Asus ZenBook S13 OLED UX5304 -1!
Intel Core i7-1355U, Intel Iris Xe Graphics G7 96EUs
52.1 pt
Baldur's Gate 3 - 1920x1080 Ultra Preset
Dell XPS 13 9350
Intel Core Ultra 7 256V, Intel Arc Graphics 140V
25.7 fps
GTA V - 1920x1080 Highest Settings possible AA:4xMSAA + FX AF:16x
Dell XPS 13 9350
Intel Core Ultra 7 256V, Intel Arc Graphics 140V
25.6 (2.46min, 19.6P1) fps
Lenovo ThinkBook 13x G4 21KR0008GE
Intel Core Ultra 5 125H, Intel Arc 7-Core iGPU
14.8 (1.279min, 5.78P1) fps -42%
Dell XPS 13 Plus 9320 i7-1280P OLED
Intel Core i7-1280P, Intel Iris Xe Graphics G7 96EUs
11.5 (4.27min, 7.69P1) fps -55%
HP Dragonfly G4
Intel Core i7-1365U, Intel Iris Xe Graphics G7 96EUs
10.1 (4.85min, 6.29P1) fps -61%
MSI Prestige 13 AI Evo
Intel Core Ultra 7 155H, Intel Arc 8-Core iGPU
9.97 (1.989min, 4.98P1) fps -61%
Asus ZenBook S13 OLED UX5304
Intel Core i7-1355U, Intel Iris Xe Graphics G7 96EUs
9.42 (3.26min, 5.92P1) fps -63%
Final Fantasy XV Benchmark - 1920x1080 High Quality
Dell XPS 13 9350
Intel Core Ultra 7 256V, Intel Arc Graphics 140V
31.5 fps
Lenovo ThinkBook 13x G4 21KR0008GE
Intel Core Ultra 5 125H, Intel Arc 7-Core iGPU
25.3 fps -20%
Dell XPS 13 Plus 9320 i7-1280P OLED
Intel Core i7-1280P, Intel Iris Xe Graphics G7 96EUs
17.6 fps -44%
MSI Prestige 13 AI Evo
Intel Core Ultra 7 155H, Intel Arc 8-Core iGPU
17 fps -46%
HP Dragonfly G4
Intel Core i7-1365U, Intel Iris Xe Graphics G7 96EUs
16.4 fps -48%
Asus ZenBook S13 OLED UX5304
Intel Core i7-1355U, Intel Iris Xe Graphics G7 96EUs
14.9 fps -53%
Strange Brigade - 1920x1080 ultra AA:ultra AF:16
Dell XPS 13 9350
Intel Core Ultra 7 256V, Intel Arc Graphics 140V
58 (24.7min, 30.7P1) fps
Lenovo ThinkBook 13x G4 21KR0008GE
Intel Core Ultra 5 125H, Intel Arc 7-Core iGPU
44 fps -24%
MSI Prestige 13 AI Evo
Intel Core Ultra 7 155H, Intel Arc 8-Core iGPU
32 fps -45%
Dell XPS 13 Plus 9320 i7-1280P OLED
Intel Core i7-1280P, Intel Iris Xe Graphics G7 96EUs
29.6 (9min, 10.7P1) fps -49%
HP Dragonfly G4
Intel Core i7-1365U, Intel Iris Xe Graphics G7 96EUs
24.7 (5.3min, 6.86P1) fps -57%
Asus ZenBook S13 OLED UX5304
Intel Core i7-1355U, Intel Iris Xe Graphics G7 96EUs
23.6 (5min, 6.37P1) fps -59%
Dota 2 Reborn - 1920x1080 ultra (3/3) best looking
Dell XPS 13 9350
Intel Core Ultra 7 256V, Intel Arc Graphics 140V
80.7 (52.1min) fps
Lenovo ThinkBook 13x G4 21KR0008GE
Intel Core Ultra 5 125H, Intel Arc 7-Core iGPU
64.9 (45.5min) fps -20%
Dell XPS 13 Plus 9320 i7-1280P OLED
Intel Core i7-1280P, Intel Iris Xe Graphics G7 96EUs
58.7 (50.7min) fps -27%
HP Dragonfly G4
Intel Core i7-1365U, Intel Iris Xe Graphics G7 96EUs
53.3 (44.9min) fps -34%
MSI Prestige 13 AI Evo
Intel Core Ultra 7 155H, Intel Arc 8-Core iGPU
53.3 (34.3min) fps -34%
Asus ZenBook S13 OLED UX5304
Intel Core i7-1355U, Intel Iris Xe Graphics G7 96EUs
51.1 (42.7min) fps -37%
X-Plane 11.11 - 1920x1080 high (fps_test=3)
Dell XPS 13 Plus 9320 i7-1280P OLED
Intel Core i7-1280P, Intel Iris Xe Graphics G7 96EUs
37.6 fps +25%
Lenovo ThinkBook 13x G4 21KR0008GE
Intel Core Ultra 5 125H, Intel Arc 7-Core iGPU
34.2 fps +14%
MSI Prestige 13 AI Evo
Intel Core Ultra 7 155H, Intel Arc 8-Core iGPU
32.1 fps +7%
Dell XPS 13 9350
Intel Core Ultra 7 256V, Intel Arc Graphics 140V
30.1 fps
HP Dragonfly G4
Intel Core i7-1365U, Intel Iris Xe Graphics G7 96EUs
29.1 fps -3%
Asus ZenBook S13 OLED UX5304
Intel Core i7-1355U, Intel Iris Xe Graphics G7 96EUs
27.3 fps -9%
Baldur's Gate 3
1280x720 Low Preset
Усредн. модель с Intel Arc Graphics 140V
  (49.3 - 66.4, n=5)
56.9 fps +10%
Dell XPS 13 9350
Intel Core Ultra 7 256V, Intel Arc Graphics 140V
51.7 fps
HP EliteBook x360 1040 G11
Intel Core Ultra 7 165H, Intel Arc 8-Core iGPU
42.2 fps -18%
1920x1080 Low Preset
Усредн. модель с Intel Arc Graphics 140V
  (23.7 - 43, n=12)
36.9 fps +1%
Dell XPS 13 9350
Intel Core Ultra 7 256V, Intel Arc Graphics 140V
36.6 fps
Asus Zenbook S 14 UX5406
Intel Core Ultra 7 258V, Intel Arc Graphics 140V
34.2 fps -7%
HP EliteBook x360 1040 G11
Intel Core Ultra 7 165H, Intel Arc 8-Core iGPU
29.3 fps -20%
1920x1080 Medium Preset
Dell XPS 13 9350
Intel Core Ultra 7 256V, Intel Arc Graphics 140V
30.5 fps
Усредн. модель с Intel Arc Graphics 140V
  (19.6 - 33.7, n=12)
29.9 fps -2%
Asus Zenbook S 14 UX5406
Intel Core Ultra 7 258V, Intel Arc Graphics 140V
26.3 fps -14%
HP EliteBook x360 1040 G11
Intel Core Ultra 7 165H, Intel Arc 8-Core iGPU
24.2 fps -21%
1920x1080 High Preset
Усредн. модель с Intel Arc Graphics 140V
  (17 - 30, n=12)
26.7 fps +3%
Dell XPS 13 9350
Intel Core Ultra 7 256V, Intel Arc Graphics 140V
25.8 fps
Asus Zenbook S 14 UX5406
Intel Core Ultra 7 258V, Intel Arc Graphics 140V
23.6 fps -9%
HP EliteBook x360 1040 G11
Intel Core Ultra 7 165H, Intel Arc 8-Core iGPU
21.4 fps -17%
1920x1080 Ultra Preset
Усредн. модель с Intel Arc Graphics 140V
  (16.6 - 29.5, n=12)
25.9 fps +1%
Dell XPS 13 9350
Intel Core Ultra 7 256V, Intel Arc Graphics 140V
25.7 fps
Asus Zenbook S 14 UX5406
Intel Core Ultra 7 258V, Intel Arc Graphics 140V
23 fps -11%
HP EliteBook x360 1040 G11
Intel Core Ultra 7 165H, Intel Arc 8-Core iGPU
20.4 fps -21%
GTA V
1024x768 Lowest Settings possible
HP EliteBook x360 1040 G11
Intel Core Ultra 7 165H, Intel Arc 8-Core iGPU
162.9 (4.68min, 83.3P1) fps +5%
Dell XPS 13 9340 Core Ultra 7
Intel Core Ultra 7 155H, Intel Arc 8-Core iGPU
157.8 (4.43min, 83.3P1) fps +2%
Dell XPS 13 9350
Intel Core Ultra 7 256V, Intel Arc Graphics 140V
154.9 (4.26min, 83.3P1) fps
Усредн. модель с Intel Arc Graphics 140V
  (110.5 - 161.6, n=13)
145.2 fps -6%
Asus Zenbook S 13 OLED
AMD Ryzen 7 6800U, AMD Radeon 680M
136.1 (7.35min, 90.9P1) fps -12%
Dell XPS 13 Plus 9320 Core i7-1360P
Intel Core i7-1360P, Intel Iris Xe Graphics G7 96EUs
130.6 (21.7min, 71.4P1) fps -16%
Dell XPS 13 Plus 9320 i7-1280P OLED
Intel Core i7-1280P, Intel Iris Xe Graphics G7 96EUs
123.7 (11.7min, 76.9P1) fps -20%
Lenovo ThinkBook 13x G4 21KR0008GE
Intel Core Ultra 5 125H, Intel Arc 7-Core iGPU
116.9 (6min, 62.5P1) fps -25%
Dell XPS 13 Plus 9320 4K
Intel Core i7-1260P, Intel Iris Xe Graphics G7 96EUs
115.1 (17.6min, 76.9P1) fps -26%
Asus Zenbook S 14 UX5406
Intel Core Ultra 7 258V, Intel Arc Graphics 140V
114.4 (22.8min, 83.3P1) fps -26%
Lenovo Yoga 6 13 83B2001SGE
AMD Ryzen 7 7730U, AMD Radeon RX Vega 8 (Ryzen 4000/5000)
100.2 (6.7min, 66.7P1) fps -35%
HP Dragonfly G4
Intel Core i7-1365U, Intel Iris Xe Graphics G7 96EUs
99.8 (27min, 62.5P1) fps -36%
MSI Prestige 13 AI Evo
Intel Core Ultra 7 155H, Intel Arc 8-Core iGPU
99.1 (6.8min, 27.8P1) fps -36%
Asus ZenBook S13 OLED UX5304
Intel Core i7-1355U, Intel Iris Xe Graphics G7 96EUs
94.8 (19.3min, 55.6P1) fps -39%
Dell XPS 13 9315 2-in-1 Core i5-1230U
Intel Core i5-1230U, Intel Iris Xe Graphics G7 80EUs
60.9 (8.61min, 28.6P1) fps -61%
1920x1080 Lowest Settings possible
Dell XPS 13 9350
Intel Core Ultra 7 256V, Intel Arc Graphics 140V
146.7 (4.88min, 90.9P1) fps
Усредн. модель с Intel Arc Graphics 140V
  (135.2 - 158.4, n=6)
143.7 fps -2%
HP EliteBook x360 1040 G11
Intel Core Ultra 7 165H, Intel Arc 8-Core iGPU
142.8 (5.23min, 76.9P1) fps -3%
Dell XPS 13 Plus 9320 i7-1280P OLED
Intel Core i7-1280P, Intel Iris Xe Graphics G7 96EUs
101.7 (13.1min, 66.7P1) fps -31%
Dell XPS 13 Plus 9320 Core i7-1360P
Intel Core i7-1360P, Intel Iris Xe Graphics G7 96EUs
95.6 (11.2min, 52.6P1) fps -35%
HP Dragonfly G4
Intel Core i7-1365U, Intel Iris Xe Graphics G7 96EUs
78.8 (12.6min, 52.6P1) fps -46%
Lenovo Yoga 6 13 83B2001SGE
AMD Ryzen 7 7730U, AMD Radeon RX Vega 8 (Ryzen 4000/5000)
55.7 (11.4min, 40P1) fps -62%
Dell XPS 13 9315 2-in-1 Core i5-1230U
Intel Core i5-1230U, Intel Iris Xe Graphics G7 80EUs
36.2 (8.37min, 16.9P1) fps -75%
1366x768 Normal/Off AF:4x
HP EliteBook x360 1040 G11
Intel Core Ultra 7 165H, Intel Arc 8-Core iGPU
151.9 (4.24min, 71.4P1) fps +2%
Dell XPS 13 9350
Intel Core Ultra 7 256V, Intel Arc Graphics 140V
149.4 (4.38min, 90.9P1) fps
Усредн. модель с Intel Arc Graphics 140V
  (91.1 - 155.6, n=12)
133.6 fps -11%
Dell XPS 13 9340 Core Ultra 7
Intel Core Ultra 7 155H, Intel Arc 8-Core iGPU
129.8 (4.39min, 58.8P1) fps -13%
Asus Zenbook S 13 OLED
AMD Ryzen 7 6800U, AMD Radeon 680M
120.4 (8.21min, 76.9P1) fps -19%
Dell XPS 13 Plus 9320 i7-1280P OLED
Intel Core i7-1280P, Intel Iris Xe Graphics G7 96EUs
108.7 (12.4min, 62.5P1) fps -27%
Lenovo ThinkBook 13x G4 21KR0008GE
Intel Core Ultra 5 125H, Intel Arc 7-Core iGPU
106.4 (7.63min, 50P1) fps -29%
Dell XPS 13 Plus 9320 Core i7-1360P
Intel Core i7-1360P, Intel Iris Xe Graphics G7 96EUs
105.3 (6.65min, 55.6P1) fps -30%
Dell XPS 13 Plus 9320 4K
Intel Core i7-1260P, Intel Iris Xe Graphics G7 96EUs
102.1 (18.6min, 66.7P1) fps -32%
MSI Prestige 13 AI Evo
Intel Core Ultra 7 155H, Intel Arc 8-Core iGPU
93.8 (12.8min, 41.7P1) fps -37%
Asus Zenbook S 14 UX5406
Intel Core Ultra 7 258V, Intel Arc Graphics 140V
91.1 (10.1min, 66.7P1) fps -39%
Dell XPS 13 Plus 9320 i5-1240p
Intel Core i5-1240P, Intel Iris Xe Graphics G7 80EUs
91 fps -39%
Lenovo Yoga 6 13 83B2001SGE
AMD Ryzen 7 7730U, AMD Radeon RX Vega 8 (Ryzen 4000/5000)
86.3 (23.7min, 55.6P1) fps -42%
HP Dragonfly G4
Intel Core i7-1365U, Intel Iris Xe Graphics G7 96EUs
84.1 (9min, 47.6P1) fps -44%
Asus ZenBook S13 OLED UX5304
Intel Core i7-1355U, Intel Iris Xe Graphics G7 96EUs
81 (16.8min, 45.5P1) fps -46%
Dell XPS 13 9315 2-in-1 Core i5-1230U
Intel Core i5-1230U, Intel Iris Xe Graphics G7 80EUs
38.4 (8.67min, 21.3P1) fps -74%
Dell XPS 13 9315, i5-1230U
Intel Core i5-1230U, Intel Iris Xe Graphics G7 80EUs
31 fps -79%
1920x1080 Normal/Off AF:4x
Усредн. модель с Intel Arc Graphics 140V
  (120.6 - 152, n=6)
134.7 fps 0%
Dell XPS 13 9350
Intel Core Ultra 7 256V, Intel Arc Graphics 140V
134.2 (5.63min, 83.3P1) fps
HP EliteBook x360 1040 G11
Intel Core Ultra 7 165H, Intel Arc 8-Core iGPU
124.3 (10.4min, 58.8P1) fps -7%
Dell XPS 13 Plus 9320 i7-1280P OLED
Intel Core i7-1280P, Intel Iris Xe Graphics G7 96EUs
90.7 (13min, 55.6P1) fps -32%
Dell XPS 13 Plus 9320 Core i7-1360P
Intel Core i7-1360P, Intel Iris Xe Graphics G7 96EUs
90.3 (13.3min, 52.6P1) fps -33%
HP Dragonfly G4
Intel Core i7-1365U, Intel Iris Xe Graphics G7 96EUs
70.6 (16.1min, 43.5P1) fps -47%
Lenovo Yoga 6 13 83B2001SGE
AMD Ryzen 7 7730U, AMD Radeon RX Vega 8 (Ryzen 4000/5000)
55.2 (15.5min, 38.5P1) fps -59%
Dell XPS 13 9315 2-in-1 Core i5-1230U
Intel Core i5-1230U, Intel Iris Xe Graphics G7 80EUs
30 (8.55min, 15.4P1) fps -78%
1920x1080 High/On (Advanced Graphics Off) AA:2xMSAA + FX AF:8x
Dell XPS 13 9350
Intel Core Ultra 7 256V, Intel Arc Graphics 140V
60.8 (2.26min, 43.5P1) fps
Усредн. модель с Intel Arc Graphics 140V
  (32 - 67.4, n=12)
58.8 fps -3%
Asus Zenbook S 14 UX5406
Intel Core Ultra 7 258V, Intel Arc Graphics 140V
47.1 (3.06min, 25.6P1) fps -23%
Asus Zenbook S 13 OLED
AMD Ryzen 7 6800U, AMD Radeon 680M
47 (6.64min, 31.3P1) fps -23%
HP EliteBook x360 1040 G11
Intel Core Ultra 7 165H, Intel Arc 8-Core iGPU
43.2 (2.29min, 25.6P1) fps -29%
Dell XPS 13 9340 Core Ultra 7
Intel Core Ultra 7 155H, Intel Arc 8-Core iGPU
32.8 (2.29min, 20.8P1) fps -46%
Lenovo ThinkBook 13x G4 21KR0008GE
Intel Core Ultra 5 125H, Intel Arc 7-Core iGPU
32.4 (1.526min, 12P1) fps -47%
Dell XPS 13 Plus 9320 i5-1240p
Intel Core i5-1240P, Intel Iris Xe Graphics G7 80EUs
32 fps -47%
Dell XPS 13 Plus 9320 i7-1280P OLED
Intel Core i7-1280P, Intel Iris Xe Graphics G7 96EUs
27.6 (7.19min, 18.5P1) fps -55%
Lenovo Yoga 6 13 83B2001SGE
AMD Ryzen 7 7730U, AMD Radeon RX Vega 8 (Ryzen 4000/5000)
26.9 (9.64min, 19.2P1) fps -56%
Dell XPS 13 Plus 9320 Core i7-1360P
Intel Core i7-1360P, Intel Iris Xe Graphics G7 96EUs
26.6 (7.8min, 18.5P1) fps -56%
Dell XPS 13 Plus 9320 4K
Intel Core i7-1260P, Intel Iris Xe Graphics G7 96EUs
26.2 (8.16min, 20P1) fps -57%
MSI Prestige 13 AI Evo
Intel Core Ultra 7 155H, Intel Arc 8-Core iGPU
26.2 (5.31min, 15.6P1) fps -57%
HP Dragonfly G4
Intel Core i7-1365U, Intel Iris Xe Graphics G7 96EUs
23.4 (10.4min, 16.1P1) fps -62%
Asus ZenBook S13 OLED UX5304
Intel Core i7-1355U, Intel Iris Xe Graphics G7 96EUs
22.5 (6.83min, 13.9P1) fps -63%
Dell XPS 13 9315 2-in-1 Core i5-1230U
Intel Core i5-1230U, Intel Iris Xe Graphics G7 80EUs
11.7 (3.09min, 5.59P1) fps -81%
Dell XPS 13 9315, i5-1230U
Intel Core i5-1230U, Intel Iris Xe Graphics G7 80EUs
10 fps -84%
1920x1080 Highest Settings possible AA:4xMSAA + FX AF:16x
Dell XPS 13 9350
Intel Core Ultra 7 256V, Intel Arc Graphics 140V
25.6 (2.46min, 19.6P1) fps
Усредн. модель с Intel Arc Graphics 140V
  (15.4 - 28.4, n=12)
25 fps -2%
Asus Zenbook S 14 UX5406
Intel Core Ultra 7 258V, Intel Arc Graphics 140V
23.4 (2.44min, 13.3P1) fps -9%
Asus Zenbook S 13 OLED
AMD Ryzen 7 6800U, AMD Radeon 680M
21.3 (3.35min, 14.5P1) fps -17%
HP EliteBook x360 1040 G11
Intel Core Ultra 7 165H, Intel Arc 8-Core iGPU
17.1 (1.72min, 12.3P1) fps -33%
Lenovo ThinkBook 13x G4 21KR0008GE
Intel Core Ultra 5 125H, Intel Arc 7-Core iGPU
14.8 (1.279min, 5.78P1) fps -42%
Dell XPS 13 9340 Core Ultra 7
Intel Core Ultra 7 155H, Intel Arc 8-Core iGPU
14.7 (2.21min, 10.8P1) fps -43%
Lenovo Yoga 6 13 83B2001SGE
AMD Ryzen 7 7730U, AMD Radeon RX Vega 8 (Ryzen 4000/5000)
12.3 (1.009min, 8.2P1) fps -52%
Dell XPS 13 Plus 9320 Core i7-1360P
Intel Core i7-1360P, Intel Iris Xe Graphics G7 96EUs
11.6 (4.4min, 6.99P1) fps -55%
Dell XPS 13 Plus 9320 i7-1280P OLED
Intel Core i7-1280P, Intel Iris Xe Graphics G7 96EUs
11.5 (4.27min, 7.69P1) fps -55%
Dell XPS 13 Plus 9320 4K
Intel Core i7-1260P, Intel Iris Xe Graphics G7 96EUs
11 (4.3min, 8.62P1) fps -57%
HP Dragonfly G4
Intel Core i7-1365U, Intel Iris Xe Graphics G7 96EUs
10.1 (4.85min, 6.29P1) fps -61%
MSI Prestige 13 AI Evo
Intel Core Ultra 7 155H, Intel Arc 8-Core iGPU
9.97 (1.989min, 4.98P1) fps -61%
Asus ZenBook S13 OLED UX5304
Intel Core i7-1355U, Intel Iris Xe Graphics G7 96EUs
9.42 (3.26min, 5.92P1) fps -63%
Dell XPS 13 9315 2-in-1 Core i5-1230U
Intel Core i5-1230U, Intel Iris Xe Graphics G7 80EUs
6.06 (1.275min, 2.14P1) fps -76%
Dota 2 Reborn
1280x720 min (0/3) fastest
Framework Laptop 13.5 Ryzen 7 7840U
AMD Ryzen 7 7840U, AMD Radeon 780M
154.1 (129.7min) fps +61%
Dell XPS 13 Plus 9320 i5-1240p
Intel Core i5-1240P, Intel Iris Xe Graphics G7 80EUs
134.4 (81.4min) fps +40%
Dell XPS 13 Plus 9320 Core i7-1360P
Intel Core i7-1360P, Intel Iris Xe Graphics G7 96EUs
125.6 (99.1min) fps +31%
Lenovo ThinkBook 13s G3 20YA0005GE
AMD Ryzen 7 5800U, AMD Radeon RX Vega 8 (Ryzen 4000/5000)
113 (99.1min) fps +18%
Asus Zenbook S 13 OLED
AMD Ryzen 7 6800U, AMD Radeon 680M
111.2 (95.4min) fps +16%
Dell XPS 13 Plus 9320 i7-1280P OLED
Intel Core i7-1280P, Intel Iris Xe Graphics G7 96EUs
110.3 (87.2min) fps +15%
Dell XPS 13 Plus 9320 4K
Intel Core i7-1260P, Intel Iris Xe Graphics G7 96EUs
109.9 (88.7min) fps +15%
Dell XPS 13 9340 Core Ultra 7
Intel Core Ultra 7 155H, Intel Arc 8-Core iGPU
106.2 (58min) fps +11%
Lenovo Yoga 6 13 83B2001SGE
AMD Ryzen 7 7730U, AMD Radeon RX Vega 8 (Ryzen 4000/5000)
103.2 (89.7min) fps +8%
HP Dragonfly G4
Intel Core i7-1365U, Intel Iris Xe Graphics G7 96EUs
101.4 (80.9min) fps +6%
Dell XPS 13 9315 2-in-1 Core i5-1230U
Intel Core i5-1230U, Intel Iris Xe Graphics G7 80EUs
101.2 (80.9min) fps +6%
HP EliteBook x360 1040 G11
Intel Core Ultra 7 165H, Intel Arc 8-Core iGPU
100.3 (58.7min) fps +5%
Усредн. модель с Intel Arc Graphics 140V
  (89.8 - 116.9, n=12)
100.1 fps +4%
Dell XPS 13 9350
Intel Core Ultra 7 256V, Intel Arc Graphics 140V
95.8 (61.3min) fps
Lenovo ThinkBook 13x G4 21KR0008GE
Intel Core Ultra 5 125H, Intel Arc 7-Core iGPU
93.8 (59.9min) fps -2%
Asus Zenbook S 14 UX5406
Intel Core Ultra 7 258V, Intel Arc Graphics 140V
93.1 (52.1min) fps -3%
MSI Prestige 13 AI Evo
Intel Core Ultra 7 155H, Intel Arc 8-Core iGPU
89.9 (53min) fps -6%
Asus ZenBook S13 OLED UX5304
Intel Core i7-1355U, Intel Iris Xe Graphics G7 96EUs
84.8 (65.2min) fps -11%
1366x768 med (1/3)
Dell XPS 13 Plus 9320 i5-1240p
Intel Core i5-1240P, Intel Iris Xe Graphics G7 80EUs
119.5 (103.4min) fps +37%
Framework Laptop 13.5 Ryzen 7 7840U
AMD Ryzen 7 7840U, AMD Radeon 780M
119.3 (97.9min) fps +37%
Dell XPS 13 Plus 9320 Core i7-1360P
Intel Core i7-1360P, Intel Iris Xe Graphics G7 96EUs
97.7 (75.8min) fps +12%
Asus Zenbook S 13 OLED
AMD Ryzen 7 6800U, AMD Radeon 680M
96.9 (79.9min) fps +11%
HP EliteBook x360 1040 G11
Intel Core Ultra 7 165H, Intel Arc 8-Core iGPU
94 (34.1min) fps +8%
Dell XPS 13 9340 Core Ultra 7
Intel Core Ultra 7 155H, Intel Arc 8-Core iGPU
89.8 (52.9min) fps +3%
Lenovo ThinkBook 13s G3 20YA0005GE
AMD Ryzen 7 5800U, AMD Radeon RX Vega 8 (Ryzen 4000/5000)
88.4 (72.2min) fps +2%
Dell XPS 13 9350
Intel Core Ultra 7 256V, Intel Arc Graphics 140V
87 (55.1min) fps
Dell XPS 13 Plus 9320 i7-1280P OLED
Intel Core i7-1280P, Intel Iris Xe Graphics G7 96EUs
86.8 (68min) fps 0%
Lenovo Yoga 6 13 83B2001SGE
AMD Ryzen 7 7730U, AMD Radeon RX Vega 8 (Ryzen 4000/5000)
86.3 (76.6min) fps -1%
Dell XPS 13 Plus 9320 4K
Intel Core i7-1260P, Intel Iris Xe Graphics G7 96EUs
85.2 (68min) fps -2%
Усредн. модель с Intel Arc Graphics 140V
  (58 - 99.9, n=12)
84.3 fps -3%
Lenovo ThinkBook 13x G4 21KR0008GE
Intel Core Ultra 5 125H, Intel Arc 7-Core iGPU
83 (55.2min) fps -5%
HP Dragonfly G4
Intel Core i7-1365U, Intel Iris Xe Graphics G7 96EUs
76.3 (60.7min) fps -12%
MSI Prestige 13 AI Evo
Intel Core Ultra 7 155H, Intel Arc 8-Core iGPU
75.9 (14.5min) fps -13%
Dell XPS 13 9315 2-in-1 Core i5-1230U
Intel Core i5-1230U, Intel Iris Xe Graphics G7 80EUs
75.8 (62.3min) fps -13%
Asus ZenBook S13 OLED UX5304
Intel Core i7-1355U, Intel Iris Xe Graphics G7 96EUs
66.7 (50.3min) fps -23%
Asus Zenbook S 14 UX5406
Intel Core Ultra 7 258V, Intel Arc Graphics 140V
59.7 (31.7min) fps -31%
1920x1080 high (2/3)
Dell XPS 13 9350
Intel Core Ultra 7 256V, Intel Arc Graphics 140V
83 (35.8min) fps
HP EliteBook x360 1040 G11
Intel Core Ultra 7 165H, Intel Arc 8-Core iGPU
77.9 (45min) fps -6%
Усредн. модель с Intel Arc Graphics 140V
  (48.4 - 88.2, n=12)
77.4 fps -7%
Framework Laptop 13.5 Ryzen 7 7840U
AMD Ryzen 7 7840U, AMD Radeon 780M
76.2 (63.3min) fps -8%
Asus Zenbook S 13 OLED
AMD Ryzen 7 6800U, AMD Radeon 680M
72.3 (62.7min) fps -13%
Dell XPS 13 9340 Core Ultra 7
Intel Core Ultra 7 155H, Intel Arc 8-Core iGPU
72 (49.5min) fps -13%
Dell XPS 13 Plus 9320 i5-1240p
Intel Core i5-1240P, Intel Iris Xe Graphics G7 80EUs
70.9 (59.6min) fps -15%
Dell XPS 13 Plus 9320 Core i7-1360P
Intel Core i7-1360P, Intel Iris Xe Graphics G7 96EUs
68.7 (58.6min) fps -17%
Lenovo ThinkBook 13x G4 21KR0008GE
Intel Core Ultra 5 125H, Intel Arc 7-Core iGPU
68.4 (46.3min) fps -18%
Dell XPS 13 Plus 9320 4K
Intel Core i7-1260P, Intel Iris Xe Graphics G7 96EUs
68.2 (59.4min) fps -18%
Dell XPS 13 Plus 9320 i7-1280P OLED
Intel Core i7-1280P, Intel Iris Xe Graphics G7 96EUs
68.1 (57.9min) fps -18%
Asus Zenbook S 14 UX5406
Intel Core Ultra 7 258V, Intel Arc Graphics 140V
67.2 (29.2min) fps -19%
HP Dragonfly G4
Intel Core i7-1365U, Intel Iris Xe Graphics G7 96EUs
60.2 (49.5min) fps -27%
MSI Prestige 13 AI Evo
Intel Core Ultra 7 155H, Intel Arc 8-Core iGPU
57.7 (35.7min) fps -30%
Lenovo Yoga 6 13 83B2001SGE
AMD Ryzen 7 7730U, AMD Radeon RX Vega 8 (Ryzen 4000/5000)
56.4 (47.8min) fps -32%
Asus ZenBook S13 OLED UX5304
Intel Core i7-1355U, Intel Iris Xe Graphics G7 96EUs
54.9 (44.7min) fps -34%
Lenovo ThinkBook 13s G3 20YA0005GE
AMD Ryzen 7 5800U, AMD Radeon RX Vega 8 (Ryzen 4000/5000)
51.1 (46.2min) fps -38%
Dell XPS 13 9315 2-in-1 Core i5-1230U
Intel Core i5-1230U, Intel Iris Xe Graphics G7 80EUs
37.6 (35min) fps -55%
1920x1080 ultra (3/3) best looking
Dell XPS 13 9350
Intel Core Ultra 7 256V, Intel Arc Graphics 140V
80.7 (52.1min) fps
Усредн. модель с Intel Arc Graphics 140V
  (54.8 - 83, n=12)
75.4 fps -7%
HP EliteBook x360 1040 G11
Intel Core Ultra 7 165H, Intel Arc 8-Core iGPU
74.4 (47.1min) fps -8%
Framework Laptop 13.5 Ryzen 7 7840U
AMD Ryzen 7 7840U, AMD Radeon 780M
71.2 (59.4min) fps -12%
Dell XPS 13 Plus 9320 i5-1240p
Intel Core i5-1240P, Intel Iris Xe Graphics G7 80EUs
66.1 (49.7min) fps -18%
Dell XPS 13 9340 Core Ultra 7
Intel Core Ultra 7 155H, Intel Arc 8-Core iGPU
65.2 (48.8min) fps -19%
Lenovo ThinkBook 13x G4 21KR0008GE
Intel Core Ultra 5 125H, Intel Arc 7-Core iGPU
64.9 (45.5min) fps -20%
Asus Zenbook S 14 UX5406
Intel Core Ultra 7 258V, Intel Arc Graphics 140V
62.9 fps -22%
Asus Zenbook S 13 OLED
AMD Ryzen 7 6800U, AMD Radeon 680M
62.7 (53.2min) fps -22%
Dell XPS 13 Plus 9320 Core i7-1360P
Intel Core i7-1360P, Intel Iris Xe Graphics G7 96EUs
61.6 (52.9min) fps -24%
Dell XPS 13 Plus 9320 4K
Intel Core i7-1260P, Intel Iris Xe Graphics G7 96EUs
60.6 (52.5min) fps -25%
Dell XPS 13 Plus 9320 i7-1280P OLED
Intel Core i7-1280P, Intel Iris Xe Graphics G7 96EUs
58.7 (50.7min) fps -27%
HP Dragonfly G4
Intel Core i7-1365U, Intel Iris Xe Graphics G7 96EUs
53.3 (44.9min) fps -34%
MSI Prestige 13 AI Evo
Intel Core Ultra 7 155H, Intel Arc 8-Core iGPU
53.3 (34.3min) fps -34%
Asus ZenBook S13 OLED UX5304
Intel Core i7-1355U, Intel Iris Xe Graphics G7 96EUs
51.1 (42.7min) fps -37%
Lenovo Yoga 6 13 83B2001SGE
AMD Ryzen 7 7730U, AMD Radeon RX Vega 8 (Ryzen 4000/5000)
50.4 (44.6min) fps -38%
Lenovo ThinkBook 13s G3 20YA0005GE
AMD Ryzen 7 5800U, AMD Radeon RX Vega 8 (Ryzen 4000/5000)
47.5 (42.7min) fps -41%
Dell XPS 13 9315 2-in-1 Core i5-1230U
Intel Core i5-1230U, Intel Iris Xe Graphics G7 80EUs
34.2 (31.2min) fps -58%
Final Fantasy XV Benchmark
1280x720 Lite Quality
Усредн. модель с Intel Arc Graphics 140V
  (54.1 - 91, n=12)
80.1 fps +1%
Dell XPS 13 9350
Intel Core Ultra 7 256V, Intel Arc Graphics 140V
79.4 fps
Asus Zenbook S 14 UX5406
Intel Core Ultra 7 258V, Intel Arc Graphics 140V
75.6 fps -5%
HP EliteBook x360 1040 G11
Intel Core Ultra 7 165H, Intel Arc 8-Core iGPU
73.6 fps -7%
Framework Laptop 13.5 Ryzen 7 7840U
AMD Ryzen 7 7840U, AMD Radeon 780M
66.6 fps -16%
Dell XPS 13 9340 Core Ultra 7
Intel Core Ultra 7 155H, Intel Arc 8-Core iGPU
61.3 fps -23%
Asus Zenbook S 13 OLED
AMD Ryzen 7 6800U, AMD Radeon 680M
59.8 fps -25%
Lenovo ThinkBook 13x G4 21KR0008GE
Intel Core Ultra 5 125H, Intel Arc 7-Core iGPU
59.8 fps -25%
Dell XPS 13 Plus 9320 i7-1280P OLED
Intel Core i7-1280P, Intel Iris Xe Graphics G7 96EUs
46.1 fps -42%
Dell XPS 13 Plus 9320 4K
Intel Core i7-1260P, Intel Iris Xe Graphics G7 96EUs
44.7 fps -44%
Dell XPS 13 Plus 9320 Core i7-1360P
Intel Core i7-1360P, Intel Iris Xe Graphics G7 96EUs
44.5 fps -44%
MSI Prestige 13 AI Evo
Intel Core Ultra 7 155H, Intel Arc 8-Core iGPU
43.8 fps -45%
HP Dragonfly G4
Intel Core i7-1365U, Intel Iris Xe Graphics G7 96EUs
40.9 fps -48%
Lenovo ThinkBook 13s G3 20YA0005GE
AMD Ryzen 7 5800U, AMD Radeon RX Vega 8 (Ryzen 4000/5000)
39.1 fps -51%
Lenovo Yoga 6 13 83B2001SGE
AMD Ryzen 7 7730U, AMD Radeon RX Vega 8 (Ryzen 4000/5000)
38.7 fps -51%
Asus ZenBook S13 OLED UX5304
Intel Core i7-1355U, Intel Iris Xe Graphics G7 96EUs
37.4 fps -53%
Dell XPS 13 Plus 9320 i5-1240p
Intel Core i5-1240P, Intel Iris Xe Graphics G7 80EUs
36.3 fps -54%
Dell XPS 13 9315 2-in-1 Core i5-1230U
Intel Core i5-1230U, Intel Iris Xe Graphics G7 80EUs
27 fps -66%
Dell XPS 13 9315, i5-1230U
Intel Core i5-1230U, Intel Iris Xe Graphics G7 80EUs
18.9 fps -76%
1920x1080 Standard Quality
Dell XPS 13 9350
Intel Core Ultra 7 256V, Intel Arc Graphics 140V
46.1 fps
Усредн. модель с Intel Arc Graphics 140V
  (31.6 - 49.3, n=13)
44.3 fps -4%
Asus Zenbook S 14 UX5406
Intel Core Ultra 7 258V, Intel Arc Graphics 140V
40.9 fps -11%
HP EliteBook x360 1040 G11
Intel Core Ultra 7 165H, Intel Arc 8-Core iGPU
40.3 fps -13%
Dell XPS 13 9340 Core Ultra 7
Intel Core Ultra 7 155H, Intel Arc 8-Core iGPU
36.2 fps -21%
Framework Laptop 13.5 Ryzen 7 7840U
AMD Ryzen 7 7840U, AMD Radeon 780M
34.4 fps -25%
Lenovo ThinkBook 13x G4 21KR0008GE
Intel Core Ultra 5 125H, Intel Arc 7-Core iGPU
33.4 fps -28%
Asus Zenbook S 13 OLED
AMD Ryzen 7 6800U, AMD Radeon 680M
31.6 fps -31%
MSI Prestige 13 AI Evo
Intel Core Ultra 7 155H, Intel Arc 8-Core iGPU
28 fps -39%
Dell XPS 13 Plus 9320 4K
Intel Core i7-1260P, Intel Iris Xe Graphics G7 96EUs
25.3 fps -45%
Dell XPS 13 Plus 9320 i7-1280P OLED
Intel Core i7-1280P, Intel Iris Xe Graphics G7 96EUs
25.3 fps -45%
Dell XPS 13 Plus 9320 Core i7-1360P
Intel Core i7-1360P, Intel Iris Xe Graphics G7 96EUs
25.2 fps -45%
HP Dragonfly G4
Intel Core i7-1365U, Intel Iris Xe Graphics G7 96EUs
23.2 fps -50%
Asus ZenBook S13 OLED UX5304
Intel Core i7-1355U, Intel Iris Xe Graphics G7 96EUs
20.5 fps -56%
Dell XPS 13 Plus 9320 i5-1240p
Intel Core i5-1240P, Intel Iris Xe Graphics G7 80EUs
19.7 fps -57%
Lenovo ThinkBook 13s G3 20YA0005GE
AMD Ryzen 7 5800U, AMD Radeon RX Vega 8 (Ryzen 4000/5000)
18.8 fps -59%
Lenovo Yoga 6 13 83B2001SGE
AMD Ryzen 7 7730U, AMD Radeon RX Vega 8 (Ryzen 4000/5000)
17.7 fps -62%
Dell XPS 13 9315, i5-1230U
Intel Core i5-1230U, Intel Iris Xe Graphics G7 80EUs
10.8 fps -77%
1920x1080 High Quality
Dell XPS 13 9350
Intel Core Ultra 7 256V, Intel Arc Graphics 140V
31.5 fps
Усредн. модель с Intel Arc Graphics 140V
  (23 - 34.2, n=12)
31.3 fps -1%
Asus Zenbook S 14 UX5406
Intel Core Ultra 7 258V, Intel Arc Graphics 140V
30 fps -5%
HP EliteBook x360 1040 G11
Intel Core Ultra 7 165H, Intel Arc 8-Core iGPU
27.5 fps -13%
Dell XPS 13 9340 Core Ultra 7
Intel Core Ultra 7 155H, Intel Arc 8-Core iGPU
26.4 fps -16%
Framework Laptop 13.5 Ryzen 7 7840U
AMD Ryzen 7 7840U, AMD Radeon 780M
25.7 fps -18%
Dell XPS 13 Plus 9320 4K
Intel Core i7-1260P, Intel Iris Xe Graphics G7 96EUs
25.3 fps -20%
Lenovo ThinkBook 13x G4 21KR0008GE
Intel Core Ultra 5 125H, Intel Arc 7-Core iGPU
25.3 fps -20%
Asus Zenbook S 13 OLED
AMD Ryzen 7 6800U, AMD Radeon 680M
21.9 fps -30%
Dell XPS 13 Plus 9320 i7-1280P OLED
Intel Core i7-1280P, Intel Iris Xe Graphics G7 96EUs
17.6 fps -44%
Dell XPS 13 Plus 9320 Core i7-1360P
Intel Core i7-1360P, Intel Iris Xe Graphics G7 96EUs
17.5 fps -44%
MSI Prestige 13 AI Evo
Intel Core Ultra 7 155H, Intel Arc 8-Core iGPU
17 fps -46%
HP Dragonfly G4
Intel Core i7-1365U, Intel Iris Xe Graphics G7 96EUs
16.4 fps -48%
Asus ZenBook S13 OLED UX5304
Intel Core i7-1355U, Intel Iris Xe Graphics G7 96EUs
14.9 fps -53%
Lenovo Yoga 6 13 83B2001SGE
AMD Ryzen 7 7730U, AMD Radeon RX Vega 8 (Ryzen 4000/5000)
12.9 fps -59%
Lenovo ThinkBook 13s G3 20YA0005GE
AMD Ryzen 7 5800U, AMD Radeon RX Vega 8 (Ryzen 4000/5000)
12.7 fps -60%
Dell XPS 13 Plus 9320 i5-1240p
Intel Core i5-1240P, Intel Iris Xe Graphics G7 80EUs
11.7 fps -63%
Dell XPS 13 9315, i5-1230U
Intel Core i5-1230U, Intel Iris Xe Graphics G7 80EUs
5.24 fps -83%
X-Plane 11.11
1280x720 low (fps_test=1)
Framework Laptop 13.5 Ryzen 7 7840U
AMD Ryzen 7 7840U, AMD Radeon 780M
60 fps +27%
HP EliteBook x360 1040 G11
Intel Core Ultra 7 165H, Intel Arc 8-Core iGPU
58.7 fps +25%
Dell XPS 13 Plus 9320 4K
Intel Core i7-1260P, Intel Iris Xe Graphics G7 96EUs
55.5 fps +18%
Dell XPS 13 Plus 9320 i7-1280P OLED
Intel Core i7-1280P, Intel Iris Xe Graphics G7 96EUs
55.2 fps +17%
Dell XPS 13 9340 Core Ultra 7
Intel Core Ultra 7 155H, Intel Arc 8-Core iGPU
53 fps +13%
Lenovo ThinkBook 13x G4 21KR0008GE
Intel Core Ultra 5 125H, Intel Arc 7-Core iGPU
52 fps +10%
Усредн. модель с Intel Arc Graphics 140V
  (38.9 - 57, n=12)
49.3 fps +5%
MSI Prestige 13 AI Evo
Intel Core Ultra 7 155H, Intel Arc 8-Core iGPU
47.4 fps +1%
Dell XPS 13 9350
Intel Core Ultra 7 256V, Intel Arc Graphics 140V
47.1 fps
Asus Zenbook S 13 OLED
AMD Ryzen 7 6800U, AMD Radeon 680M
46.9 fps 0%
Lenovo ThinkBook 13s G3 20YA0005GE
AMD Ryzen 7 5800U, AMD Radeon RX Vega 8 (Ryzen 4000/5000)
44.1 fps -6%
Dell XPS 13 Plus 9320 Core i7-1360P
Intel Core i7-1360P, Intel Iris Xe Graphics G7 96EUs
42.7 fps -9%
Lenovo Yoga 6 13 83B2001SGE
AMD Ryzen 7 7730U, AMD Radeon RX Vega 8 (Ryzen 4000/5000)
39.5 fps -16%
Asus Zenbook S 14 UX5406
Intel Core Ultra 7 258V, Intel Arc Graphics 140V
38.9 fps -17%
HP Dragonfly G4
Intel Core i7-1365U, Intel Iris Xe Graphics G7 96EUs
37.6 fps -20%
Asus ZenBook S13 OLED UX5304
Intel Core i7-1355U, Intel Iris Xe Graphics G7 96EUs
34.6 fps -27%
Dell XPS 13 9315 2-in-1 Core i5-1230U
Intel Core i5-1230U, Intel Iris Xe Graphics G7 80EUs
31.2 fps -34%
Dell XPS 13 Plus 9320 i5-1240p
Intel Core i5-1240P, Intel Iris Xe Graphics G7 80EUs
28.5 fps -39%
1920x1080 med (fps_test=2)
HP EliteBook x360 1040 G11
Intel Core Ultra 7 165H, Intel Arc 8-Core iGPU
47.6 fps +32%
Framework Laptop 13.5 Ryzen 7 7840U
AMD Ryzen 7 7840U, AMD Radeon 780M
44.4 fps +23%
Dell XPS 13 Plus 9320 4K
Intel Core i7-1260P, Intel Iris Xe Graphics G7 96EUs
42.9 fps +19%
Dell XPS 13 Plus 9320 i7-1280P OLED
Intel Core i7-1280P, Intel Iris Xe Graphics G7 96EUs
40.7 fps +13%
Dell XPS 13 9340 Core Ultra 7
Intel Core Ultra 7 155H, Intel Arc 8-Core iGPU
40.7 fps +13%
Lenovo ThinkBook 13x G4 21KR0008GE
Intel Core Ultra 5 125H, Intel Arc 7-Core iGPU
40.1 fps +11%
Asus Zenbook S 13 OLED
AMD Ryzen 7 6800U, AMD Radeon 680M
39.7 fps +10%
Усредн. модель с Intel Arc Graphics 140V
  (34.4 - 43.8, n=12)
39.5 fps +9%
MSI Prestige 13 AI Evo
Intel Core Ultra 7 155H, Intel Arc 8-Core iGPU
37.7 fps +4%
Dell XPS 13 Plus 9320 Core i7-1360P
Intel Core i7-1360P, Intel Iris Xe Graphics G7 96EUs
36.2 fps 0%
Dell XPS 13 9350
Intel Core Ultra 7 256V, Intel Arc Graphics 140V
36.1 fps
Asus Zenbook S 14 UX5406
Intel Core Ultra 7 258V, Intel Arc Graphics 140V
35.1 fps -3%
Lenovo ThinkBook 13s G3 20YA0005GE
AMD Ryzen 7 5800U, AMD Radeon RX Vega 8 (Ryzen 4000/5000)
34.1 fps -6%
Asus ZenBook S13 OLED UX5304
Intel Core i7-1355U, Intel Iris Xe Graphics G7 96EUs
32.1 fps -11%
HP Dragonfly G4
Intel Core i7-1365U, Intel Iris Xe Graphics G7 96EUs
31.8 fps -12%
Lenovo Yoga 6 13 83B2001SGE
AMD Ryzen 7 7730U, AMD Radeon RX Vega 8 (Ryzen 4000/5000)
30.4 fps -16%
Dell XPS 13 9315 2-in-1 Core i5-1230U
Intel Core i5-1230U, Intel Iris Xe Graphics G7 80EUs
25.1 fps -30%
Dell XPS 13 Plus 9320 i5-1240p
Intel Core i5-1240P, Intel Iris Xe Graphics G7 80EUs
23.7 fps -34%
1920x1080 high (fps_test=3)
HP EliteBook x360 1040 G11
Intel Core Ultra 7 165H, Intel Arc 8-Core iGPU
40.5 fps +35%
Dell XPS 13 Plus 9320 i7-1280P OLED
Intel Core i7-1280P, Intel Iris Xe Graphics G7 96EUs
37.6 fps +25%
Framework Laptop 13.5 Ryzen 7 7840U
AMD Ryzen 7 7840U, AMD Radeon 780M
37.5 fps +25%
Dell XPS 13 Plus 9320 4K
Intel Core i7-1260P, Intel Iris Xe Graphics G7 96EUs
36.9 fps +23%
Lenovo ThinkBook 13x G4 21KR0008GE
Intel Core Ultra 5 125H, Intel Arc 7-Core iGPU
34.2 fps +14%
Усредн. модель с Intel Arc Graphics 140V
  (28.5 - 37.7, n=12)
34 fps +13%
Asus Zenbook S 13 OLED
AMD Ryzen 7 6800U, AMD Radeon 680M
33.6 fps +12%
Dell XPS 13 Plus 9320 Core i7-1360P
Intel Core i7-1360P, Intel Iris Xe Graphics G7 96EUs
33.2 fps +10%
MSI Prestige 13 AI Evo
Intel Core Ultra 7 155H, Intel Arc 8-Core iGPU
32.1 fps +7%
Dell XPS 13 9340 Core Ultra 7
Intel Core Ultra 7 155H, Intel Arc 8-Core iGPU
30.8 fps +2%
Dell XPS 13 9350
Intel Core Ultra 7 256V, Intel Arc Graphics 140V
30.1 fps
Asus Zenbook S 14 UX5406
Intel Core Ultra 7 258V, Intel Arc Graphics 140V
29.8 fps -1%
Lenovo ThinkBook 13s G3 20YA0005GE
AMD Ryzen 7 5800U, AMD Radeon RX Vega 8 (Ryzen 4000/5000)
29.5 fps -2%
HP Dragonfly G4
Intel Core i7-1365U, Intel Iris Xe Graphics G7 96EUs
29.1 fps -3%
Dell XPS 13 Plus 9320 i5-1240p
Intel Core i5-1240P, Intel Iris Xe Graphics G7 80EUs
28.8 fps -4%
Asus ZenBook S13 OLED UX5304
Intel Core i7-1355U, Intel Iris Xe Graphics G7 96EUs
27.3 fps -9%
Lenovo Yoga 6 13 83B2001SGE
AMD Ryzen 7 7730U, AMD Radeon RX Vega 8 (Ryzen 4000/5000)
26.7 fps -11%
Dell XPS 13 9315 2-in-1 Core i5-1230U
Intel Core i5-1230U, Intel Iris Xe Graphics G7 80EUs
22 fps -27%
Far Cry 5
1280x720 Low Preset AA:T
Усредн. модель с Intel Arc Graphics 140V
  (47 - 99, n=12)
82.8 fps +4%
Dell XPS 13 9350
Intel Core Ultra 7 256V, Intel Arc Graphics 140V
80 (42min) fps
Asus Zenbook S 14 UX5406
Intel Core Ultra 7 258V, Intel Arc Graphics 140V
76 fps -5%
Framework Laptop 13.5 Ryzen 7 7840U
AMD Ryzen 7 7840U, AMD Radeon 780M
74 (63min) fps -7%
Lenovo ThinkBook 13x G4 21KR0008GE
Intel Core Ultra 5 125H, Intel Arc 7-Core iGPU
64 fps -20%
Dell XPS 13 Plus 9320 i5-1240p
Intel Core i5-1240P, Intel Iris Xe Graphics G7 80EUs
61 fps -24%
Dell XPS 13 Plus 9320 4K
Intel Core i7-1260P, Intel Iris Xe Graphics G7 96EUs
59 fps -26%
Asus Zenbook S 13 OLED
AMD Ryzen 7 6800U, AMD Radeon 680M
57 fps -29%
Dell XPS 13 9340 Core Ultra 7
Intel Core Ultra 7 155H, Intel Arc 8-Core iGPU
57 fps -29%
HP EliteBook x360 1040 G11
Intel Core Ultra 7 165H, Intel Arc 8-Core iGPU
51 (17min) fps -36%
Lenovo Yoga 6 13 83B2001SGE
AMD Ryzen 7 7730U, AMD Radeon RX Vega 8 (Ryzen 4000/5000)
47 (24min) fps -41%
MSI Prestige 13 AI Evo
Intel Core Ultra 7 155H, Intel Arc 8-Core iGPU
47 fps -41%
Asus ZenBook S13 OLED UX5304
Intel Core i7-1355U, Intel Iris Xe Graphics G7 96EUs
42 fps -47%
Dell XPS 13 9315, i5-1230U
Intel Core i5-1230U, Intel Iris Xe Graphics G7 80EUs
22 (12min) fps -72%
1920x1080 Medium Preset AA:T
Dell XPS 13 9350
Intel Core Ultra 7 256V, Intel Arc Graphics 140V
52 (40min) fps
Усредн. модель с Intel Arc Graphics 140V
  (31 - 59, n=12)
49.5 fps -5%
Asus Zenbook S 14 UX5406
Intel Core Ultra 7 258V, Intel Arc Graphics 140V
46 fps -12%
Framework Laptop 13.5 Ryzen 7 7840U
AMD Ryzen 7 7840U, AMD Radeon 780M
39 (21min) fps -25%
Lenovo ThinkBook 13x G4 21KR0008GE
Intel Core Ultra 5 125H, Intel Arc 7-Core iGPU
37 fps -29%
Asus Zenbook S 13 OLED
AMD Ryzen 7 6800U, AMD Radeon 680M
36 fps -31%
HP EliteBook x360 1040 G11
Intel Core Ultra 7 165H, Intel Arc 8-Core iGPU
36 (2min) fps -31%
MSI Prestige 13 AI Evo
Intel Core Ultra 7 155H, Intel Arc 8-Core iGPU
33 fps -37%
Dell XPS 13 9340 Core Ultra 7
Intel Core Ultra 7 155H, Intel Arc 8-Core iGPU
33 fps -37%
Dell XPS 13 Plus 9320 4K
Intel Core i7-1260P, Intel Iris Xe Graphics G7 96EUs
32 fps -38%
Dell XPS 13 Plus 9320 i5-1240p
Intel Core i5-1240P, Intel Iris Xe Graphics G7 80EUs
28 fps -46%
Asus ZenBook S13 OLED UX5304
Intel Core i7-1355U, Intel Iris Xe Graphics G7 96EUs
25 fps -52%
Lenovo Yoga 6 13 83B2001SGE
AMD Ryzen 7 7730U, AMD Radeon RX Vega 8 (Ryzen 4000/5000)
23 (14min) fps -56%
Dell XPS 13 9315, i5-1230U
Intel Core i5-1230U, Intel Iris Xe Graphics G7 80EUs
14 (11min) fps -73%
1920x1080 High Preset AA:T
Dell XPS 13 9350
Intel Core Ultra 7 256V, Intel Arc Graphics 140V
45 (35min) fps
Усредн. модель с Intel Arc Graphics 140V
  (28 - 54, n=12)
44.8 fps 0%
Asus Zenbook S 14 UX5406
Intel Core Ultra 7 258V, Intel Arc Graphics 140V
42 fps -7%
Framework Laptop 13.5 Ryzen 7 7840U
AMD Ryzen 7 7840U, AMD Radeon 780M
37 (33min) fps -18%
Lenovo ThinkBook 13x G4 21KR0008GE
Intel Core Ultra 5 125H, Intel Arc 7-Core iGPU
35 fps -22%
HP EliteBook x360 1040 G11
Intel Core Ultra 7 165H, Intel Arc 8-Core iGPU
34 (14min) fps -24%
Asus Zenbook S 13 OLED
AMD Ryzen 7 6800U, AMD Radeon 680M
33 fps -27%
MSI Prestige 13 AI Evo
Intel Core Ultra 7 155H, Intel Arc 8-Core iGPU
31 fps -31%
Dell XPS 13 9340 Core Ultra 7
Intel Core Ultra 7 155H, Intel Arc 8-Core iGPU
30 fps -33%
Dell XPS 13 Plus 9320 4K
Intel Core i7-1260P, Intel Iris Xe Graphics G7 96EUs
29 fps -36%
Asus ZenBook S13 OLED UX5304
Intel Core i7-1355U, Intel Iris Xe Graphics G7 96EUs
24 fps -47%
Lenovo Yoga 6 13 83B2001SGE
AMD Ryzen 7 7730U, AMD Radeon RX Vega 8 (Ryzen 4000/5000)
21 (3min) fps -53%
1920x1080 Ultra Preset AA:T
Dell XPS 13 9350
Intel Core Ultra 7 256V, Intel Arc Graphics 140V
42 (32min) fps
Усредн. модель с Intel Arc Graphics 140V
  (26 - 49, n=12)
40.9 fps -3%
Asus Zenbook S 14 UX5406
Intel Core Ultra 7 258V, Intel Arc Graphics 140V
38 fps -10%
Framework Laptop 13.5 Ryzen 7 7840U
AMD Ryzen 7 7840U, AMD Radeon 780M
35 (29min) fps -17%
HP EliteBook x360 1040 G11
Intel Core Ultra 7 165H, Intel Arc 8-Core iGPU
32 (16min) fps -24%
Asus Zenbook S 13 OLED
AMD Ryzen 7 6800U, AMD Radeon 680M
31 fps -26%
Lenovo ThinkBook 13x G4 21KR0008GE
Intel Core Ultra 5 125H, Intel Arc 7-Core iGPU
31 fps -26%
MSI Prestige 13 AI Evo
Intel Core Ultra 7 155H, Intel Arc 8-Core iGPU
28 fps -33%
Dell XPS 13 9340 Core Ultra 7
Intel Core Ultra 7 155H, Intel Arc 8-Core iGPU
28 fps -33%
Dell XPS 13 Plus 9320 4K
Intel Core i7-1260P, Intel Iris Xe Graphics G7 96EUs
26 fps -38%
Asus ZenBook S13 OLED UX5304
Intel Core i7-1355U, Intel Iris Xe Graphics G7 96EUs
22 fps -48%
Lenovo Yoga 6 13 83B2001SGE
AMD Ryzen 7 7730U, AMD Radeon RX Vega 8 (Ryzen 4000/5000)
20 (5min) fps -52%
Strange Brigade
1280x720 lowest AF:1
Усредн. модель с Intel Arc Graphics 140V
  (138.1 - 236, n=10)
207 fps +3%
Dell XPS 13 9350
Intel Core Ultra 7 256V, Intel Arc Graphics 140V
201 (47.5min, 157.9P1) fps
Asus Zenbook S 14 UX5406
Intel Core Ultra 7 258V, Intel Arc Graphics 140V
196.8 (81.1min, 132.4P1) fps -2%
HP EliteBook x360 1040 G11
Intel Core Ultra 7 165H, Intel Arc 8-Core iGPU
178 (42.7min, 127.4P1) fps -11%
Dell XPS 13 9340 Core Ultra 7
Intel Core Ultra 7 155H, Intel Arc 8-Core iGPU
156 fps -22%
Lenovo ThinkBook 13x G4 21KR0008GE
Intel Core Ultra 5 125H, Intel Arc 7-Core iGPU
141 fps -30%
Framework Laptop 13.5 Ryzen 7 7840U
AMD Ryzen 7 7840U, AMD Radeon 780M
139.8 (37.5min, 114.3P1) fps -30%
Asus Zenbook S 13 OLED
AMD Ryzen 7 6800U, AMD Radeon 680M
125.1 (80.9min, 106.8P1) fps -38%
MSI Prestige 13 AI Evo
Intel Core Ultra 7 155H, Intel Arc 8-Core iGPU
121 fps -40%
Dell XPS 13 Plus 9320 i7-1280P OLED
Intel Core i7-1280P, Intel Iris Xe Graphics G7 96EUs
100.2 (22.5min, 36.9P1) fps -50%
Dell XPS 13 Plus 9320 4K
Intel Core i7-1260P, Intel Iris Xe Graphics G7 96EUs
95.2 (21min, 33.1P1) fps -53%
Dell XPS 13 Plus 9320 Core i7-1360P
Intel Core i7-1360P, Intel Iris Xe Graphics G7 96EUs
93.9 (20.3min, 37.7P1) fps -53%
HP Dragonfly G4
Intel Core i7-1365U, Intel Iris Xe Graphics G7 96EUs
88.8 (19.5min, 29.6P1) fps -56%
Asus ZenBook S13 OLED UX5304
Intel Core i7-1355U, Intel Iris Xe Graphics G7 96EUs
88.4 (19.8min, 31.6P1) fps -56%
Lenovo Yoga 6 13 83B2001SGE
AMD Ryzen 7 7730U, AMD Radeon RX Vega 8 (Ryzen 4000/5000)
86.4 (40.5min, 74.7P1) fps -57%
Dell XPS 13 Plus 9320 i5-1240p
Intel Core i5-1240P, Intel Iris Xe Graphics G7 80EUs
67.7 (15.5min, 23.7P1) fps -66%
Dell XPS 13 9315, i5-1230U
Intel Core i5-1230U, Intel Iris Xe Graphics G7 80EUs
47.5 (10.8min, 14.4P1) fps -76%
1920x1080 medium AA:medium AF:4
Dell XPS 13 9350
Intel Core Ultra 7 256V, Intel Arc Graphics 140V
84.4 (36.1min, 70.5P1) fps
HP EliteBook x360 1040 G11
Intel Core Ultra 7 165H, Intel Arc 8-Core iGPU
77.4 (25.7min, 64.2P1) fps -8%
Asus Zenbook S 14 UX5406
Intel Core Ultra 7 258V, Intel Arc Graphics 140V
77.4 (58.1min, 66.4P1) fps -8%
Усредн. модель с Intel Arc Graphics 140V
  (55.5 - 84.4, n=10)
75.6 fps -10%
Dell XPS 13 9340 Core Ultra 7
Intel Core Ultra 7 155H, Intel Arc 8-Core iGPU
68 fps -19%
Lenovo ThinkBook 13x G4 21KR0008GE
Intel Core Ultra 5 125H, Intel Arc 7-Core iGPU
68 fps -19%
Framework Laptop 13.5 Ryzen 7 7840U
AMD Ryzen 7 7840U, AMD Radeon 780M
59.7 (18.3min, 51.4P1) fps -29%
Asus Zenbook S 13 OLED
AMD Ryzen 7 6800U, AMD Radeon 680M
54.7 (25.4min, 48.7P1) fps -35%
MSI Prestige 13 AI Evo
Intel Core Ultra 7 155H, Intel Arc 8-Core iGPU
53 fps -37%
Dell XPS 13 Plus 9320 4K
Intel Core i7-1260P, Intel Iris Xe Graphics G7 96EUs
45.9 (21.6min, 25.1P1) fps -46%
Dell XPS 13 Plus 9320 i7-1280P OLED
Intel Core i7-1280P, Intel Iris Xe Graphics G7 96EUs
45.4 (16.6min, 25.1P1) fps -46%
Dell XPS 13 Plus 9320 Core i7-1360P
Intel Core i7-1360P, Intel Iris Xe Graphics G7 96EUs
43.8 (15.4min, 25.5P1) fps -48%
HP Dragonfly G4
Intel Core i7-1365U, Intel Iris Xe Graphics G7 96EUs
38.4 (17.6min, 22.1P1) fps -55%
Asus ZenBook S13 OLED UX5304
Intel Core i7-1355U, Intel Iris Xe Graphics G7 96EUs
37.8 (13.2min, 21.5P1) fps -55%
Lenovo Yoga 6 13 83B2001SGE
AMD Ryzen 7 7730U, AMD Radeon RX Vega 8 (Ryzen 4000/5000)
33.8 (18min, 29.4P1) fps -60%
Dell XPS 13 Plus 9320 i5-1240p
Intel Core i5-1240P, Intel Iris Xe Graphics G7 80EUs
30.7 (10.4min, 16.6P1) fps -64%
Dell XPS 13 9315, i5-1230U
Intel Core i5-1230U, Intel Iris Xe Graphics G7 80EUs
6 (5min, 5P1) fps -93%
1920x1080 high AA:high AF:8
Dell XPS 13 9350
Intel Core Ultra 7 256V, Intel Arc Graphics 140V
65.2 (28.3min, 51P1) fps
Asus Zenbook S 14 UX5406
Intel Core Ultra 7 258V, Intel Arc Graphics 140V
65.1 (39.9min, 50.6P1) fps 0%
Усредн. модель с Intel Arc Graphics 140V
  (45.3 - 70.1, n=10)
63.2 fps -3%
HP EliteBook x360 1040 G11
Intel Core Ultra 7 165H, Intel Arc 8-Core iGPU
61.7 (7min, 34.8P1) fps -5%
Dell XPS 13 9340 Core Ultra 7
Intel Core Ultra 7 155H, Intel Arc 8-Core iGPU
54 fps -17%
Lenovo ThinkBook 13x G4 21KR0008GE
Intel Core Ultra 5 125H, Intel Arc 7-Core iGPU
54 fps -17%
Framework Laptop 13.5 Ryzen 7 7840U
AMD Ryzen 7 7840U, AMD Radeon 780M
50.5 (17.2min, 27.8P1) fps -23%
Asus Zenbook S 13 OLED
AMD Ryzen 7 6800U, AMD Radeon 680M
46.6 (33.8min, 36.4P1) fps -29%
MSI Prestige 13 AI Evo
Intel Core Ultra 7 155H, Intel Arc 8-Core iGPU
41 fps -37%
Dell XPS 13 Plus 9320 i7-1280P OLED
Intel Core i7-1280P, Intel Iris Xe Graphics G7 96EUs
36.5 (18min, 19.9P1) fps -44%
Dell XPS 13 Plus 9320 4K
Intel Core i7-1260P, Intel Iris Xe Graphics G7 96EUs
36.4 (9.7min, 20.1P1) fps -44%
Dell XPS 13 Plus 9320 Core i7-1360P
Intel Core i7-1360P, Intel Iris Xe Graphics G7 96EUs
35.4 (5.4min, 17.4P1) fps -46%
HP Dragonfly G4
Intel Core i7-1365U, Intel Iris Xe Graphics G7 96EUs
30.4 (8.5min, 15.4P1) fps -53%
Asus ZenBook S13 OLED UX5304
Intel Core i7-1355U, Intel Iris Xe Graphics G7 96EUs
29.1 (8.4min, 14.7P1) fps -55%
Lenovo Yoga 6 13 83B2001SGE
AMD Ryzen 7 7730U, AMD Radeon RX Vega 8 (Ryzen 4000/5000)
27 (5.5min, 8.17P1) fps -59%
Dell XPS 13 Plus 9320 i5-1240p
Intel Core i5-1240P, Intel Iris Xe Graphics G7 80EUs
24.4 (8.4min, 13.2P1) fps -63%
Dell XPS 13 9315, i5-1230U
Intel Core i5-1230U, Intel Iris Xe Graphics G7 80EUs
17.8 (6.6min, 9.19P1) fps -73%
1920x1080 ultra AA:ultra AF:16
Dell XPS 13 9350
Intel Core Ultra 7 256V, Intel Arc Graphics 140V
58 (24.7min, 30.7P1) fps
Усредн. модель с Intel Arc Graphics 140V
  (39 - 62.5, n=10)
55.1 fps -5%
Asus Zenbook S 14 UX5406
Intel Core Ultra 7 258V, Intel Arc Graphics 140V
54 (32min, 42.8P1) fps -7%
HP EliteBook x360 1040 G11
Intel Core Ultra 7 165H, Intel Arc 8-Core iGPU
47.3 (5.3min, 10.1P1) fps -18%
Lenovo ThinkBook 13x G4 21KR0008GE
Intel Core Ultra 5 125H, Intel Arc 7-Core iGPU
44 fps -24%
Framework Laptop 13.5 Ryzen 7 7840U
AMD Ryzen 7 7840U, AMD Radeon 780M
43 (13.6min, 21.3P1) fps -26%
Dell XPS 13 9340 Core Ultra 7
Intel Core Ultra 7 155H, Intel Arc 8-Core iGPU
41 fps -29%
Asus Zenbook S 13 OLED
AMD Ryzen 7 6800U, AMD Radeon 680M
40.2 (17.3min, 27.4P1) fps -31%
MSI Prestige 13 AI Evo
Intel Core Ultra 7 155H, Intel Arc 8-Core iGPU
32 fps -45%
Dell XPS 13 Plus 9320 i7-1280P OLED
Intel Core i7-1280P, Intel Iris Xe Graphics G7 96EUs
29.6 (9min, 10.7P1) fps -49%
Dell XPS 13 Plus 9320 4K
Intel Core i7-1260P, Intel Iris Xe Graphics G7 96EUs
29.5 (8.2min, 10.5P1) fps -49%
Dell XPS 13 Plus 9320 Core i7-1360P
Intel Core i7-1360P, Intel Iris Xe Graphics G7 96EUs
27.5 (5.6min, 7.31P1) fps -53%
HP Dragonfly G4
Intel Core i7-1365U, Intel Iris Xe Graphics G7 96EUs
24.7 (5.3min, 6.86P1) fps -57%
Asus ZenBook S13 OLED UX5304
Intel Core i7-1355U, Intel Iris Xe Graphics G7 96EUs
23.6 (5min, 6.37P1) fps -59%
Lenovo Yoga 6 13 83B2001SGE
AMD Ryzen 7 7730U, AMD Radeon RX Vega 8 (Ryzen 4000/5000)
22.7 (5min, 5.54P1) fps -61%
Tiny Tina's Wonderlands - 1280x720 Lowest Preset (DX12)
Framework Laptop 13.5 Ryzen 7 7840U
AMD Ryzen 7 7840U, AMD Radeon 780M
111.8 fps +15%
Усредн. модель с Intel Arc Graphics 140V
  (96.9 - 111.4, n=4)
102.5 fps +6%
Dell XPS 13 9350
Intel Core Ultra 7 256V, Intel Arc Graphics 140V
96.9 fps
HP EliteBook x360 1040 G11
Intel Core Ultra 7 165H, Intel Arc 8-Core iGPU
80 fps -17%
Dell XPS 13 Plus 9320 Core i7-1360P
Intel Core i7-1360P, Intel Iris Xe Graphics G7 96EUs
53.5 fps -45%
HP Dragonfly G4
Intel Core i7-1365U, Intel Iris Xe Graphics G7 96EUs
53.2 fps -45%
F1 22
1280x720 Ultra Low Preset AA:T AF:16x
Усредн. модель с Intel Arc Graphics 140V
  (132.4 - 154.8, n=4)
142.3 fps +7%
Framework Laptop 13.5 Ryzen 7 7840U
AMD Ryzen 7 7840U, AMD Radeon 780M
133.2 (110min, 87P1) fps +1%
Dell XPS 13 9350
Intel Core Ultra 7 256V, Intel Arc Graphics 140V
132.4 (101min, 88P1) fps
HP EliteBook x360 1040 G11
Intel Core Ultra 7 165H, Intel Arc 8-Core iGPU
104.5 (86min, 78P1) fps -21%
MSI Prestige 13 AI Evo
Intel Core Ultra 7 155H, Intel Arc 8-Core iGPU
86.6 (72min, 63P1) fps -35%
Dell XPS 13 Plus 9320 Core i7-1360P
Intel Core i7-1360P, Intel Iris Xe Graphics G7 96EUs
81.5 (61min, 60P1) fps -38%
HP Dragonfly G4
Intel Core i7-1365U, Intel Iris Xe Graphics G7 96EUs
75.8 (55min, 56P1) fps -43%
Asus ZenBook S13 OLED UX5304
Intel Core i7-1355U, Intel Iris Xe Graphics G7 96EUs
71.8 (54min, 54P1) fps -46%
1920x1080 Low Preset AA:T AF:16x
Усредн. модель с Intel Arc Graphics 140V
  (79.1 - 101, n=4)
90.4 fps +14%
Framework Laptop 13.5 Ryzen 7 7840U
AMD Ryzen 7 7840U, AMD Radeon 780M
80.6 (70min, 55P1) fps +2%
Dell XPS 13 9350
Intel Core Ultra 7 256V, Intel Arc Graphics 140V
79.1 (63min, 61P1) fps
HP EliteBook x360 1040 G11
Intel Core Ultra 7 165H, Intel Arc 8-Core iGPU
71 (57min, 52P1) fps -10%
MSI Prestige 13 AI Evo
Intel Core Ultra 7 155H, Intel Arc 8-Core iGPU
59.1 (46min, 44P1) fps -25%
Dell XPS 13 Plus 9320 Core i7-1360P
Intel Core i7-1360P, Intel Iris Xe Graphics G7 96EUs
47.5 (40min, 37P1) fps -40%
HP Dragonfly G4
Intel Core i7-1365U, Intel Iris Xe Graphics G7 96EUs
43.6 (34min, 31P1) fps -45%
Asus ZenBook S13 OLED UX5304
Intel Core i7-1355U, Intel Iris Xe Graphics G7 96EUs
41.6 (33min, 31P1) fps -47%
Lenovo Yoga 6 13 83B2001SGE
AMD Ryzen 7 7730U, AMD Radeon RX Vega 8 (Ryzen 4000/5000)
35.1 (29min, 25P1) fps -56%
1920x1080 Medium Preset AA:T AF:16x
Усредн. модель с Intel Arc Graphics 140V
  (75.7 - 90, n=4)
83.3 fps +6%
Dell XPS 13 9350
Intel Core Ultra 7 256V, Intel Arc Graphics 140V
78.8 (37min, 40P1) fps
Framework Laptop 13.5 Ryzen 7 7840U
AMD Ryzen 7 7840U, AMD Radeon 780M
72.5 (58min, 45P1) fps -8%
HP EliteBook x360 1040 G11
Intel Core Ultra 7 165H, Intel Arc 8-Core iGPU
57.5 (49min, 37P1) fps -27%
MSI Prestige 13 AI Evo
Intel Core Ultra 7 155H, Intel Arc 8-Core iGPU
49.6 (41min, 37P1) fps -37%
Dell XPS 13 Plus 9320 Core i7-1360P
Intel Core i7-1360P, Intel Iris Xe Graphics G7 96EUs
42.8 (37min, 36P1) fps -46%
HP Dragonfly G4
Intel Core i7-1365U, Intel Iris Xe Graphics G7 96EUs
39.4 (33min, 30P1) fps -50%
Asus ZenBook S13 OLED UX5304
Intel Core i7-1355U, Intel Iris Xe Graphics G7 96EUs
36.6 (31min, 28P1) fps -54%
Lenovo Yoga 6 13 83B2001SGE
AMD Ryzen 7 7730U, AMD Radeon RX Vega 8 (Ryzen 4000/5000)
32.5 (26min, 24P1) fps -59%
1920x1080 High Preset AA:T AF:16x
Dell XPS 13 9350
Intel Core Ultra 7 256V, Intel Arc Graphics 140V
64.5 (45min, 43P1) fps
Усредн. модель с Intel Arc Graphics 140V
  (54.8 - 66.5, n=4)
62.4 fps -3%
Framework Laptop 13.5 Ryzen 7 7840U
AMD Ryzen 7 7840U, AMD Radeon 780M
54.2 (44min, 35P1) fps -16%
HP EliteBook x360 1040 G11
Intel Core Ultra 7 165H, Intel Arc 8-Core iGPU
43.5 (30min, 27P1) fps -33%
MSI Prestige 13 AI Evo
Intel Core Ultra 7 155H, Intel Arc 8-Core iGPU
36.8 (30min, 29P1) fps -43%
Dell XPS 13 Plus 9320 Core i7-1360P
Intel Core i7-1360P, Intel Iris Xe Graphics G7 96EUs
31.9 (24min, 26P1) fps -51%
Asus ZenBook S13 OLED UX5304
Intel Core i7-1355U, Intel Iris Xe Graphics G7 96EUs
27.6 (21min, 21P1) fps -57%
HP Dragonfly G4
Intel Core i7-1365U, Intel Iris Xe Graphics G7 96EUs
27.4 (22min, 22P1) fps -58%
Lenovo Yoga 6 13 83B2001SGE
AMD Ryzen 7 7730U, AMD Radeon RX Vega 8 (Ryzen 4000/5000)
23.6 (21min, 19P1) fps -63%
Cyberpunk 2077 2.1 Phantom Liberty
1280x720 Low Preset (FSR off)
Dell XPS 13 9350
Intel Core Ultra 7 256V, Intel Arc Graphics 140V
66.6 (50.2min) fps
Усредн. модель с Intel Arc Graphics 140V
  (58.8 - 68.8, n=5)
66.1 fps -1%
HP EliteBook x360 1040 G11
Intel Core Ultra 7 165H, Intel Arc 8-Core iGPU
48.9 (41min) fps -27%
1920x1080 Low Preset (FSR off)
Dell XPS 13 9350
Intel Core Ultra 7 256V, Intel Arc Graphics 140V
45.7 (36.4min) fps
Усредн. модель с Intel Arc Graphics 140V
  (30.5 - 47.3, n=12)
42.5 fps -7%
Asus Zenbook S 14 UX5406
Intel Core Ultra 7 258V, Intel Arc Graphics 140V
39.6 (31.4min) fps -13%
HP EliteBook x360 1040 G11
Intel Core Ultra 7 165H, Intel Arc 8-Core iGPU
31.5 (26.7min) fps -31%
Lenovo ThinkBook 13x G4 21KR0008GE
Intel Core Ultra 5 125H, Intel Arc 7-Core iGPU
23.2 (13.7min) fps -49%
1920x1080 Medium Preset (FSR off)
Dell XPS 13 9350
Intel Core Ultra 7 256V, Intel Arc Graphics 140V
37 (30.1min) fps
Усредн. модель с Intel Arc Graphics 140V
  (24.3 - 39.3, n=12)
34.9 fps -6%
Asus Zenbook S 14 UX5406
Intel Core Ultra 7 258V, Intel Arc Graphics 140V
31.7 (26.7min) fps -14%
HP EliteBook x360 1040 G11
Intel Core Ultra 7 165H, Intel Arc 8-Core iGPU
25.7 (22.2min) fps -31%
Lenovo ThinkBook 13x G4 21KR0008GE
Intel Core Ultra 5 125H, Intel Arc 7-Core iGPU
19.8 (11.5min) fps -46%
1920x1080 High Preset (FSR off)
Dell XPS 13 9350
Intel Core Ultra 7 256V, Intel Arc Graphics 140V
32 (26.2min) fps
Усредн. модель с Intel Arc Graphics 140V
  (20 - 34.4, n=12)
29.7 fps -7%
Asus Zenbook S 14 UX5406
Intel Core Ultra 7 258V, Intel Arc Graphics 140V
27.7 (22.8min) fps -13%
HP EliteBook x360 1040 G11
Intel Core Ultra 7 165H, Intel Arc 8-Core iGPU
23.9 (20.8min) fps -25%
Lenovo ThinkBook 13x G4 21KR0008GE
Intel Core Ultra 5 125H, Intel Arc 7-Core iGPU
16.6 (8.88min) fps -48%
1920x1080 Ultra Preset (FSR off)
Усредн. модель с Intel Arc Graphics 140V
  (17.5 - 30.1, n=12)
24.6 fps +29%
Asus Zenbook S 14 UX5406
Intel Core Ultra 7 258V, Intel Arc Graphics 140V
24.3 (19.9min) fps +27%
HP EliteBook x360 1040 G11
Intel Core Ultra 7 165H, Intel Arc 8-Core iGPU
21.6 (18.5min) fps +13%
Dell XPS 13 9350
Intel Core Ultra 7 256V, Intel Arc Graphics 140V
19.1 (15.5min) fps
Lenovo ThinkBook 13x G4 21KR0008GE
Intel Core Ultra 5 125H, Intel Arc 7-Core iGPU
14.8 (7.18min) fps -23%

Частота кадров, Cyberpunk 2077

05101520Tooltip
Dell XPS 13 9350 Core Ultra 7 256V, Arc 140V: Ø22.2 (18.3-23.3)
мин.сред.выс.макс.
GTA V (2015) 154.9 149.4 60.8 25.6
Dota 2 Reborn (2015) 95.8 87 83 80.7
Final Fantasy XV Benchmark (2018) 79.4 46.1 31.5
X-Plane 11.11 (2018) 47.1 36.1 30.1
Far Cry 5 (2018) 80 52 45 42
Strange Brigade (2018) 201 84.4 65.2 58
Tiny Tina's Wonderlands (2022)
F1 22 (2022) 79.1 78.8 64.5
Baldur's Gate 3 (2023) 36.6 30.5 25.8 25.7
Cyberpunk 2077 2.1 Phantom Liberty (2023) 45.7 37 32 19.1

Температурные и акустические показатели

Система охлаждения

Внутренние вентиляторы работают еще тише, чем раньше, в том смысле, что они гораздо дольше остаются незадействованными при повышенных нагрузках. Например, шум вентилятора достигает отметки 26,2 дБ(А) после запуска первой сцены бенчмарка 3DMark 06 по сравнению с 35 дБ(А) или 37 дБ(А) на старших моделях XPS 13 9320 и XPS 13 9340 соответственно.

В играх шум вентилятора составляет всего 34 дБ(А) даже в режиме Performance, но он может повышаться до 45 дБ(А), если процессор загружен на 100%, как, например, при выполнении стрессовой игры Prime95. Работа в сбалансированном режиме вместо режима производительности снизит потолок шума вентилятора до диапазона 33-38 дБ(А).

Профиль шума вентилятора (Белый: Фоновый, Красный: Простой системы, Синий: 3DMark 06, Оранжевый: Cyberpunk 2077, Зеленый: Prime95 stress)

Уровень шума

Ожидание
24.4 / 24.4 / 24.4 дБ
Нагрузка
26.2 / 45.2 дБ
  red to green bar
 
 
30 dB
бесшумно
40 dB(A)
различимо
50 dB(A)
громко
 
min: dark, med: mid, max: light   Earthworks M23R, Arta (15 см от источника шума)   фоновый шум: 24.1 dB(A)
dB(A) 0102030405060708090Deep BassMiddle BassHigh BassLower RangeMidsHigher MidsLower HighsMid HighsUpper HighsSuper Highs2039.836.835.936.638.22527.427.224.927.325.73124.826.422.123.724.44021.722.220.118.821.65025.924.221.222.724.16324.424232424.38028.428.726.226.327.810024.424.222.922.623.712520.919.41918.32416020.12018.617.421.920021.12019.717.322.325021.218.718.317.62631523.62321.62126.940023.219.218.11730.4500231715.814.23163021.515.213.613.632.180020.311.811.210.732.2100022.910.59.89.731.9125022.79.79.49.533.3160022.39.89.69.534.7200022.710.39.89.934.5250022.910.91010.134.8315023.812.310.510.634.6400024.21410.81134.7500021.515.311.511.633.4630019.51511.411.432.7800018.314.711.711.529.71000013.614.311.811.527.71250013.113.512.611.924.61600012.512.612.51119.2SPL34.226.224.424.145.2N20.80.60.65.1median 21.5median 14.7median 11.8median 11.5median 31Delta1.94.14.13.14.5hearing rangehide median Fan NoiseDell XPS 13 9350
Dell XPS 13 9350
Arc 140V, Core Ultra 7 256V, Micron 2550 512GB
Dell XPS 13 Plus 9320 i7-1280P OLED
Iris Xe G7 96EUs, i7-1280P, WDC PC SN810 512GB
Lenovo ThinkBook 13x G4 21KR0008GE
Arc 7-Core, Ultra 5 125H, Samsung PM9C1a MZAL8512HDLU
HP Dragonfly G4
Iris Xe G7 96EUs, i7-1365U, Micron 3400 MTFDKBA512TFH 512GB
Asus ZenBook S13 OLED UX5304
Iris Xe G7 96EUs, i7-1355U, Samsung PM9A1 MZVL21T0HCLR
MSI Prestige 13 AI Evo
Arc 8-Core, Ultra 7 155H, Samsung PM9A1 MZVL21T0HCLR
Уровень шума
-1%
-5%
3%
-3%
-4%
в выкл. виде (фон) *
24.1
23.4
3%
24.5
-2%
23.3
3%
23.3
3%
23.4
3%
Мин. в простое *
24.4
23.4
4%
24.5
-0%
23.5
4%
23.3
5%
23.4
4%
В простое, сред. *
24.4
23.4
4%
24.5
-0%
23.5
4%
23.3
5%
26.9
-10%
В простое, макс. *
24.4
23.4
4%
27.1
-11%
26.8
-10%
23.3
5%
26.9
-10%
Нагрузка, сред. *
26.2
35
-34%
33.3
-27%
27.2
-4%
37.7
-44%
32
-22%
Cyberpunk 2077 ultra *
34.2
Нагрузка, макс. *
45.2
39.9
12%
40.7
10%
35
23%
40.1
11%
40.3
11%
Witcher 3 ultra *
41.6
36.8
32.7
40.1
32

* ... меньше = лучше

Температура

Температура поверхности заметно улучшилась по сравнению с более старыми вариантами, включая недавнюю модель XPS 13 9340. Температура клавиатуры и нижней крышки достигает 35 C и 38 C, соответственно, по сравнению с 41 C и 44 C у XPS 13 9340 при аналогичных нагрузках. Одним из наших критических замечаний к новому дизайну XPS 13 была относительно высокая температура поверхности, но XPS 13 9350 определенно является одной из более холодных итераций на сегодняшний день.
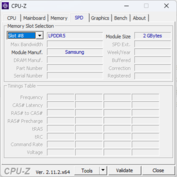
Адаптер переменного тока достигает температуры более 35 C при работе с высокими нагрузками
Двойной задний выхлоп
Макс.
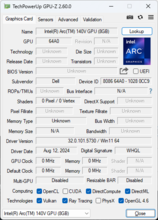
 28 °C34.8 °C34.2 °C 
 23.6 °C28 °C26.8 °C 
 26.2 °C26.6 °C27.6 °C 
Макс.: 34.8 °C
Усредн.: 28.4 °C
35.8 °C37.4 °C34.4 °C
31.2 °C35.8 °C32.6 °C
29.2 °C30.8 °C29.2 °C
Макс.: 37.4 °C
Усредн.: 32.9 °C
ЗУ (макс.)  37.4 °C | Темп. воздуха 20 °C | Fluke 62 Mini IR Thermometer
(+) При нагрузочном тестировании верх корпуса нагревается в среднем до 28.4 град. Типичное значение для устройств этого же класса (Subnotebook) = 30.8 градуса (-ов).
(+) Макс. температура верха корпуса составила 34.8 град. Цельсия. Типичное значение для устройств этого же класса (Subnotebook) = 35.9 градуса (-ов) при минимуме в 21.4 град. и максимуме в 59 град.
(+) Макс. температура дна составила 37.4 град. Цельсия. Типичное значение для устройств этого же класса = 39.4 градуса (-ов).
(+) При отсутствии вычислительной нагрузки верх корпуса нагревается в среднем до 24.9 град. Типичное значение для устройств этого же класса = 30.8 градуса (-ов).
(+) Палуба на ощупь: Прохладно (27.6 град. Цельсия).
(±) Средняя температура палубы у похожих моделей составила 28.3 град. Цельсия, это +0.7 градуса (-ов) разницы.
Система простаивает (крышка C)
Система простаивает (крышка D)
Prime95+FurMark stress (C cover)
Prime95+FurMark стресс (D обложка)
Dell XPS 13 9350
Intel Core Ultra 7 256V, Intel Arc Graphics 140V
Dell XPS 13 9340 Core Ultra 7
Intel Core Ultra 7 155H, Intel Arc 8-Core iGPU
Lenovo ThinkBook 13x G4 21KR0008GE
Intel Core Ultra 5 125H, Intel Arc 7-Core iGPU
HP Dragonfly G4
Intel Core i7-1365U, Intel Iris Xe Graphics G7 96EUs
Asus ZenBook S13 OLED UX5304
Intel Core i7-1355U, Intel Iris Xe Graphics G7 96EUs
MSI Prestige 13 AI Evo
Intel Core Ultra 7 155H, Intel Arc 8-Core iGPU
Нагрев
-8%
-12%
-10%
-14%
-5%
Нагрузка, макс. сверху *
34.8
41
-18%
43.1
-24%
38.6
-11%
43.1
-24%
40.9
-18%
Нагрузка, макс. на дне *
37.4
43.5
-16%
39.2
-5%
40.4
-8%
45
-20%
40.4
-8%
В простое сверху *
25.4
25.3
-0%
28.3
-11%
28.2
-11%
27.3
-7%
25
2%
В простое на дне *
26.2
25.5
3%
28
-7%
29
-11%
27.8
-6%
25.5
3%

* ... меньше = лучше

Акустическая система

Розовый шум демонстрирует достойную максимальную громкость для своего размера, но со слабым воспроизведением низких частот. Серия HP Spectre предлагает более широкий и громкий звук
dB(A) 0102030405060708090Deep BassMiddle BassHigh BassLower RangeMidsHigher MidsLower HighsMid HighsUpper HighsSuper Highs2036.135.936.12527.624.927.63125.122.125.14020.320.120.35023.921.223.96328.82328.88039.926.239.910049.422.949.412552.11952.116059.818.659.820061.419.761.425058.218.358.231556.621.656.640056.518.156.550064.115.864.163068.213.668.280071.611.271.6100073.39.873.3125069.99.469.9160073.89.673.82000739.873250072.91072.9315072.710.572.7400067.110.867.1500066.111.566.1630067.411.467.4800057.111.757.11000057.511.857.51250059.612.659.61600064.812.564.8SPL82.624.482.6N53.60.653.6median 64.8median 11.8median 64.8Delta6.94.16.926.325.821.422.12624.925.127.622.532.523.448.72655.818.860.922.167.2267019.372.317.674.217.774.319.575.31571.711.871.311.27410.574.21072.710.17210.67210.97511.374.811.671.71269.71269.612.371.112.669.61270.111.269.824.784.70.666.6median 12median 71.73.42.2hearing rangehide median Pink NoiseDell XPS 13 9350Apple MacBook Pro 16 2021 M1 Pro
АЧХ (если нужно отключить сравнение, нажмите на квадратики сверху)
Анализ АЧХ аудиосистемы Dell XPS 13 9350

(+) | отличный уровень макс. громкости (82.6 дБА)
Низкие частоты (100 Гц - 315 Гц)
(±) | баса мало (на 8.5% меньше медианы)
(±) | он умеренно сбалансирован
Средние частоты (400 Гц - 2000 Гц)
(±) | диапазон воспроизводится громче желаемого (отклонение 6.2% от медианы)
(+) | он ровный, без "горбов" или провалов
Высокие частоты (2 кГц - 16 кГц)
(±) | диапазон воспроизводится громче желаемого (отклонение 5.3% от медианы)
(+) | он ровный, без "горбов" или провалов
Весь диапазон (100 - 16000 Гц)
(+) | звук в целом сбалансирован (13% отличия от медианы)
в сравнении с устройствами того же класса
» 18% прямо сравнимых устройств показал(и) себя лучше, 3% примерно так же, 79% значительно хуже
» Δ наилучшего устройства из прямо сравнимых: 5%, средняя Δ: 19%, худший результат: 53%
в сравнении со всеми тестированными устройствами
» 11% известных нам устройств показал(и) себя лучше, 2% примерно так же, 87% значительно хуже
» Δ наилучшего устройства среди известных нам: 4%, средняя Δ: 25%, худший результат: 134%

Анализ АЧХ аудиосистемы Apple MacBook Pro 16 2021 M1 Pro

(+) | отличный уровень макс. громкости (84.7 дБА)
Низкие частоты (100 Гц - 315 Гц)
(+) | бас отлично сбалансирован (отклонение лишь 3.8% от медианы)
(+) | он ровный, без "горбов" или провалов
Средние частоты (400 Гц - 2000 Гц)
(+) | диапазон не провален и не выпячен (отклонение лишь 1.3% от медианы)
(+) | он ровный, без "горбов" или провалов
Высокие частоты (2 кГц - 16 кГц)
(+) | диапазон отлично сбалансирован (отклонение лишь 1.9% от медианы)
(+) | он ровный, без "горбов" или провалов
Весь диапазон (100 - 16000 Гц)
(+) | звук в целом сбалансирован (4.6% отличия от медианы)
в сравнении с устройствами того же класса
» 0% прямо сравнимых устройств показал(и) себя лучше, 0% примерно так же, 100% значительно хуже
» Δ наилучшего устройства из прямо сравнимых: 5%, средняя Δ: 18%, худший результат: 45%
в сравнении со всеми тестированными устройствами
» 0% известных нам устройств показал(и) себя лучше, 0% примерно так же, 100% значительно хуже
» Δ наилучшего устройства среди известных нам: 4%, средняя Δ: 25%, худший результат: 134%

Энергопотребление и автономная работа

Энергопотребление

Потребление невероятно низкое - всего <1,4 Вт при минимальной яркости и всего 5 Вт при максимальной яркости и режиме Performance. Низкие показатели холостого хода, вероятно, объясняют очень длительное время работы WLAN в нашем разделе "Время работы от батареи" ниже. Альтернативные 13-дюймовые ноутбуки, такие как Lenovo ThinkBook 13x или HP Dragonfly G4 имеют сравнительно более высокие минимальные и максимальные показатели на несколько ватт.

Во время игр система потребляет 46 Вт, что почти на 10 Вт больше, чем у конкурирующих 13-дюймовых субноутбуков, таких как упомянутые выше. Однако система Dell предлагает значительно более высокую графическую производительность, как отмечалось в нашем разделе "Производительность GPU", поэтому увеличение потребления, вероятно, стоит того с точки зрения производительности на ватт.

Очень маленький (~6,5 x 5,5 x 2,2 см) адаптер переменного тока USB-C мощностью 60 Вт может одновременно поддерживать работу с требовательными нагрузками и зарядку аккумулятора. Потребление может достигать более 55 Вт при 100-процентной загрузке процессора, но этот показатель является временным, как показано на скриншотах ниже.

3DMark 06
3DMark 06
Cyberpunk 2077 1080p Ультра
Prime95
Prime95
Prime95+FurMark
Prime95+FurMark
Энергопотребление
Выкл.darklight 0.35 / 0.56 Вт
Ожиданиеdarkmidlight 1.3 / 2.5 / 4.1 Вт
Нагрузка midlight 40.1 / 57.3 Вт
 color bar
Легенда: min: dark, med: mid, max: light        Metrahit Energy
Dell XPS 13 9350
Core Ultra 7 256V, Arc 140V, Micron 2550 512GB, IPS, 1920x1200, 13.4"
Dell XPS 13 Plus 9320 i7-1280P OLED
i7-1280P, Iris Xe G7 96EUs, WDC PC SN810 512GB, OLED, 3456x2160, 13.4"
Lenovo ThinkBook 13x G4 21KR0008GE
Ultra 5 125H, Arc 7-Core, Samsung PM9C1a MZAL8512HDLU, IPS, 2880x1920, 13.5"
HP Dragonfly G4
i7-1365U, Iris Xe G7 96EUs, Micron 3400 MTFDKBA512TFH 512GB, IPS, 1920x1280, 13.5"
Asus ZenBook S13 OLED UX5304
i7-1355U, Iris Xe G7 96EUs, Samsung PM9A1 MZVL21T0HCLR, OLED, 2880x1800, 13.3"
MSI Prestige 13 AI Evo
Ultra 7 155H, Arc 8-Core, Samsung PM9A1 MZVL21T0HCLR, OLED, 2880x1800, 13.3"
Энергопотребление
-176%
-137%
-104%
-139%
-116%
В простое, мин. *
1.3
6.5
-400%
5.4
-315%
4.1
-215%
5.8
-346%
4.5
-246%
В простое, сред. *
2.5
7.8
-212%
7.8
-212%
7.5
-200%
8.5
-240%
8
-220%
В простое, макс. *
4.1
13
-217%
8.9
-117%
8.2
-100%
8.8
-115%
8.7
-112%
Нагрузка, сред. *
40.1
56.6
-41%
49.4
-23%
35.5
11%
35.1
12%
36.1
10%
Cyberpunk 2077 ultra external monitor *
43.1
Cyberpunk 2077 ultra *
46.1
Нагрузка, макс. *
57.3
63
-10%
68.8
-20%
66.5
-16%
59.5
-4%
65
-13%
Witcher 3 ultra *
49.2
44.4
37.5
27.6
29.7

* ... меньше = лучше

Энергопотребление: Cyberpunk 2077, Стресс-тест

051015202530354045505560Tooltip
Dell XPS 13 9350 Core Ultra 7 256V, Arc 140V; 1280x720 Prime95 28.10 and Furmark 1.25: Ø49.1 (41.9-57.2)
Dell XPS 13 9340 Core Ultra 7 Ultra 7 155H, Arc 8-Core; 1280x720 Prime95 28.10 and Furmark 1.25: Ø45.9 (36.1-62.7)
Dell XPS 13 9350 Core Ultra 7 256V, Arc 140V; Idle 150cd/m2: Ø1.954 (1.813-3.29)
Dell XPS 13 9340 Core Ultra 7 Ultra 7 155H, Arc 8-Core; Idle 150cd/m2: Ø5.65 (4.77-8.8)
Dell XPS 13 9350 Core Ultra 7 256V, Arc 140V; Cyberpunk 2077 FHD ultra no FSR 150cd: Ø46.1 (45.1-50.7)

Энергопотребление с внешним монитором

051015202530354045505560Tooltip
Dell XPS 13 9350 Core Ultra 7 256V, Arc 140V; Prime95 V2810 Stress (external Monitor): Ø46.1 (42.2-54.3)
Dell XPS 13 9340 Core Ultra 7 Ultra 7 155H, Arc 8-Core; Prime95 V2810 Stress (external Monitor): Ø47.3 (35.8-62.4)
Dell XPS 13 9350 Core Ultra 7 256V, Arc 140V; Cinebench R15 Multi (external Monitor): Ø50.9 (49.9-51.9)
Dell XPS 13 9340 Core Ultra 7 Ultra 7 155H, Arc 8-Core; Cinebench R15 Multi (external Monitor): Ø60.7 (56.8-61.4)
Dell XPS 13 9350 Core Ultra 7 256V, Arc 140V; 1280x720 FurMark 1.19 GPU Stress Test (external Monitor): Ø35.2 (32.7-44.8)
Dell XPS 13 9340 Core Ultra 7 Ultra 7 155H, Arc 8-Core; 1280x720 FurMark 1.19 GPU Stress Test (external Monitor): Ø40.3 (32.6-57.5)
Dell XPS 13 9350 Core Ultra 7 256V, Arc 140V; Idle 1min (external Monitor): Ø1.596 (1.324-3.63)
Dell XPS 13 9340 Core Ultra 7 Ultra 7 155H, Arc 8-Core; Idle 1min (external Monitor): Ø6.88 (5.99-8.6)
Dell XPS 13 9350 Core Ultra 7 256V, Arc 140V; Cyberpunk 2077 FHD ultra no FSR (external Monitor): Ø43.1 (39.3-47.2)

Автономность

Время работы значительно улучшилось, как и на других ноутбуках Lunar Lake. Мы смогли записать более 20 часов работы в реальном режиме в сети WLAN, что легко превзошло все предыдущие конфигурации XPS 13 и большинство других 13-дюймовых субноутбуков. Еще более удивительно то, что емкость батареи остается меньше, чем у многих конкурентов, несмотря на преимущество во времени работы.

Зарядка от пустой до полной батареи с помощью прилагаемого адаптера переменного тока занимает немного больше времени, чем ожидалось - около 140 минут.

Автономная работа
Без нагрузки
56час. 47мин.
WiFi Websurfing
20час. 36мин.
Макс. расход энергии
2час. 22мин.
Dell XPS 13 9350
Core Ultra 7 256V, Arc 140V, 55 Вт⋅ч
Dell XPS 13 Plus 9320 i7-1280P OLED
i7-1280P, Iris Xe G7 96EUs, 55 Вт⋅ч
Lenovo ThinkBook 13x G4 21KR0008GE
Ultra 5 125H, Arc 7-Core, 74 Вт⋅ч
HP Dragonfly G4
i7-1365U, Iris Xe G7 96EUs, 68 Вт⋅ч
Asus ZenBook S13 OLED UX5304
i7-1355U, Iris Xe G7 96EUs, 63 Вт⋅ч
MSI Prestige 13 AI Evo
Ultra 7 155H, Arc 8-Core, 75 Вт⋅ч
Время работы
-72%
-32%
-4%
-21%
-13%
В простое
3407
2550
-25%
Чтение сайтов по Wi-Fi v.2
1236
346
-72%
684
-45%
954
-23%
678
-45%
694
-44%
Нагрузка и 100% яркости
142
116
-18%
192
35%
146
3%
169
19%
Воспр. видео H.264
1229
829
1002

Общая оценка Notebookcheck

Lunar Lake превратил XPS 13 в лучшего соперника в борьбе с MacBook Air 13.

Dell XPS 13 9350 - 05 November 2024 v8
Allen Ngo

Корпус
87 / 98 → 88%
Клавиатура
78%
Трекпад
83%
Порты и связь
60 / 74 → 81%
Вес
73 / 20-77 → 92%
Время работы
92%
Дисплей
86%
3D-производительность
52 / 75 → 70%
Производительность ЦП
82 / 92 → 89%
AI Performance
89%
Нагрев
94%
Шумность
89%
Аудио
77 / 91 → 84%
Камера
32 / 75 → 42%
Средний балл
71%
85%
Subnotebook - Итоговый рейтинг
CO2 Emissions
No Data
Materials
100%
Packaging
100%
Power Use
88%
Repairability
40%
Software Updates
22.3%
Recycle Logo Total Sustainability Score: 58.4%

Декларация о непредвзятости

Протестированный экземпляр был выдан автору этого материала на короткое время для целей тестирования. Производитель товара или магазин, выдавший нам этот товар на время, не имели никакого влияния на результаты тестирования и не видели текст обзора до его публикации; статья написана не в качестве исполнения любых обязательств перед кем-либо.

This is how Notebookcheck is testing

Every year, Notebookcheck independently reviews hundreds of laptops and smartphones using standardized procedures to ensure that all results are comparable. We have continuously developed our test methods for around 20 years and set industry standards in the process. In our test labs, high-quality measuring equipment is utilized by experienced technicians and editors. These tests involve a multi-stage validation process. Our complex rating system is based on hundreds of well-founded measurements and benchmarks, which maintains objectivity. Further information on our test methods can be found here.

Этот важный материал точно понравится твоим друзьям в социальных сетях!
Mail Logo
'
> Обзоры Ноутбуков, Смартфонов, Планшетов. Тесты и Новости > Обзоры > Обзор ноутбука Dell XPS 13 9350: Intel Lunar Lake идеально подходит этой модели
Allen Ngo, 2024-11- 7 (Update: 2024-11- 7)